| Oracle® Health Sciences Data Management Workbench User's Guide Release 2.4 E52292-02 |
|
|
PDF · Mobi · ePub |
Home > User's Guide > Transforming Data to Standa...
| Oracle® Health Sciences Data Management Workbench User's Guide Release 2.4 E52292-02 |
|
|
PDF · Mobi · ePub |
Home > User's Guide > Transforming Data to Standa...
To move data from one clinical data model to anotherâfor example, merging data in InForm and lab input models into a single Review model, or transforming a Review model to an SDTM Analysis modelâyou create a transformation.
The system provides a user interface that supports complex data transformations.
At the table level, the user interface supports:
Joins, self-joins, unions, pivots, unpivots, or direct 1-to-1 mappings.
Creating staging tables to hold data at an intermediate stage in the transformation. For example, you can create a staging layer to normalize source data before transforming it to your standard review model.
Defining criteria, or source filters, for the data to be included in the Where clause and written to the target table.
At the column level, mappings are constrained by parent table mappings and can include:
Structural mappings that implement the table-level relationship. For example, in a Many-to-1 table relationship, mapping one column from each source table to a single column in the target table.
Functional mappings to support data derivations, including writing expressions on one or more columns for data manipulations such as unit conversions, string manipulations, or inserting a hard-coded value. You can also call SQL functions and lookup tables from a library you develop in Oracle Life Sciences Data Hub (Oracle LSH). These functions can take column values as input parameter values.
The Automap feature maps tables and columns within mapped source and target models. You review the suggested mappings and accept as many as appropriate, then manually map the rest. The system uses these mappings to generate one PL/SQL program for the transformation to each target table.
You can set up transformations to run on a schedule and to trigger all validation checks in the target model and any downstream transformations and validation checks for other models in sequence, so that all models and users always have the most current data possible. You can set blinding to cascade downstream.
If a table mapping or any column mapping within a table mapping requires code that you cannot define in the user interfaceâfor example, data aggregation or a 1-to-many table mappingâyou can write a custom program in Oracle LSH for the table transformation and attach it to the table mapping in the user interface; see "Creating a Custom Program".
You must create the source and target data models and tables before you can create the transformation between them.
To create transformation mappings, do the following tasks in order:
You can view existing table or column mappings in the user interface and export them to a spreadsheet by clicking the Export All to Excel icon in the Target Table or Target Columns pane.
You must first map at the highest level: identifying the target clinical data model and one or more source models. For example, map all your input models from Oracle Health Sciences InForm and from each lab to a standard review model for studies of a particular type such as cardiology or immunology.
Go to Study Configuration, then Transformations at the bottom of the right-hand pane. The system displays a list of all the study's clinical data models defined as targetsâthat is, data models to be populated by data from within the system by a transformation, not by loading from an external data source such as InForm or a lab.
Select the clinical data model to be the target of this transformation.
The system displays its tables in both the Target Tables and Source Tables panes in case you want to populate some target tables with data already transferred or transformed into other target tables.
Click the Add or Remove Source Model icon in the Source Tables pane. The Add Model window opens, listing all other models in the study and indicating if each one is an Input or Target-type model.
Select one or more models to feed data into the transformation's target model.
For each, select the Can Trigger check box if you want the completion of a job updating data in the source model to trigger the execution of this transformation.
Click OK.
The system lists the models in the Model column and all tables in the selected models in the Table column.
After you have mapped one or more source models to the target model, you must specify how to handle every table in the target model: either mark it Not Used or map it to one or more source tables. See "Marking Target Tables and Columns as Not Used".
To allow many people to work on a single model-level transformation at the same time, each person can create a side model with selected target tables to work on in a corresponding side transformation.
In the Target Tables pane of the transformation, select the target tables you want to work on. Use Ctrl+click or Shift+click to select multiple tables. The Create Side Model icon is enabled when you select the first table.
An icon between the mapping icon and the table name indicates tables that are already included in side models. Hover over the icon to see which side model includes the table and the user who has it checked out. If you select a table that is already included in a side model, a message appears when you click Create Side Model.
You can select tables marked Not Used. If you map them in the side model, they will be mapped and marked Used when you merge back to the main transformation.
Notes:
To work with a staging table you must create it in the main transformation and then select it for your side transformation; see "Creating Staging Tables".
A table can be the target of only one side transformation at a time. Oracle recommends working on one side model at a time, then merging it into the main transformation and deleting the side model.
Click the Create Side Model icon. The Create Side Model window opens.
Enter a name for the side model. If you enter a name that already exists, the system appends _1 or higher to the name when you save.
Click OK. The system displays the side model under the target model in the Transformation pane on the left, with an icon indicating that you have checked it out, and opens a checked-out side transformation with the selected target tables and any existing mappings.
You can check in, install, and execute the side transformation without affecting the main transformation. You can see data in the target tables in the Listings page and create custom listings on their data.
The Upgrade Required message appears in the side transformation if a source or target model has been modified and the main transformation has been upgraded. (The main transformation must be upgraded before any side transformations.) Click the Upgrade icon to upgrade.
An administrator can check in side models created and checked out by other users so that work can proceed in the absence of the original user.
Navigate to the main transformation for the target model.
Check out the main transformation. If another user has it checked out, you cannot copy the side model into it.
Click the Copy from Side Model icon in the Target Tables pane. A window opens that lists all side models.
Select the side model and click Next. If any tables have been modified since you created the side model, the system displays a message and you can choose to include the tables in the copy or not.
If you continue, the side model tables overwrite the main model tables.
If you cancel the copy operation, you can upgrade the side model to reflect changes made in the main model.
When you have finished using a side model, select and delete it using the Delete Side Model icon. The system warns you if its side transformation has not been copied to the main transformation.
Side models are intended for temporary use only and have limitations:
Side models cannot be used as source models for other transformations.
If a validation check raises discrepancies on data in a side model, lineage tracing is not enabled and the discrepancies do not appear in the source model.
You cannot add or remove source models through a side model.
Side models are not visible in the Study Configuration page.
Side models and transformations cannot have a higher validation status than Development.
In the Table Mapping pane, select target tables that are the same or similar to the target table mappings you plan to copy.
Click the Copy from Another Transformation icon. The system displays all target models to which you have access that have checked-in transformations. Type part or all of the name of the Therapeutic Area (or other category), Study, and Model to filter the list.
Select a model. The system displays all the tables in the model. Type all or part of the table name to filter.
Click Next. The system validates and compares the selected target tables in the current model to the selected target tables to be copied and displays the Suggested Mappings window, with details of the transformations to the selected target tables, including, for each target table:
The target table's columns. (Expand the table node to see them.)
The source tables mapped to the target table.
The type of transformation (Direct, Join, Union, Pivot, Unpivot, or Custom).
Any errors or warnings detected by the validation:
For pivot and unpivot transformations, if metadata differences exist, the system displays an error. If the differences are on the source side, they must be resolved manually. If the differences are on the target side, you can run synchronization to resolve the differences and then copy. See "Synchronization".
For union and join transformations, if some of the source tables or columns in the union do not exist in the copied-to study, those mappings are not included and a warning is displayed. If only one table exists in the copied-to study, the union or join map is converted to a direct map and a warning is displayed.
For custom transformations, if metadata differences exist, the system displays an error. If the differences are on the source side, they must be resolved manually. If the differences are on the target side, you can run synchronization to resolve the differences and then copy. See "Synchronization".
For column mappings that use expressions, if all the column references do not exist in the current source tables, the missing column references are removed from the expression.
The system prevents you from copying any transformations with errors, but you can copy those with warnings.
Review the mappings, select those you want to copy, and click Accept Selected Mappings. The system copies the transformation and creates the mappings.
Note:
If the source and target tables in the mappings being copied have more columns than the tables in the current model, you can mark those columns as Not Used; see "Marking Target Tables and Columns as Not Used".The synchronization job modifies the tables in the current model so that they match the table metadata being copied into the current model. Synchronization changes column data type and length, drops additional columns, and creates missing columns.
Automapping can run on all tables and columns in the target model or on up to ten selected target tables for faster results. Use the Automap icon at the top of the page to map all tables, or the icon in the Target Tables pane to map selected tables.
Check the generated mappings and select those you want to accept.
If you define mappings manually before running Automap, your mappings remain unchanged.
The Automap logic uses the following to generate mappings:
Matching metadata: table and column names, column data type and length
Table and column alias matches
Historical mappings in the same installation
After Automap runs, the Transformation Automap window opens, listing the target tables that have been automapped.
To see the column mappings for a table, click the table's node (+). The system displays the target table's columns and the source columns Automap has found to map them to. The Type column shows the type of logic used to find the source column: Name Match, Alias Match, Datatype Match, Historical Map, or Partial Name/Alias Match.
Review all table and column mappings, deselect any you do not want or are not sure about, and then click Accept Selected Mappings.
To map a target table manually:
Select one or more source tables to map to a single target table, select the target table, and click the Map icon in the target table's row.
You can use Ctrl+Click or Shift+Click to select and map multiple source tables to the same target at the same time. You can also map a single source table to a target table and add another source table later.
Program: If the table mapping requires a custom programâfor example, because one or more of its target column mappings requires a more complex expression than can be created in the user interfaceâselect the program to use. See "Creating a Custom Program".
Select a Transformation Type: Direct, Join, Union, Pivot, Unpivot, or Custom.
Note:
In most cases, even if you are using a custom program, select the actual type of table transformation your program performs: Direct, Join, Union, Pivot, or Unpivot. Use Custom only if your program cannot support data lineage tracing; see "Creating a Custom Program".If you specify a transformation type that requires further definitionâJoin, Pivot, or Unpivotâthe system displays an icon after you select that type. Click the icon to supply details; see "Table Transformation Types".
Authorize: This setting is modifiable only if one or more source tables is defined as blinded (its Blinding flag is set to Yes) at any level (whole table, column, row or cell) and you have the required blinding-related privileges. If one or more source tables contains blinded data, by default the target table is completely blinded and only users with special privileges can view the data. However, if you are certain the target table contains only nonblinded data and you have the required privileges, you can authorize that the target table's data not be blinded. This authorization is audited.
Note:
If you have the required privileges, you can change the blinding attributes of the target table so that only the appropriate columns, rows, or cells are blinded. Do this in the Clinical Data Model page; see "Setting Blinding-Related Attributes".Click Save. You can save your work at any point but must save in order to map columns.
Select the target table. The system displays the source table or tables mapped to the target in the Mapped Sources tab, with their:
InForm Ref Path Name if the source table originated in InForm; this fully identifies a field on a CRF.
Logical Names are aliases defined in the clinical data model definition for the table; these values are used in automapping.
You can:
Add an alias to multiple occurrences of the same table to create a self-join; see "Creating a Self-Join in a Transformation".
Write an expression to operate on the source tables' data during the data transformation to the target table by clicking the Source Filters icon; this expression becomes part of the Where clause, restricting the set of source data that participates in the transformation; see "Using the Expression Builder for Transformations and Blinding Criteria".
Note:
You can write expressions to define derivations at the column level in the Column Mapping page.To create a self-join:
In the Mapped Sources tab, select the table in the Source Tables pane and the Target Tables pane and click the Map icon. The system adds the source table to the Mapped Sources tab again. Repeat if necessary. Enter an alias each occurrence and save.
Click the Join icon for the target table. The Join window, displays the table names qualified with an alias to differentiate between the multiple occurrences of the same table. Configure criteria for the self-join and save the table map.
Click the Map Column icon for the target table. The Source Columns pane displays table names qualified with their alias. Select the source column(s) to map to the target column.
Complex transformation may require multiple steps with staging tables to hold data at intermediate steps. For example, to make transformations as reusable as possible, you may want to start by performing source-dependent conversions and derivations into a normalized structure in the staging layer. You then perform reusable source-independent conversions and derivations on the normalized structure to write to the final target table.
Since your source data is likely to be in different structures in different studies, you will need to do some manual remapping from the source to the staging tables when you reuse the transformation and its target model. However, the mappings from the normalized staging structure to the target tables are reusable if they are standard.
You select source tables and columns, and create expressions, joins, and criteria as required and the system generates a staging table and adds it to the target data model. You can use all the same table- and column-level mapping functionality to map to or from a staging table as from a source or target table.
You can map one or more staging tables to another, if two intermediate stages are required. You cannot self-join a staging table. The system maintains data lineage tracing through the staging layer.
To create a staging table:
Click the Create Staging Table icon.
Enter a name and description for the table.
Supports Duplicate: If the table should support duplicate primary key values in a single job, select the check box. This should be used only rarely, but if a data source such as a small lab with limited IT resources cannot ensure that there are no duplicate primary key values in a single data load, this setting allows all the data to be loaded. You may want to also use the setting for tables the original input model table writes to; see "Supporting Duplicate Primary Keys in a Load".
Create Target Mapping?: If checked, the system creates the mappings from the source tables to the staging table when it creates the staging table.
Model Name: In the Source pane, select the source model from the drop-down list. The system displays the model's tables below.
Table and Columns: To add a whole table with all its columns as a source, select it and click the Add icon. To add individual columns in the table, expand the table's node, select the column or columns and click the Add icon.
In addition to being used as sources, these columns become the columns of the staging table. Add comma-separated aliases if necessary.
For each column that should be part of the primary key of the staging table, select the check box in the Primary Key column.
If the source-to-staging transformation requires an expression at the column level, click the Modify icon to use the Expression Builder. To write an expression using two or more column values as inputs, select one of them in the Selected Columns tab, then select the others in the Sources pane and click the arrow icon. The system adds them to the same row in the Selected Columns tab.
Define joins and Where clause criteria as in the Query Builder; see "Building the Validation Check Query".
Save. The system checks out the target clinical data model and adds the staging table to it.
Note:
If you need to make changes to the staging tableâfor example, associating a column with a codelist for use as a pivot columnânavigate to the target clinical data model and make the changes, install the model, then return to the transformation.If you do not need a particular table or column in a target model that you have copied, you can mark it as Not Used. This has several effects:
They are not visible in the Listings pages, so that the Listings pages display only the tables and columns that are relevant in your study.
The system disables any validation checks and custom listings that are dependent on a table or column marked Not Used. If you later mark the table or column as Used, you must manually reenable the validation checks and custom listings.
The system does not consider the table or column when computing the status of the transformation mapping; the status can be Complete without mapping the table or column. Completeness is required for validation and installation.
Note:
The system does not include columns that are populated by TMS in the completeness calculation even if they are not marked Used.after you have mapped all the target tables you need, click the Mark as Complete icon. The system:
Displays a warning that lists all unmapped tables and columns that will be marked Not Used if you confirm that you want to continue.
Displays all downstream transformations; those that use this transformation's target model as sources.
To mark tables and columns in a downstream transformation as Not Used, select it and click the Cascade Mark as Not Used. Any table or column that is mapped to a table or column in the current transformation that is marked Not Used is marked Not Used.
Note:
Marking a target table or column as Not Used overrides any mappings to it that may exist.After you have mapped one or more source tables to a target table, you must specify how to handle every column in the target table.
If you do not need a column in the target model, select it and click Mark as Not Used. The system then does not consider the column when computing the status of the transformation mapping; the status can be Complete without mapping the column.
Column mappings are constrained by table mappings; columns can be mapped only if their tables are mapped, and they can be mapped only in ways that are consistent with the Transformation Type of their table mapping.
To map a target table's columns:
In the Target Tables pane, select the target table whose columns you want to map and click the Map Column icon. The Map Columns window opens.
Click the Automap icon (optional). The system maps as many columns as it can. You can then add and change the mappings if necessary, using the following steps.
Select one or more source columns to map to a single target column, select the target column, and click the Map icon in the target column's row. You may need to click it twice.
You can use Ctrl+Click or Shift+Click to select multiple source columns. You can also map a single source column to a target table and add another source column later.
Expression (Optional): To write an expression operating on the target column data as part of the Select clause, select the target column and click the icon in the Expression tab below. The Expression Builder opens; see "Using the Expression Builder for Transformations and Blinding Criteria".
Set Preferred Path: If you create a Many-to-1 column mapping, you must select one of the source columns as the Preferred Path in the Mapped Sources tab. If a user creates a discrepancy against a data point in the target column, the system displays the discrepancy against the source value in the Preferred Path column and not the other source columns. When the discrepancy is sent back to the data point's source system, it is associated with this data point.
In a 1-to-1 mapping, the system sets the Preferred flag of the single source column to Yes when you save the mapping.
Continue until all source and target tables and columns complete. The system displays the check icon for the target table when its mapping is complete, meaning that all columns are either mapped or marked Not Used.
Save. You can save your work at any point but must save when you have finished and all mappings are complete.
Install using the Install Map button. The system generates a PL/SQL transformation program using the mappings, checks it in, and generates the package in the database. It also tries to install the source and target models if they are not already installed.
When you run the transformation program it copies data from the source tables to the target tables. To run the program, go to the Transformations tab in the Home page.
You can undo existing mappings all at once or one at a time.
You can undo multiple mappings at three levels:
Model: To unmap all table and column mappings in a target model, click the Unmap All icon at the top of the Transformations page.
Table: To unmap all table and column mappings for selected tables, click the Unmap icon in the Target Tables pane.
Columns: To unmap all column mappings for a single table, but not the table mapping, click the Unmap icon in the Target Columns pane.
You must confirm before the unmapping proceeds.
To undo a table or column mapping:
Select the target table or column in the Target Table or Target Columns pane. The system displays the source tables or columns mapped to it in the Mapped Sources tab below.
In the Mapped Sources tab, select the source table or column whose mapping you want to undo.
Click the Delete icon in the Mapped Sources tab.
As you work on table and column mappings, you can use the View drop-down to display columns in the Source Tables or Columns pane with blinding-related information: Blinding Criteria, Blinding Status, Blinding Type, and Blinded Table.
After you have completed all the mappings, you can cascade source blinding settings to target tables.
In the Table Mapping pane, click the Cascade Blinding icon. The Cascade Blinded Tables window opens. It displays all blinded source tables and the target tables to which they are mapped, with a description of the type of blinding defined for the source table and the effect on the target table if you do cascade blinding:
If a source table has table-level blinding, the target table will also be blinded at the table level.
If a source table has column-level blinding, the target table will also have column-level blinding on the same columns.
If a source table has row-level blinding, you must enter blinding criteria for the target table. No blinding is cascaded.
You can expand the node for any source or target table to see blinding details for its columns. For target tables with column-level blinding, you can select or deselect individual columns for cascade blinding.
To accept the default blinding for a target table, select it and click Accept.
To accept the default blinding for all target tables, select Select All and click Accept.
Masking substitutes a dummy value for real, blinded, data.
In the Column Mapping pane, click the Cascade Masking icon. The Cascade Blinded Columns window opens. It displays all blinded source columns and the target columns to which they are mapped, with a description of the type of blinding defined for the source column and the effect on the target column if you do cascade blinding:
If a source column has column-level masking, the target column will, too.
If a source column has cell-level blinding, the target column will have column-level masking until you specify masking criteria.
To accept the default masking for a target column, select it and click Accept.
To accept the default masking for all target columns, select Select All and click Accept.
The system autogenerates relations between source and target tables based on the following operations (except Custom, which requires you to write your own transformation program):
For more information on joins, unions, pivots, and unpivots, see Oracle® Database SQL Language Reference 11g Release 2 (11.2).
One or more source tables feed data to a single target table. This is the default value. Column maps in a direct table relation may have a 1-to-1 or Many-to-1 relation.
To create a Direct transformation:
Select the source and target tables, then select a Transformation Type of Direct.
Click the icon in the Map Column column. The system displays the source and target columns.
Select each target column in turn and do one of the following:
Select the source columns that will feed data to it and click the Map icon.
Click the Mark as Not Used icon.
Save.
Two or more source tables feed data to a single target table in a join relationship with a join condition. Column maps in a join relation may have a 1-to-1 or Many-to-1 relation.
To define a Join transformation:
Select the source tables and target table and click the Map icon, then select a Transformation Type of Join.
Click the Join icon that appears in the Transformation Type column. The Define Joins window opens.
Click the Add icon in the Define Joins window. The system populates the Table drop-down lists with the mapped tables.
Select Table 1 (left) and Table 2 (right, also known as the foreign key table) to be joined.
Specify if it is to be an outer join on either the left or right side. Leave the check box unselected to create an inner join.
An inner join (sometimes called a simple join) returns only those rows that satisfy the join condition.
An outer join extends the result of a simple join. An outer join returns all rows that satisfy the join condition and also returns some or all of those rows from one table for which no rows from the other satisfy the join condition:
A left outer join returns returns all rows from Table 1 and only rows meeting the join condition from Table 2. Rows in Table 1 that do not have a corresponding row in Table 2 have null values in the columns from Table 2.
A right outer join returns returns all rows from Table 2 and only rows meeting the join condition from Table 1. Rows in Table 2 that do not have a corresponding row in Table 1 have null values in the columns from Table 1.
A full outer join returns all rows from both or all tables. Rows in either table that do not have a corresponding row in the other table have null values in the columns from the other table.
If you are joining more than two tables, click the join Add icon again and define the next join. Also follow the next steps for each pair of tables.
Click the Add icon in the Join Details pane. The system populates the Table lists with the columns in each joined table.
Create the join condition for the Where clause by selecting a column from each table and the operator required. For example, where both tables have a column called USUBJID, select those columns and select an operator of equals (=).
To specify additional Join conditions on other columns, click the Add icon in the Join Details pane again as many times as required.
Click OK. The system displays the join in the Joins tab below.
Click the icon in the Map Column column. The system displays the source and target columns.
Select each target column in turn and do one of the following: a
Select one or more source columns and click Map.
Click the Mark as Not Used icon.
Save.
Two or more entire tables feed data to a single target table that is a superset of all columns in the sources. The assumption is that the source tables are logically related with at least some overlapping content, such as two versions of a Vital Signs form or two lab vendors providing results.
To create a Union transformation:
Select the source and target tables and click the Map icon, then select a Transformation Type of Union.
Click the icon in the Map Column column. The system displays the source and target columns.
Select each target column in turn and do one of the following:
Select the source columns and click Map. See Data Lineage Tracing.
Note:
In a union, if only one source column is mapped to a target column, the system adds a null in the code for the other table(s). For example:insert into tgt_table1 (col1, col2, col3) select col1, col2, col3 from table1 union all select col1, col2, null from table2;
Click the Mark as Not Used icon.
Save.
Data Lineage Tracing In a union, the Preferred Path drop-down in the Mapped Sources pane is disabled. The system defines the preferred path:
If the column mapping is 1-to-1; where each row in the target is populated by a single row in one of the source tables, the system selects the corresponding row in the appropriate source as the preferred path.
If the mapping is Many-to-1, the system randomly selects one of the source columns as the preferred path. If you want to select the preferred path yourself, use a staging table to perform the union (creating a 1-to-1 column mapping) and then write the expression on the columns in the staging table to the end-target table.
A pivot converts a source table with a vertical (tall, skinny) structure, such as lab data or ODM, into a target table that represents the same data in a more horizontal (short, fat) structureâwith more columns and fewer rows; see Pivot Example.
To create a Pivot transformation:
Select the source and target tables and click the Map icon, then select a Transformation Type of Pivot.
Click the Pivot icon that appears in the Transformation Type column. The Pivot/Unpivot window appears.
Query for and select the pivot column from the source table columns. The column must be associated with a code list that specifies the allowed values in the column. For example, the column Test may have a code list of the lab test names collected in a particular visit.
Click OK.
Click the Map Column icon. The system displays the source and target columns.
In the View drop-down, select Columns and then select Filter Value if it is not already checked.
Scroll over to the Filter Value column. For each pivoted column in the target table, select the pivot column value to identify the row in the source table from which to get the value for the target column. The list is populated by the code list you specified.
For the nonpivoted columns you normally create a direct 1-to-1 map but Many-to-1 maps with expressions are also allowed.
Save.
Pivot Example Lab results are shipped one per row, but the review data model requires one row containing all lab results for each patient at the same visit.
Table 5-1 Source Table in Pivot Example (Tall, Skinny Table)
| SubjID | Date | Visit | Test | Unit | Value |
|---|---|---|---|---|---|
|
972 |
03262112 |
5 |
IG |
mh/dl |
853 |
|
972 |
03262112 |
5 |
Lith |
null |
neg |
|
972 |
03262112 |
5 |
PTH |
pg/mL |
285 |
|
989 |
03312112 |
3 |
IG |
mh/dl |
824 |
|
989 |
03312112 |
3 |
Lith |
null |
pos |
|
989 |
03312112 |
3 |
PTH |
pg/mL |
290 |
The Test column, which contains the lab test name in the source table, is the pivot column. It is associated with a code list whose values are IG, Lith, and PTH. The source columns Unit and Value are also pivoted. The columns SubjID, Date, and Visit are not pivoted.
An unpivot converts a source table with a horizontal (short, fat) structure, into a target table that represents the same data in a more vertical (tall, skinny) structureâwith more rows and fewer columns; for use with tables where multiple columns collect the same data, such as the same assessment repeated in each section of a CRF; see Unpivot Example.
To create an Unpivot transformation:
Select the source and target tables and click the Map icon, then select a Transformation Type of Unpivot.
Click the Unpivot icon in the Transformation Type column. The Pivot/Unpivot window appears.
Query for and select the pivot column from the target table columns. The column must be associated with a code list that specifies the allowed values in the column. For example, the column Section may have a code list with values 0hr, 1hr, and 2hrs.
Click OK.
Click the icon in the Map Column column. The system displays the source and target columns.
For each pivoted column, select the target column and all the source columns that will feed data to it, and click Map.
For the nonpivoted columns you normally create a direct 1-to-1 map but Many-to-1 maps with expressions are also allowed.
In the Mapped Sources tab, Filter Value field, for each pivoted column in the source table, select the pivot column value to identify the row in the target table into which to put the source column value. The list is populated by the code list you specified.
Save.
Unpivot Example Multiple observations are collected in an InForm CRF using sections rather than itemsets. A flat form is created with three sections, one section for each time point in that visit for blood draws. In InForm this is one CRF instance and one record but the standard review data model in use requires that these be three separate records.
Certain metadata valuesâthe section name in this caseâshould be inserted as data in the corresponding row for that section.
Certain values in the flat sectionâthe subject ID, visit, and dateâshould repeat on each row. These are the nonpivoted columns and the source column must be mapped to the target column.
The Section (Sect) column in the source table is the pivot column. It is associated with a code list containingthe values 0hr, 1hr, and 2hr.
Multiple columns in the source tableâfor example Sect1_Test, Sect2_Test, and Sect3_Test, map to a single column in the target table: Test.
Table 5-3 Source Table Columns in Unpivot Example (Short, Fat Table)
| SubjID | Date | Visit | Sect | Sect1_Test | Sect1_Unit | Sect1_Value | Sect | Sect2_Test | Sect2_Unit | Sect2_ Value | Sect | Sect3_Test | Sect3_Unit | Sect3_Value |
|---|---|---|---|---|---|---|---|---|---|---|---|---|---|---|
|
509 |
01082112 |
1 |
0hr |
Hb |
gl |
8 |
1hr |
Hb |
gl |
8 |
2hr |
Hb |
gl |
9 |
|
598 |
02092112 |
1 |
0hr |
Hb |
gl |
8 |
1hr |
Hb |
gl |
9 |
2hr |
Hb |
gl |
10 |
|
613 |
02112112 |
1 |
0hr |
Hb |
gl |
9 |
1hr |
Hb |
gl |
10 |
2hr |
Hb |
gl |
10 |
The system generates a row in the target table for each value in the code list per set of nonpivoted values (SubjID, Date, and Visit) and populates the Section column in the target table with the code list values as shown in Table 5-4, "Target Table Columns in Unpivot Example (Tall, Skinny Table)".
Table 5-4 Target Table Columns in Unpivot Example (Tall, Skinny Table)
| SubjID | Date | Visit | Section | Test | Unit | Value |
|---|---|---|---|---|---|---|
|
509 |
01082112 |
1 |
0hr |
Hb |
gl |
8 |
|
509 |
01082112 |
1 |
1hr |
Hb |
gl |
8 |
|
509 |
01082112 |
1 |
2hr |
Hb |
gl |
9 |
|
598 |
02092112 |
1 |
0hr |
Hb |
gl |
8 |
|
598 |
02092112 |
1 |
1hr |
Hb |
gl |
9 |
|
598 |
02092112 |
1 |
2hr |
Hb |
gl |
9 |
|
613 |
02112112 |
1 |
0hr |
Hb |
gl |
9 |
|
613 |
02112112 |
1 |
1hr |
Hb |
gl |
10 |
|
613 |
02112112 |
1 |
2hr |
Hb |
gl |
10 |
Select a Transformation Type of Custom only if you need a custom program AND it performs operations on data in such a way that it is not possible to track all data points in the source model that contributed to each data point in the target model; see "Creating a Custom Program" for more information.
Otherwise, even if you use a custom program, select the type of transformation it actually performs: join, union, pivot, or unpivot. The system then generates the code required for data lineage tracing.
You build an expression gradually, clicking Add after defining each part. The system then generates corresponding code and displays it in the Expression Text pane.
In the Expression Criteria pane, select the following as needed to build the expression from left to right.
Add Group to add the parentheses () that surround a string in an expression or group smaller units of logic.
Add Item to add a unit of logic smaller than a group.
When you add an item, in the Expression Item pane select either Column, Function, or Standard Function.
To create an expression using columns:
For Item Type, select Column.
Click the Select Column icon. The Select Column window appears, displaying all available columns. You can query (see "Querying By Example") above any of the attribute columns to find the table column you want. Select a column, then click OK.
If needed, select an operator from the list.
If needed, enter a constant value. The system encloses the value you enter in single quotes.
If needed, select a conjunction from the list.
Click Add. The system generates and displays the SQL expression in the Expression Text pane. You can edit it there.
Click Validate to check the generated code.
Define additional groups and items to complete the expression as necessary.
To reference a function in your library:
For Item Type, select Function. The Select Function window appears, displaying a list of packages created for this purpose; see "Developing a Library of SQL Functions".
Select the package that contains the function you need.
Select the function and click OK.
To use a SQL function:
For Item Type, select Standard Function.
Click the Select Standard Function icon. A search window appears. To filter, enter all or part of the name in the field above. You can use the wildcard %.
Select a function and click OK.
To make a correction:
Select the faulty item in the Expression Criteria pane. An Update button appears in the Expression Item pane.
Make your changes in the Expression Item pane and click Update.
For more information about expressions, see:
Also see the Oracle® Database SQL Language Reference 11g Release 2 (11.2).
If you need to perform a more complex operation on the source dataâfor example using a lookup table or populating staging tablesâsee "Creating a Custom Program".
Use curly brackets ("{" and "}") as delimiters and the format (table.column) to indicate input parameter values to SQL functions or custom functions in the expression. The default input is the column value if no metadata is specified after the column name.
For example, to calculate a subject's age from his date of birth:
round((sysdate - {Review.LAB_SRC.dob})/365)
where Review is the data model name, LAB_SRC is the table name, and dob is the column name. No metadata follows the column name, so by default the system passes the Date of Birth (dob) data value to the expression.
To pass metadata, add the metadata type after the fully qualified column name. To pass code list-related data or metadata, enter a dollar sign ($) after the column name and then the code list name. The default input is the code list value if no metadata is specified.
util_pkg.SIConversion4Height ({InForm.RD_VITALS.Height},
{InForm.RD_VITALS.Height.DataType}, {InForm.RD_VITALS.Height$U},
{InForm.RD_VITALS.Height$U.CodeListID})
where, on the second line, InForm is the data model name, RD_VITALS is the table name, Height is the column name and DataType is the metadata.
This expression passes four parameter values into the SIConversion4Height function so that it can convert the subject's height to a different unit if the unit used is the wrong one for the target data model: the data value for a subject's height, the data type of the Height column, the unit in which the height was collected, and the code list ID associated with the column that provides the allowed units for Heightâfor example, inches and centimeters.
You can hard-code a value for a target column using an expression that contains only a constant value or by calling a SQL function based on constants, for example:
round(3.14 * power(10, 2))
You can develop a library of standard PL/SQL functions, including conversions and derivations, and call them in an expression. Custom functions are always static references and can reference lookup tables.
You must define each function in Oracle Life Science Data Hub as an Oracle LSH program; see "Creating a Custom Program".
Each static reference program must:
Be created in an Oracle LSH application area in the DMW_UTILS domain, and installed in a Work Area with a Usage Intent of Production.
Have a validation status of Production.
Have its source code marked as Shareable in Oracle LSH.
The system does not display error messages as you create each mapping, allowing you to work more quickly. You can run the Validate Map job at any time:
To validate all mappings in the model, click the Validate Mappings icon at the model transformation level.
To validate mappings for selected tables, select one or more target tables and click the Validate Mappings icon at the table level.
To see the error messages for a target table or its columns, hover over the table or column's mapping status icon.
The error messages you may see are, in alphabetical order:
DME_XFMVAL_AUTH_YES_ERR: One or more source tables is blinded and the target table is not blinded. You must either set the target table's Authorize flag to Yes if you know that it will not contain any of the sensitive, blinded data from the source tables, or go back to the clinical data model and set the target table's blinding attributes appropriately. Special privileges are required for either action.
DME_XFMVAL_COL_DATATYPE_ERR: The data type of the source and target columns must be the same.
DME_XFMVAL_COL_LEN_TRUNC_ERR: To prevent data loss, the target column must have a length equal to or greater than the source columns.
DME_XFMVAL_COL_NOSRC_ERR: Mapping required. Add one or more source columns or specify a constant value or mark as Not Used.
DME_XFMVAL_COL_NOTRGT_ERR: Each column mapping must have one target column.
DME_XFMVAL_COL_SRC_TRGT_SAME: A column cannot be mapped to itself.
DME_XFMVAL_ERROR_NOT_FOUND: All mappings are valid.
DME_XFMVAL_MOD_CYLIC_TAB_ERR: This model has circular table mappings.
DME_XFMVAL_MOD_SRC_NOTFOUND: A model mapping must have at least one source model.
DME_XFMVAL_MOD_SRC_TRGT_SAME : A model cannot be mapped to itself.
DME_XFMVAL_MOD_TAB_INVALID: A model mapping must have valid table mappings.
DME_XFMVAL_MOD_TAB_NOTFOUND: A model mapping must have at least one table mapping.
DME_XFMVAL_MOD_TRGT_NOT_ONE: A model mapping must have one target model.
DME_XFMVAL_NOTNULLCOL_HARDCOD: Not null columns in the target table must be mapped to either a source column or a constant value.
DME_XFMVAL_NOTNULLCOL_NOMAPERR: Mapping required. Not null columns in the target table cannot be left unmapped.
DME_XFMVAL_PRMCOLS_HARDCOD: All primary key columns in the target table cannot be mapped to a constant value.
DME_XFMVAL_PRMCOLS_UNMAPPED: Mapping Required. All primary key columns in the target table are unmapped.
DME_XFMVAL_PRMCOL_HARDCOD_ERR: Primary key column in the target table cannot be mapped both to source column or to a constant value simultaneously.
DME_XFMVAL_PRMCOL_MAP_ERR: Primary key column in the target table must be either mapped to source column or to a constant value.
DME_XFMVAL_PRMCOL_NOMAPERR: Mapping Required. Primary key column in the target table cannot be left unmapped.
DME_XFMVAL_TAB_DIR_MULTSRC_ER: Table mappings of type Direct can have only one source table.
DME_XFMVAL_TAB_JOIN_ONESRC_ERR: Table mappings of type Join must have at least two source tables.
DME_XFMVAL_TAB_NOCOLMAP_ERR: Table mappings must have at least one column mapping.
DME_XFMVAL_TAB_NOSRC_ERR: Each table mapping must have at least one source table.
DME_XFMVAL_TAB_NOTRGT_ERR: Each table mapping must have one target table.
DME_XFMVAL_TAB_SRC_TRGT_SAME: A table cannot be mapped to itself.
DME_XFMVAL_TAB_UNION_ONESRC_ER: Table mappings of type Union must have at least two source tables.
DME_XFMVAL_XFORM_TYPE_ERR : Incorrect Table Map Type. It can be Direct, Join, Union, Pivot or Unpivot.
After you have completed mapping, install the transformation using the Install Map button. The system:
Uses the mappings, joins and other transformation types, and expressions to generate a PL/SQL program and its packages in the database.
Links the transformation program to the source and target models and installs the models if they are not already installed.
Generates the auxiliary target table columns and logic required to maintain the source system context and data lineage tracing for each record; see "How the System Tracks Data Lineage".
The transformation must be Installable to be installed. It is not Installable if:
Its status is Incomplete; this indicates that at least one table or column in the target model is neither mapped nor marked Not Used.
One or more source or target tables are not Installable.
If it has a custom program, the program is not Installable, which may be due to not having source code or table descriptors.
One or more expressions has invalid code.
To see the log file:
Navigate to the Home page, Transformations tab.
Find the job by querying for the target model name in the Target column, and the date and time in the Submit Date/Time column.
Click the Install Job Log icon. The system displays the log file.
After you have completed all mappings and any required derivations, saved, and installed the transformation, you can run the generated program in the Transformations tab of the Home page to actually read data from one data model and write to the next.; see "Viewing and Running Transformations".
To modify a transformation you must first check it out at the model level. While you have it checked out, noone else can modify any part of it. When you have finished your work, you must check it in and install it for the changes to take effect.
Each time you check out a mapping, the system creates a new version of it at a Lifecycle stage of Development.
After checking out a transformation you can choose to Uncheck it. The system then deletes the new version with your changes.
When either a source or target model referenced by a transformation is versioned and the later version is checked in, you can upgrade the mapping to synchronize it with the model changes. The system sets Upgrade Required to Yes and activates the Upgrade Map button. Click it to perform the upgrade.
Notes:
Source models are not required to be installed to be used in the upgrade. They must be checked in.
On the target side, the upgrade is to the latest checked-out version of the target modelâthe one the system has locked for the user to work on.
Side transformations are also upgraded.
If the transformation to any target column or table is too complex for the user interface, you can create a custom program that must take care of all column mappings for the target tableâfor example:
To refer to a lookup table outside the data model with shared code lists, lab reference ranges, or SI conversion factors.
To perform data aggregation, case statements, or complex calculations.
To call an API to set a flag on records that meet specified criteria; see the Oracle Health Sciences Life Sciences Warehouse Application Programming Interface Guide for information on APIs for Oracle LSH and Oracle DMW, and see "Sample Program that Calls the API to Set a Flag".
You need to use 1-to-many or many-to-many column mappings.
You can write a PL/SQL, SAS, or Informatica program in an interactive editor and upload it and define a program object in Oracle Life Sciences Data Hub (Oracle LSH). You can reuse custom programs.
Note:
To create and use a SAS or Informatica program, you must purchase SAS or Informatica separately and integrate it with Oracle LSH. See the Oracle Life Sciences Data Hub Installation Guide and the Oracle Life Sciences Data Hub System Administrator's Guide for instructions.Creating a custom program requires:
This section also contains:
If possible, enable data lineage tracing so that the system can display discrepancies in models before and after the one where they were created, and display information about contributing data points upstream and resulting data points downstream from each data point.
Note:
If your custom program performs operations on data in such a way that it will not be possible to track all data points in the source model that contributed to each data point in the target modelâfor example, aggregationsâthere is no need to follow these instructions. Data lineage tracing will not work. Users will be able to create discrepancies in both the source and target model, but the system will only be able to display these discrepancies in the model in which they were created.If you are performing a pivot or unpivot in a custom program, the source columns' surrogate key values must be modified before writing to the auxiliary column in the target table or data lineage tracing will not work. However, you can create an intermediate model containing a table and create a pivot or unpivot transformation to it in the user interface, then create a custom program from the intermediate table to the target table.
When you create a custom program for a transformation you must add one auxiliary column to the target table to store the surrogate key for each source table record. The system uses these columns to support data lineage tracing; see "How the System Tracks Data Lineage".
To add auxiliary columns:
In the Study Configuration page, navigate to your target data model and check it out.
Select the target table and click the Add icon in the Columns pane. Add one column for each source table that will feed data into it in the transformation. These columns must be of data type varchar2 and length 4000. There is no required naming convention for these columns, but see "Naming Objects".
Save and check in the data model.
Note:
If you start to map to the target table in the user interface before creating the auxiliary columns, you will not see the columns in the user interface. If you then add the columns and go back to the transformation, you must check in the transformation and check it out again in order to have a new version that can "see" the columns.However, you can write the custom program in Oracle LSH before or after creating the tranformation.
Your program code must populate one auxiliary column with the value of the CDR$SKEY column in each source table. See "Sample Programs that Populate Auxiliary Columns with the Source Surrogate Key" for example SAS and PL/SQL code required to do this.
Log in to Oracle LSH, select its Applications tab if it is not already selected, and search for the Oracle DMW_UTILS domain under the Oracle DMW_DOMAIN.
In the Oracle DMW_UTILS domain, navigate down to the subdomain your company has set up for storing custom programs of this type; see "Setting Up Custom Program and Function Categories". Click the Manage Definitions icon on that row.
In the Maintain Library Domain window Create field select Program and click Go. Enter a name and description and select the Program Type: PLSQL, SAS, or Informatica. Click Apply.
In the Table Descriptors subtab, click Add Target From Library, then select Create a Table Descriptor from an existing Table definition and click the Search icon for the Definition Source field.
In the window:
In the Domain list, select Oracle DMW_DOMAIN, the appropriate category for your study, and your study.
Select Display Table Definitions Under DataModel. The system displays the Data Models field. Select the clinical data model and enter the table name if you know it, then click Go.
When the system returns the table you are searching for, click its Quick Select icon. The system returns you to the Create Table Descriptor page with the selected table displayed in the Definition Source field. Click Apply.
If you are adding a source table, click Update in the Table Descriptor page and change Is Target to No and click Apply, then click Return to return to the program page.
Repeat Steps 5-7 until you have added each source table. For transformations, you must also add the target table.
Write the program. If you have integrated SAS with Oracle LSH you can click the Launch IDE button from the program page.
Your program must handle populating all target columns, including populating the new auxiliary columns with the value of the internal CDR$SKEY (surrogate key) column in each source table.
In the Source Code subtab, click Add, then select Create a new Source Code definition and instance. Enter all required values. For a SAS program, the File Type should be Program, not Macro.
Note:
Source Code names:must not include Oracle or PL/SQL reserved words or special characters; see "Avoid Special Characters and Reserved Words".
must include a file extensionâfor example, .sas for SAS or .sql for PL/SQL.
The Oracle name must not be the same as the Oracle name of either a table descriptor or another source code in the same PL/SQL program.
Upload the file containing your program and click Apply.
If your code uses parameters, formally define them as Oracle LSH parameter objects in the Parameters subtab. However, using parameters makes sense only for functions called from an expression where you can provide input values. Oracle DMW transformation submission does not allow setting parameter values.
Note:
If you are writing an Informatica program, you must populate the WF Name parameter with the name of the Informatica workflow that you want execute. Execution fails without this value.If required, you can call Oracle LSH or Oracle DMWOracle DMW public APIs from your code; see the Oracle Health Sciences Life Sciences Warehouse Application Programming Interface Guide for a list and descriptions of the public APIs and information about how to call them.
Check in the program in Oracle LSH.
Return to Oracle DMW. If you are defining a validation check, see "Creating a Custom Validation Check". If you are defining a transformation, follow instructions in the next section.
If you have not already created auxiliary key columns in the target table, do so now; see "Enabling Data Lineage Tracing in a Custom Program".
In Oracle DMW, navigate to the transformation mapping for the target data model and table.
Select the source tables and target table.
Click the icon in the Program column and select the Oracle LSH program.
Specify the actual Transformation Type.
Note:
In most cases DO NOT select a Transformation Type of Custom. Select the actual transformation type that your code performs. The system uses the Transformation Type to ensure that data lineage tracing works correctly.Select a Transformation Type of Custom if you are performing operations that make it impossible to trace data lineage, such as aggregations. In that case, users can create discrepancies on the source or target table but the system can display these discrepancies only in the model in which they were created.
Map the source and target columns, including mapping the CDR$SKEY column in each source table to the corresponding surrogate key column you created in the target table. (The CDR$SKEY columns are normally not visible in the Column Mapping pane, but this changes when the table Transformation Type is Custom.)
Install the whole transformation.
The system creates an instance of the custom program in the study's Development lifecycle area and the corresponding database schema and maps its table descriptors to the source and target table instances. You can now run the transformation in the Activities page.
The following example SAS and PL/SLQL programs are straightforward ones that you could create in the user interface using a Transformation Type of Direct and Join, respectively. However, they show how to populate auxiliary keys in the target table with the surrogate key value from the source tables.
PROC SQL;
INSERT
INTO Target.vitals_tgt
  (
    STUDYID,
    SITEID,
    SUBJID,
    VISITNUM,
    INITIALS,
    BIRTHDT,
    HEIGHT,
    HEIGHTU,
    WEIGHT,
    WEIGHTU,
    SOURCE_KEY
  )
SELECT STUDYID,
  SITEID,
  SUBJID,
  VISITNUM,
  INITIALS,
  BIRTHDT,
  HEIGHT,
  HEIGHTU,
  WEIGHT,
  WEIGHTU,
  CDR_SKEY
FROM Source.vitals;
QUIT;
CREATE OR REPLACE PACKAGE VITALS_PKG AS
  PROCEDURE loadVitals;
END VITALS_PKG ;
/

CREATE OR REPLACE PACKAGE BODY VITALS_PKG AS
  PROCEDURE loadVitals IS
   BEGIN
     insert into vitals_tgt (
      STUDYID,
      SITEID,
      SUBJID,
      VISITNUM,
      INITIALS,
      BIRTHDT,
      HEIGHT,
      HEIGHTU,
      WEIGHT,
      WEIGHTU,
      SEX,
      RACE,
      VITALS_SKEY,
      DEMOG_SKEY
     ) select
      a.STUDYID,
      a.SITEID,
      a.SUBJID,
      a.VISITNUM,
      a.INITIALS,
      a.BIRTHDT,
      a.HEIGHT,
      a.HEIGHTU,
      a.WEIGHT,
      a.WEIGHTU,
      b.SEX,
      b.RACE,
      a.CDR$SKEY,
      b.CDR$SKEY
     from vitals a, demog b
     where a.studyid = b.studyid
     and a.subjid = b.subjid;
   END loadVitals;
END VITALS_PKG;
/
This sample program reads flags on source table data, and if the flag is 'Complete' for a row, it inserts that row into the target table, and on the target table it assigns the 'Complete' flag to all rows.
CREATE OR REPLACE PACKAGE VITALS_PKG AS
  PROCEDURE loadVitals;
END VITALS_PKG ;
/

CREATE OR REPLACE PACKAGE BODY VITALS_PKG AS
  PROCEDURE loadVitals IS
  x_return_status VARCHAR2(1);
  x_msg_count     NUMBER;
  x_msg_data      VARCHAR2(1000);
  oFlagName dme_flag_name_type;
  vFlagState varchar2(100);
  BEGIN
    -- get the flag
    dme_pub_flag_name.getFlagName(
              p_api_version => 1.0
            , p_init_msg_list => CDR_PUB_DEF_CONSTANTS.G_FALSE
            , p_commit => CDR_PUB_DEF_CONSTANTS.G_TRUE
            , p_validation_level => CDR_PUB_DEF_CONSTANTS.G_VALID_LEVEL_FULL
            , x_return_status => x_return_status
            , x_msg_count => x_msg_count
            , x_msg_data => x_msg_data
            , pi_company_id => cdr_pub_def_constants.current_company_id
            , pi_flag_namestr => 'Completeness'
            , pio_dme_flag_name => oFlagName
    );
    for row in (select
      STUDYID,
      SITEID,
      SUBJID,
      VISITNUM,
      INITIALS,
      BIRTHDT,
      HEIGHT,
      HEIGHTU,
      WEIGHT,
      WEIGHTU,
      CDR$SKEY
     from vitals
    ) loop
      dme_pub_flag_data.getFlag(
          p_api_version => 1.0
        , p_init_msg_list => CDR_PUB_DEF_CONSTANTS.G_FALSE
        , p_commit => CDR_PUB_DEF_CONSTANTS.G_TRUE
        , p_validation_level => CDR_PUB_DEF_CONSTANTS.G_VALID_LEVEL_FULL
        , x_return_status => x_return_status
        , x_msg_count => x_msg_count
        , x_msg_data => x_msg_data
        , pi_company_id => cdr_pub_def_constants.current_company_id
        , pi_tab_obj_id => cdr_pub_df_mapping.GET_TAB_INST_ID('VITALS')
        , pi_skey_value => row.cdr$skey
        , pi_flag_id => oFlagName.flag_id
        , po_flag_state => vFlagState
      );

      if vFlagState = 'Complete' then
        insert into vitals_tgt (
          STUDYID,
          SITEID,
          SUBJID,
          VISITNUM,
          INITIALS,
          BIRTHDT,
          HEIGHT,
          HEIGHTU,
          WEIGHT,
          WEIGHTU,
          SOURCE_KEY
         )
         values (row.studyid, row.siteid, row.subjid, row.visitnum, row.initials, row.birthdt, row.height, row.heightu, row.weight, row.weightu, row.cdr$skey);
      end if;
   end loop;
   for row in (select * from vitals_tgt) loop
      dme_pub_flag_data.setFlag(
          p_api_version => 1.0
        , p_init_msg_list => CDR_PUB_DEF_CONSTANTS.G_FALSE
        , p_commit => CDR_PUB_DEF_CONSTANTS.G_TRUE
        , p_validation_level => CDR_PUB_DEF_CONSTANTS.G_VALID_LEVEL_FULL
        , x_return_status => x_return_status
        , x_msg_count => x_msg_count
        , x_msg_data => x_msg_data
        , pi_company_id => cdr_pub_def_constants.current_company_id
        , pi_tab_obj_id => cdr_pub_df_mapping.GET_TAB_INST_ID('VITALS_TGT')
        , pi_skey_value => row.cdr$skey
        , pi_flag_id => oFlagName.flag_id
        , pi_flag_state => 'Complete'
      );
   end loop;
  END loadVitals;
END VITALS_PKG;
/
The system tracks each data point in each target clinical data model back to the raw source dataâone or more data points in one or more input models that contributed to it, and all models in betweenâand to all data points it contributes to in downstream models.
Maintaining this context, or data lineage, is required in order to pass discrepancies back and forth between the system and its source data systems, InForm and labs, and to recognize a discrepancy as the same discrepancy in all sequential models.
You can see a data point's source and target data lineage in the Listings page.
The system uses several mechanisms to maintain context:
Mappings: The system stores the table and column mappings you define as part of a transformation. The system also generates record-level mappings during transformation execution.
Surrogate Keys: The surrogate key value for each record is a concatenation of the table instance identifier followed by the values in the primary key columns in the order specified in the primary key constraint, separated by tildes (~). For example, table ID~subject~ visit~ crf~test.
Generated Columns to Store Surrogate Key Values: When a transformation program is installed it adds one auxiliary column to each target table for each source table that writes to the target, to store the surrogate key of source records.
These mechanisms provide enough metadata to trace back a transformed data point to its contributing source data points, even through multiple transformations.
In this example, multiple data points in three data models contribute to the calculation of each subject's Body Mass Index (BMI).
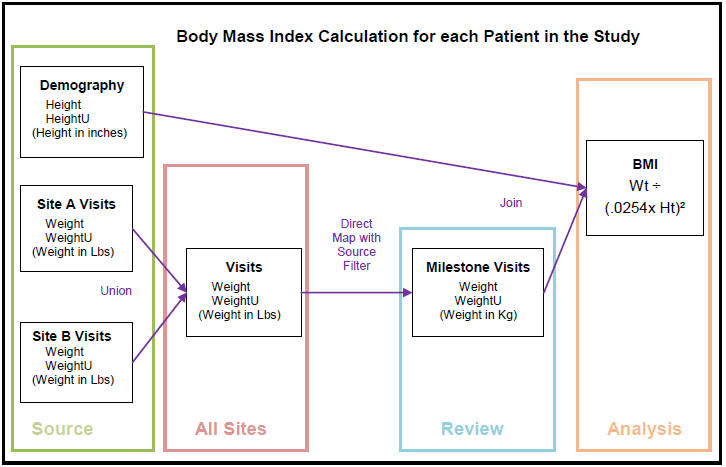
The clinical data model called Source is an input model with raw data from InForm including the following tables:
Table Demography includes the columns Height and Height Unit and has data for all subjects.
Table Site A Visits includes the columns Weight and Weight Units and has data for subjects at Site A.
Table Site B Visits includes the columns Weight and Weight Units and has data for subjects at Site B.
Model All Sites has a table called Visits that is a union of Source tables Site A Visits and Site B Visits. It stores the Weight and Weight Unit for all subjects at both sites.
Model Review has a table called Milestone Visits created as a direct map with a source filter that copies only data for the milestone visits 1, 4, 7, and 10. The table has Weight and Weight Unit for all subjects at both sites, now all converted to kilograms.
The model Analysis has a table called BMI whose BMI column value is the computation for Body Mass Index using the height from Demography and weight from Milestone Visits.
| Study | Subject | Visit | Site | Gender | Age | BMI | BMIU |
|---|---|---|---|---|---|---|---|
|
BMI |
1001 |
4 |
MGH |
FEMALE |
34 |
22.7 |
KG/M**2 |
|
BMI |
1002 |
4 |
MGH |
FEMALE |
24 |
24.5 |
KG/M**2 |
|
BMI |
1003 |
4 |
MGH |
MALE |
42 |
21.9 |
KG/M**2 |
|
BMI |
1004 |
4 |
MGH |
FEMALE |
28 |
26.3 |
KG/M**2 |
|
BMI |
1005 |
4 |
McLean |
MALE |
29 |
24.6 |
KG/M**2 |
|
BMI |
1006 |
4 |
McLean |
MALE |
54 |
28.8 |
KG/M**2 |
|
BMI |
1007 |
4 |
McLean |
FEMALE |
42 |
33.1 |
KG/M**2 |
A BMI value over 30 is outside the normal range. The reviewer would like to investigate the source data for Subject 1007, a female aged 42 with a BMI of 33.1. In the Default Listings page, the reviewer selects the BMI data value 33.1 for Subject 1007 and selects View Source Data, then Trace Data Lineage.
The Trace Data Lineage window appears, displaying the selected data point in the top row. In the following rows, at the first level of indentation, are the four data points from two tables that feed data directly into the BMI calculation. Source data points that are not from input modelsâin this case, both a Weight value of 82.1 and a WeightU value of KG âhave a node you can expand to see the upstream data points feeding data into them. Source data points from an input lab or InForm modelâin this case, a Height value of 62 and a HeightU value of INâhave no node to expand because they are the ultimate source within Oracle DMW.
Columns are displayed in the format data_model.table.column.
The user can also choose to see downstream data.
If data has been masked to prevent divulging which subjects are receiving the study drug, a dollar sign ($) is displayed in the unlabeled column immediately after the column name in the relevant row or rows.
Note:
The system cannot always display the entire lineage. There may be a problem with the data: it may be deleted, unmapped, or blinded; or you may not have the privileges required to view the data. The system displays an asterisk (*) when this is the case.
|
Copyright © 2013, 2015, Oracle and/or its affiliates. All rights reserved. Legal Notices |
|