5 Using the Environment Dashboard
The Environment Dashboard shows key information for the selected environment.
About the Environment Dashboard
The Environment Dashboard shows key performance indicators for the environment you have selected.
The Environment Dashboard Overview, visible by default, shows the availability of the environment in production, performance and trending for critical business transactions, and historical storage usage. The Recommendations option shows recommendations that have been implemented for this environment and those that have been rejected. It also indicates why pending recommendations are necessary and the possible consequences if they are not implemented.
If BTM has been set up, the Transactions option is displayed. You can see the average transaction performance over the last 24 hours, and compare this performance to the 30 day average and to the lower threshold value. You can also compare this value with the transaction performance 7 days ago. You can also view service requests (SRs) reports under Incidents and requests for change (RFCs) reports under Changes.
Note:
As SRs are often logged without reference to the environment, these customer level reports provide the most complete picture of SRs for your organization.Associating all SRs logged for your organization with the correct environment will result in more complete SR reports at environment levels.
About the Environment Overview
Viewing Environment Recommendations
About the Environment Overview
View any of these widgets on the Environment Dashboard Overview:
Where the chart is larger than the widget, scroll up within the widget to see the full contents. Double tap any of the widgets to expand to full screen mode. Tap the chart icon in the bottom right corner of the widget to open the data view in expanded mode.
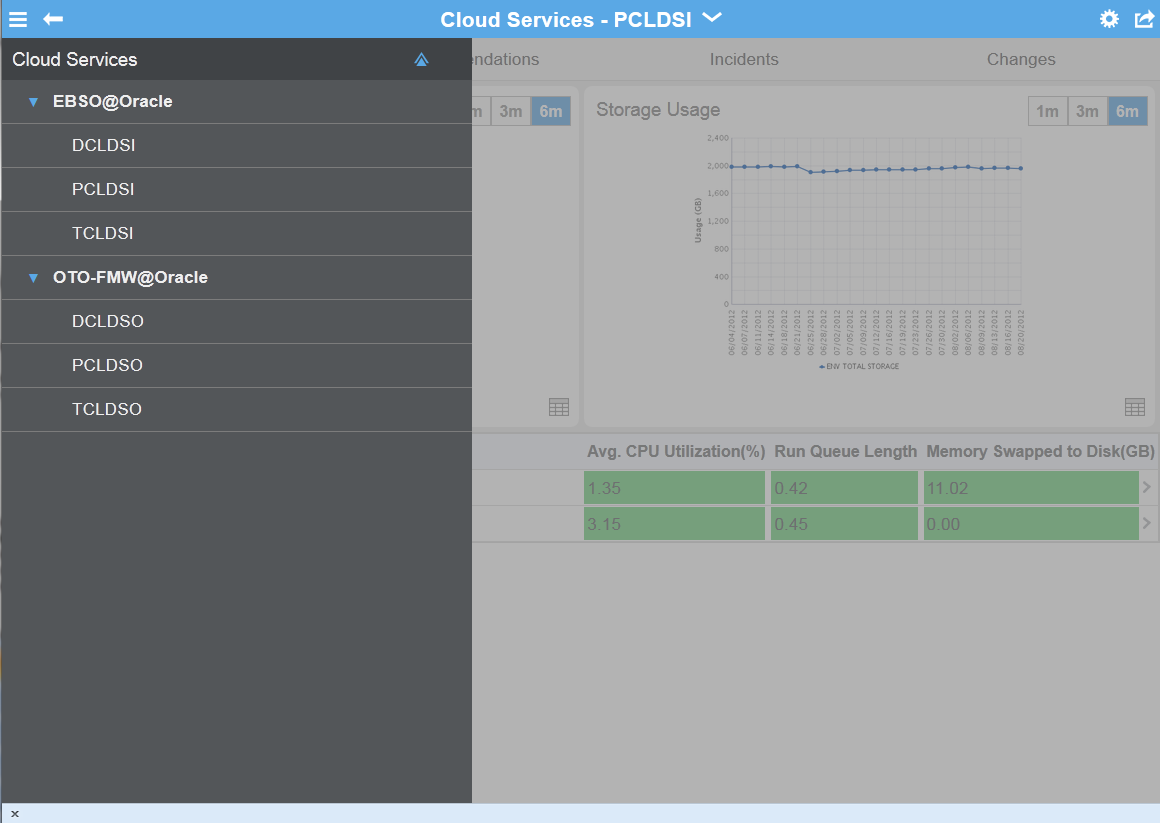
View individual records for all environments at the bottom of the screen. Each environment record shows the host tier, average CPU usage, as a percentage of total CPU usage, run queue length, and memory swapped to disk in Gb. Tap More to open the Service Dashboard for that service.
This widget shows the availability of this environment and its underlying infrastructure over the selected time interval. Toggle between the chart view and the data view using the symbol in the bottom right corner.
Availability is measured over complete months, which is reflected in the time intervals for all availability chart and data views. For example, if you select a time interval of 6 months on Monday May 6th, 2014, the Production Availability by Environment chart and data views display availability for six complete months: November, December, January, February, March, and April, as well as the availability to May 1st to 5th, 2014.
Chart View: The chart view shows both overall availability and infrastructure availability for this environment over selected the time interval. Availability is displayed as a continuous horizontal green bar, where:
-
Overall availability reflects the percentage of time that the environment was operating as expected.
-
Infrastructure availability shows the percentage of time that the underlying facility, network, and hardware components in the environment were operating as expected.
Unplanned complete outages - that is, any unscheduled intervals when the service was completely unavailable and Oracle was responsible for restoring service - are displayed as red bars.
To be classified as complete unplanned infrastructure outage, the root cause must be identified in the security, network, OS, or hardware category. Planned outages, such as for routine maintenance, and service interruptions, where the environment was partially available, are not included in availability calculations.
Data View: The data view provides availability statistics for this environment:
| Field | Description |
|---|---|
| Total Unplanned Outage Time | Total unplanned outage time (to the nearest hour and minute) for this environment, when the service or infrastructure was completely unavailable and Oracle was responsible for service restoration. |
| Customer Outage | Total unplanned outage time (to the nearest hour and minute) for this environment, when the service or infrastructure was completely unavailable and when your organization was responsible for service restoration. |
| Oracle Outage | Total unplanned outage time (to the nearest hour and minute) for this environment, when the service or infrastructure was completely unavailable and Oracle was responsible for service restoration. |
| Total Unplanned Outage Count | Number of times unplanned outages occurred in this environment, when the service or infrastructure was completely unavailable and Oracle was responsible for service restoration. |
| Average Time to Restore for Each Unplanned Outage | Average time, to the nearest hour and minute, to restore the environment following an outage. |
| Total Infrastructure Outage Time | Total unplanned outage time (to the nearest hour and minute) for this environment, when the infrastructure was completely unavailable owing to a facility, network, or hardware cause and when Oracle was responsible for service restoration. |
| Total Infrastructure Outage Count | Number of times unplanned infrastructure outages occurred in this environment, when the infrastructure was completely unavailable and Oracle was responsible for service restoration. |
This widget shows records of all monitored transactions for the selected environment. Tap the Transactions option on the navigation bar to see the full transactions table for this environment.
Transaction response times give a sense of the performance of your services and environments and can indicate potential or actual issues. Your Oracle Service Delivery Manager (SDM) can work with you to identify these transactions and set up monitoring.
Note:
Where Business Transaction Monitoring (BTM) has been implemented, the Environment Transactions widget displays populated transactions reports.If BTM has not been implemented, the Transactions option and widget are hidden.
You cannot flip the Environment Transactions widget.
One or more systems measure the response time of each monitored transaction. You can view the last time data was collected from the system and compare the current value with the 30 day average.
Each transaction record shows:
| Field | Description |
|---|---|
| Transaction Name | Name of the transaction being monitored |
| Collection Point | Hostname of the system from which data is collected as part of monitoring |
| Last Collection | Time of the last data collection from the collection point(s) |
| 30 Day Average | Average transaction time over the last 30 days |
This widget shows the total storage used by this environment over the selected time interval.
Chart View: The chart view plots storage usage for this environment, compared with current entitlement and overall service storage.
Data View: The data view shows a breakdown by environment, category, and subcategory of storage usage over the selected time interval.
About the Environment Dashboard
Viewing Environment Recommendations
Viewing Environment Recommendations
The Recommendations option on the navigation bar tracks recommendations for this environment.
Recommendations are actions that you can choose to take to improve performance, security, or other aspects of a environment. Drawn directly from a Managed Cloud Services repository of optimal configurations, recommendations are generated as part of periodic maintenance on environments.
You can filter the recommendations listed by type. Types of recommendations include:
-
Current - These recommendations have been approved by a planner and presented to you in an RFC. If approved, the RFC will be applied to the named environment.
-
Implemented - These recommendations have been applied to the named environment.
-
Rejected - These recommendations have been presented in RFCs but have been rejected and therefore were not applied to the named environment.
The following information is displayed for each recommendation:
| Column Name | Description |
|---|---|
| Recommended On | The date on which the recommendation was presented to you. |
| Category | One of the following recommendation category:
|
| Environment | The named environment to which this recommendation applies |
| RFC | The request for change (RFC) related to this recommendation, if any. |
| Column Name | Description |
About the Environment Dashboard
About the Environment Overview
Viewing Environment Transactions
Tap the Transactions option on the navigation bar to see the full transactions table for the selected environment.
Transaction response times give a sense of the performance of your services and environments and can indicate potential or actual issues. Your Oracle Service Delivery Manager (SDM) can work with you to identify these transactions and set up monitoring.
You can also review the historical performance of any transaction using the transaction record.
In both chart and data views, select the date from which transaction performance will be measured using the date picker. (This date must be at least 24 hours earlier than the current date.) Then select one of the following time intervals:
-
24 hours: Shows the average of all data collections over 24 hours from the date selected, compared to the historical median and lower threshold of acceptable performance.
-
7 days: Shows the average of all hourly collections over 7 days from the date selected, compared to the historical median and lower threshold of acceptable performance.
-
30 days: Shows the average of all daily collections over 30 days from the date selected, compared to the historical median and lower threshold of acceptable performance.
The chart and data views are populated with data for the time interval from the date selected.
Chart View: The chart view shows the average of all data collections over the time interval from the date selected, compared to the historical median and lower threshold of acceptable performance.
Data View: The data view lists the averages of all data collections over the time interval from the date selected, compared to the historical median and lower threshold of acceptable performance.
Note:
The Transactions option is displayed on the navigation bar only for environments where business transaction monitoring (BTM) has been implemented.If BTM has not been implemented, the Transactions screen is not displayed.
Your Oracle Service Delivery Manager (SDM) can work with you to identify these transactions and set up monitoring.
Each transaction record shows the last data collection date and the data collection point(s). You can compare the current value with the 30 day average and with the lower threshold value for this transaction.
Each record displays:
| Field | Description |
|---|---|
| Transaction Name | Name of the transaction being monitored |
| Collection Point | Hostname of the system from which data is collected as part of monitoring |
| Last Collection | Time of the last data collection from the collection point(s) |
| 30 Day Average | Average transaction time over the last 30 days |
| Threshold | Lowest acceptable performance threshold for this transaction |
About the Environment Dashboard
About the Environment Overview
Viewing Environment Incidents
Tap the Incidents option on the navigation bar to see service request (SR) reports for this environment.
SRs are created and maintained in My Oracle Support (MOS). All SR information in Oracle Pulse is drawn from the MOS database.
Customer level incident reports provide the most complete picture of your organization's SRs because many SRs are logged without reference to an or environment. You can improve the accuracy of environment level reports by ensuring that you associate each SR with an environment as appropriate.
View any of these widgets on the Environment Dashboard Incidents screen:
Double tap any of the widgets to expand to full screen mode. Tap the chart icon in the bottom right corner of the widget to open the data view in expanded mode. You can also see incident/SR records for all your organization's Managed Cloud Services at the bottom of the screen. Tap any record to open the incident/SR summary.
Created Versus Closed Incidents
This widget shows the rate of SR closure for this environment.
Chart View: The chart view compares the number of SRs created with the number closed for each month over the selected time interval, indicating the rate of SR closure for this environment.
Data View: The data view shows detailed records for all SRs, open and closed, for this environment.
This widget shows the number of SRs created for this environment over the selected time interval, grouped by time elapsed since they were raised.
Chart View: The chart view shows the number of SRs open in each month for this environment over the selected time interval. Color coded bands indicate the time elapsed since SR creation:
-
7 days or less
-
8 to 30 days
-
31 to 60 days
-
61 to 90 days
-
91 days or more
SRs that were open during the month, but have been closed since then, are included in the monthly count.
Data View: The data view shows detailed records for all SRs, open and closed, for this environment.
This widget shows the number of incidents created or open for this environment's products.
Chart View: The chart view shows the number of incidents created for each of this environment's products, in each month of the selected time interval. Color coding indicates the SR priority in MOS, which can be critical, significant or standard.
Data View: The data view shows detailed records for all SRs, open and closed, for this environment.
Viewing an Incident Record
In the lower part of the screen, each incident record displays the name, status, and associated product for the SR. Tap any incident record at the bottom of the screen to see the full incident record.
Each record shows the following information, which is drawn from the MOS database:
| Field | Description |
|---|---|
Name, including
|
Identifying information about this SR, including:
|
| Status | Status of this SR from MOS:
|
| Product | Name of the product associated with this SR in MOS. |
| Updates | All the latest actions related to this SR. |
| Summary | MOS summary information for this SR, such as the status and the severity. |
Filtering the Incidents Displayed
To filter the incident records, select a filter from the list:
-
All Incidents lists all SRs for this environment.
-
All Open Incidents lists all open SRs for this environment.
-
Closed Requests lists all SRs for this environment.
Searching for an Incident Record
Enter the search criteria in the Search field, located in the toolbar of the incident record table. Partial strings are auto-completed. Tap the search icon to see all incident records containing the string.
About the Environment Dashboard
About the Environment Overview
Viewing Environment Recommendations
Viewing Environment Changes
Tap the Changes option on the navigation bar to see reports of requests for change (RFCs) for this environment.
View any of these widgets on the Environment Dashboard Changes screen:
Double tap any of the widgets to expand to full screen mode. Tap the chart icon in the bottom right corner of the widget to open the data view in expanded mode. You can also see change/RFC records for all your organization's Managed Cloud Services at the bottom of the screen. Tap any record to open the change/RFC summary.
Created versus Applied Changes
This widget shows the number of RFCs created, and the number applied, to this environment during the selected time interval.
Chart View: The chart view shows the number of RFCs created, and the number of RFCs applied, to this environment for each month of the selected time interval. If no RFCs were created or applied, the chart is empty.
Data View: The data view lists all RFCs that have been created for or applied to this environment.
This widget shows all RFCs, listed by RFC type, that have been applied to this environment.
Chart View: The chart view shows all RFCs, listed by RFC type, that have been applied to this environment. Defined in MOS, RFC types include refresh and backup.
Data View: The data view lists all RFCs that have been applied to this environment.
Viewing a Change Record
Records for all RFCs created for this environment are listed at the bottom of the screen. Tap any change record at the bottom of the screen to see the change details.
| Field | Description |
|---|---|
Name, including
|
Identifying information about this RFC, including:
|
| Environment | Environment associated with this RFC. |
| Status | Status of this RFC from MOS:
|
| Schedule | Time and date for which this RFC is scheduled, in the format YYYY-MM-DD HH:MiMi where YYYY is the year, MM is the month, DD is the day, HH is the hour, and MiMi is the minute. |
| Activities | All the latest activities related to this RFC. |
| Summary | MOS summary information for this RFC, such as the status and the severity. |
Filtering the Changes Displayed
To filter the change records displayed, select a filter from the list:
-
All Changes lists all RFCs for this environment
-
All Open Incidents lists all open RFCs for this environment
-
Closed Requests lists all RFCs for this environment
To search for a change record, enter the search criteria in the Search field, located in the toolbar of the change record table. Partial strings are auto-completed. Tap the search icon to see all change records containing the string.
About the Environment Dashboard
About the Environment Overview
Viewing Environment Recommendations
Scheduling a Self Service Environment Refresh or Restart
Oracle Pulse Release 5.0 provides the ability to schedule refreshes and restarts for your eligible, non-production Oracle E-Business Suite (EBSO) Database environments.
-
This is an eligible Oracle E-Business Suite (EBSO) Database environment, that is, self-service enabled.
-
You are authorized to create requests for change (RFCs).
-
You are an authorized approver for this environment, for the associated service, or for your organization.
To Schedule a Refresh or Environment Restart:
-
On the Environment Dashboard, tap Changes.
-
Tap the plus symbol on the change record toolbar.
The New Change Request page is displayed.
-
From the Change Type list, select one of the following:
-
Bounce - Restarts this environment.
-
DB Refresh - Refreshes this environment.
The Preferred Date and Time area, appears shows the present time and date plus ten minutes.
-
-
Tap Check Availability to view up to five suitable time slots. These time slots are generated automatically, taking account of system and resource availability and other factors.
-
Tap Select Available Time to accept the available time slot.
-
After reviewing the RFC number, change type (Bounce or DB Refresh), source and target systems (Bounce only), and time slot, tap OK to confirm these details.
The new change appears at the top of the Changes list.
About the Environment Dashboard
About the Environment Overview
Viewing Environment Recommendations