6 Using the Oracle Data Miner GUI
The Oracle Data Miner graphical user interface (GUI) is based on the GUI for SQL Developer 4.0. See SQL Developer User Interface. In SQL Developer, click Help and then click SQL Developer Concepts and Usage for an overview of the SQL Developer GUI. The following topics describe the common procedures and menus for the GUI that are specific to data mining and the Oracle Data Miner:
-
Miscellaneous (Search, Filtering, and Saving charts and graphs)
6.1 Graphical User Interface Overview
The Oracle Data Miner window generally uses the left side for navigation to find and select objects and the right side to display information about selected objects.
Note:
This text explains the default interface. However, you can customize many aspects of the appearance and behavior of Oracle Data Miner by setting the Oracle Data Miner preferences.Here is a simple workflow:
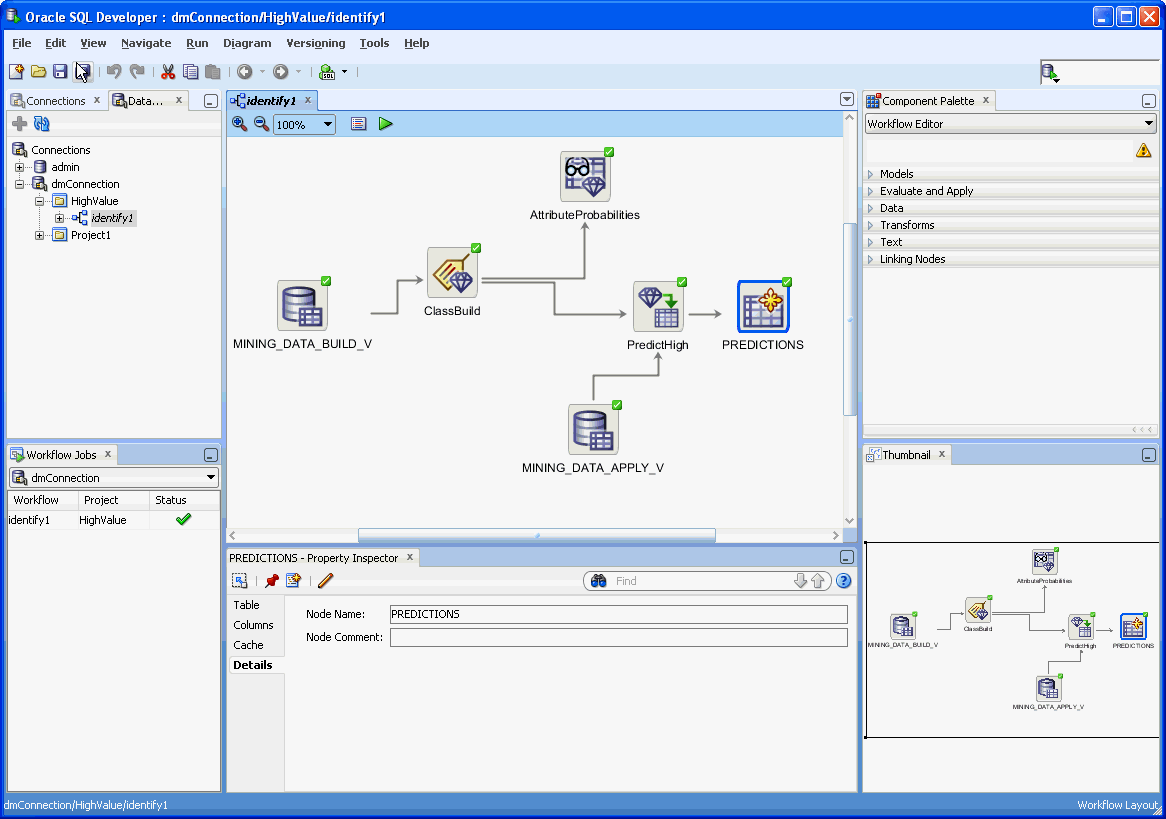
Description of the illustration guioverview.gif
-
About the Data Miner Tab: Positioned in the left pane. You manage database connections here.
-
Workflow Jobs: Positioned in the left pane. You can view the status for running tasks.
-
Components: Positioned in the right pane. You select the nodes of the workflow here.
-
Menu bar: Positioned at the top of the window.
-
Workflows are displayed in the middle pane of the window.
-
Properties: You can put this pane any place you want. It is useful to position the Properties pane just below the workflow that you are viewing.
Some settings are sticky settings. If you change a sticky setting, the new value becomes the default value.
6.2 Oracle Data Miner Functionality in the Menu Bar
The menus at the top of the Oracle SQL Developer window contain standard entries, and entries for features specific to Oracle Data Miner.
You can use keyboard shortcuts to access menus and menu items. For example Alt+F for the File menu and Alt+E for the Edit menu, or Alt+H, then Alt+S for Full Text Search of the Help topics. You can also display the File menu by pressing the F10 key.
The icons just below the menus perform a variety of actions, including the following:
-
New: Opens the New Gallery to define new database objects, such as a new database connection.
-
Open: Opens a file.
-
Save: Saves any changes to the currently selected object.
-
Save All: Saves any changes to all open objects.
-
Undo: Reverses the last operation.
There are several forms of Undo, including Undo Create to undo the most recent create node, Undo Edit Node to undo the latest edit node, and so on.
-
Redo: Does the latest undo operation again.
There are several forms of Redo, including Redo Create to redo the most recent create node, Redo Edit Node to redo the latest edit node, and so forth.
-
Back: Moves to the pane that you most recently visited. Use the drop-down arrow to specify the tab view.
-
Forward: Moves to the pane after the current one in the list of visited panes. Or use the drop-down arrow to specify a tab view.
These menus contain functionality specific to Oracle Data Miner:
6.2.1 View Menu
The following options are available in the View menu of Oracle Data Miner:
-
Data Miner
Select one of these Data Miner interfaces to open it:
-
Data Miner Connections. Also known as Data Miner tab.
For example, the option Data Miner Connections under Data Miner in View menu option, opens the Data Miner tab and related windows.
Depending on the state of the GUI, View Data Miner also enables you to:
-
Make Visible
-
Drop Repository
-
See Also:
"About the Data Miner Tab"6.2.1.1 Structure Window
The Structure window shows the structure of a workflow or certain model viewers that are currently active.
The nodes in a tree or workflow are listed in a flat list, which does not show parent or child relationships. The links are the keys that tie the nodes together.
When you view nodes and links in the Structure window, the workflow editor reacts by immediately making the selected items visible. This property is useful when you are navigating a complex workflow or tree.
See Also:
6.2.1.1.1 Structure Window and Workflow
Suppose that you have a two-node workflow simple consisting of a Data Source node and a Classification Build node. 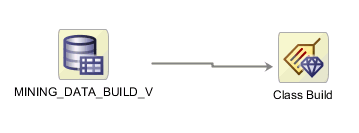
Description of the illustration simplework.gif
The view of the workflow simple in the Structure window: 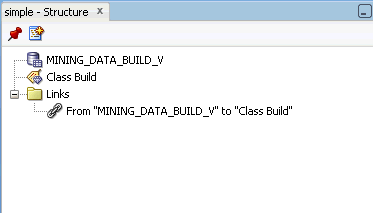
Description of the illustration simplestruct.gif
If you select an item in the Structure window, the corresponding item is selected in the workflow. For example, if you go to the Links folder and select From "DATA_MINING_BUILD_V" to "Class Build", the link between the two nodes in simple is highlighted.
6.2.1.1.2 Structure Window and Model Viewers
These model viewers include a Tree tab:
-
k-Means and O-Cluster model viewer for the Clustering models
-
Decision Tree model viewer for the DT Classification model
The Tree tab of the model viewer illustrates how the rules generated by the model are related. These trees are sometime large and complex. You can use the Structure window to navigate among the nodes of the tree, just as you navigate among the nodes of a workflow. In the Structure window, select a node or an item in the Link folder. The node or link in the model viewer is automatically highlighted.
6.2.1.1.3 Structure Window Controls
The Structure window supports these controls:
-
To freeze the Structure window on the current view, click
 .
.A window that is frozen does not track the active selection in the active window.
-
To open a new instance of the Structure window, click
 .
.The new view appears as a new tab in the Structure window.
6.2.2 Tools Menu
The following options are available in the Tools menu of Oracle Data Miner:
6.2.2.1 Data Miner
The following options are available in the Data Miner option under Tools menu:
-
Make Visible: Opens the Data Miner tab and Workflow Jobs.
-
Drop Repository: Drops the Data Miner repository.
These actions are usually performed as part of the Oracle Data Miner installation.
6.2.2.2 Data Miner Preferences
You can set preferences for Oracle Data Miner. To set preferences, click Tools and then Preferences. Under Preferences, click Data Miner. Data Miner preferences are divided into several sets:
-
Node Settings: Consists of settings for model nodes, parallel processing, and the Transforms node
-
Viewers: Consists of settings for Data Viewers and Model Viewers
-
Workflow Import/Export directory
6.2.2.2.1 Node Settings
Node settings specify the behavior of workflow nodes:
6.2.2.2.2 Models
Model settings specify properties for:
6.2.2.2.3 Apply
These preferences specify how Apply nodes operate.
Automatic Apply Settings Default is either Automatic or Manual. By default, the settings are set to Automatic.
See Also:
"Automatic Settings"Automatic Data Settings Default is either Automatic, the default, or Manual.
Default Column Order is either Data Columns First or Apply Columns First. Default Columns First is set as the default.
6.2.2.2.4 Model Build
Specify default values for model build options. Defaults depend on the mining function:
6.2.2.2.5 Association
The default maximum distinct count for item values is 10. Change the default to a different integer.
6.2.2.2.6 Classification
By default, a Classification node automatically generates four models, one each using:
-
Decision Tree
-
General Linear Model
-
Naive Bayes
-
Support Vector Machine
All four models have the same input data, the same target, and the same case ID (if a case ID is specified).
If you do not want to build models using one of the default algorithms, then deselect that algorithm. You can still add models using the deselected algorithm to a Classification node.
By default, the node generates these test results for tuning:
-
Performance Metrics
-
Performance Matrix (Confusion Matrix)
-
ROC Curve (Binary only)
-
Lift and Profit. The default is set to the top 5 target values by frequency. You can edit the default setting. By default, the node does not generate selected metrics for Model tuning. You can select the metrics for Model tuning.
You can deselect any of the test results. For example, if you deselect Performance Matrix, a Performance Matrix is not generated by default.
By default, split data is used for test data. Forty percent of the data is used for testing, and the split data is created as a table. You can change the percentage used for testing and you can create the split data as a view instead of a table. If you create a table, then you can create it in parallel. You can use all of the build data for testing, or you can use a separate test source.
6.2.2.2.7 Clustering
By default, a Clustering node builds two models, one each using O-Cluster and k-Means.
If you are connected to Oracle Database 12c or later, then a Clustering node also builds an Expectation Maximization model, so that three models are built.
All Clustering models in the node have the same input data and the same Case ID, if one is specified.
If you do not want to build models using one of the algorithms by default, then deselect that algorithm. A user will still be able to add models using the deselected algorithm to a Clustering node.
6.2.2.2.8 Feature
By default, a Feature Extraction node builds a Nonnegative Matrix Factorization model.
If you are connected to Oracle Database 12c or later, then the node also builds a Principal Component Analysis model. You can specify that the node builds a Singular Value Decomposition model.
If you do not want to build models using one of the default algorithms, then deselect that algorithm. You can still add models using the deselected algorithm to a Classification node.
6.2.2.2.9 Regression
By default, a Regression node builds two models, one each using General Linear Model and Support Vector Machine.
All models in the node have the same input data, target, and case ID, if a case ID is specified.
If you do not want to build models using one of the default algorithms, then deselect that algorithm. You can still add models using the deselected algorithm to a Regression node.
By default, two test results, Performance Metrics and Residuals, are calculated.
By default, split data is used for the test data. The split is 40 percent and the split data is created as a view.
6.2.2.2.10 Model Details
By default, a Model Details node uses automatic settings. You can deselect automatic settings for a specific model details node, or you can deselect automatic settings for all model details nodes.
6.2.2.2.11 Test
By default, a Test node uses Automatic Setting. You can:
-
Deselect Automatic Settings for a particular Test node.
-
Deselect Automatic Settings for all Test nodes.
6.2.2.2.12 Parallel Processing
You can specify default settings for parallel processing for nodes.
-
To turn on parallel processing:
-
Click the corresponding check box in the Parallel column for the node type.
-
Click All to set parallel processing for all node types.
-
Click None to set parallel processing for none of the node types.
-
-
To specify degrees of parallelism for a node type:
-
Select the node type and click
 . The default degree of parallelism is system determined.
 -
To specify a value, select Degree Value. The Default value is 1. The specified value is displayed in the Degree of Parallel column for the node type.
-
If you specify parallel processing for a node type, then the query generated by the node may not run in parallel.
You can override the preferences for a specific node.
See Also:
"About Parallel Processing"6.2.2.2.13 Text
These values describe how Text is handled during a model build.
The default categorical cutoff value is 200
The default transformation is Token.
Token transformation settings use these defaults:
-
Language: English with stemming (deselected)
-
Stoplist: Default Stoplist
-
Maximum number of tokens: 3000
Theme transformations use these defaults:
-
Language: English with stemming (deselected)
-
Stoplist: Default Stoplist
-
Maximum Number of themes across all documents: 3000
6.2.2.2.14 Transforms
The preference that applies to all transformations is:
-
Generate Cache Sample Table to Optimize Viewing:
The default setting is to not generate a cache sample table. Generating a sample cache table is useful if you are processing large amounts of data.
For individual transformations, the options are:
6.2.2.2.15 Filter Columns
The preferences specify the behavior of the Filter Columns transformation. You can specify the following Data Quality criteria:
-
% Nulls less than or equal: Indicates the largest acceptable percentage of
NULLvalues in a column of the data source. The default value is95%. -
% Unique less than or equal: Indicates the largest acceptable percentage of values that are unique to a column of the data source. The default value is
95%. -
% Constant less than or equal: Indicates the largest acceptable percentage of constant values in a column of the data source.
Attribute Importance is not selected by default. You can specify these settings:
-
Importance Cutoff: A number between 0 and 1.0. The default cutoff is 0.
-
Top N: The maximum number of attributes. The default is 100.
The column filter by default uses sampling to determine data quality and attribute importance. The default is to use a sample size of 2000 records. You can turn off sampling, that is use all of the data, or increase the sample size.
6.2.2.2.16 Filter Columns Details
The default setting is to select Automatic Settings.
See Also:
"Filter Columns Details"6.2.2.2.17 Join
These preferences control how the Join transformation works:
-
Automatic Key Column Deletion:
-
Automatic
-
Manual
-
Default
-
-
Automatic Data Column Default:
-
Automatic
-
Manual
-
Default
-
6.2.2.2.18 Sampling
There are two preferences for Sampling:
-
Sampling Type: By default, the Sampling Type is
Randomwith the Seed 12,345. You can change the value of Seed.Sampling Type can be changed to
TopN. -
Sampling Size: This is either the number of rows or the percentage for the sampling size. The default size is either 2000 rows or 60%.
6.2.2.2.19 Viewers
Viewers settings specify the behavior of:
6.2.2.2.20 Data
There are preferences for:
6.2.2.2.21 Explore Data Viewer
Precision is the maximum number of significant decimal digits, where the most significant digit is the left-most nonzero digit, and the least significant digit is the right-most known digit. Precision is an integer greater than or equal to zero.
These preferences specify data precision for data viewed in the Explore Data node.
The default precision for both percentage based values and numeric values is 4. You can change either or both of these values.
6.2.2.2.22 Graphical Settings
Specify preferences for Depth Radius and Chart Style.
The default Depth Radius is 0.
The default Chart Style is Nautical.
6.2.2.2.23 Model
These general preferences apply to all Model viewers.
-
Precision Level Settings specify precision:
-
For Percentage Based Values, the default precision is 4.
-
For Numerical Values, the precision is 8.
-
-
Fetch Size Settings specify the number of items fetched. The default fetch size for:
-
Association Rule Model: 1000
-
Clustering Rules Model: 20
-
All Other Models: 10,000
-
There are additional preferences for the tree displays:
See Also:
"Explore Data Viewer" for more information about precision definition.6.2.2.2.24 Cluster Tree
-
Default Node display: A detailed header
-
Default Layout: Vertical
There are also settings for Cluster Tree Node.
6.2.2.2.25 Tree Node
For each Tree Node in a cluster tree:
-
The maximum display length for the Centroid Attribute Name is 25
-
The maximum display length for Centroid Value is 25
6.2.2.2.26 Decision Tree
-
Default Node Display: Histogram and Detailed Header.
-
Sort Target Values By: Root Node order. You can also sort by Confidence.
-
Default layout: Vertical. You can also choose Horizontal.
There are also settings for Decision Tree Tree Node.
6.2.2.2.27 Tree Node
For each Tree Node in a Decision tree, the length of the target value is 25 characters.
6.2.2.2.28 Workflow Editor
In the Workflow Editor, the following are the options and their default settings:
-
Node Assist: Selected by default. Wizards are automatically displayed when a node is created or connected. For example, if you add a Data Source node to a workflow, then the Data Source Editor is automatically opened. You can deselect this option.
-
Link Style: Direct. In the Direct link style, links are straight lines from one node to another with short segments. Direct link style produces a more compact, direct diagram layout. You can select Orthogonal link style.
-
Alternate Link Routing: Deselected by default.
6.2.2.2.29 Workflow Import/Export
Workflow Directory is the default directory to import workflows from and to export works. The default value for Workflow Directory is the default for the operating system where Oracle Data Miner is installed. For example, Workflow Directory is My Documents for Microsoft Windows operating systems.
To change the Workflow Directory, enter the name of the new directory or click Browse to browse for the directory. After you specify the directory name, click OK.
6.2.2.2.30 Workflow Jobs
Preferences for the Workflow Jobs specify which connection is displayed and how long the workflow status is displayed:
-
Automatically Display Connection Selected in Navigator: By default, this option is selected. You can deselect it. If you deselect this option, then you must explicitly select a connection.
-
Don't Display Jobs Older Than 24 Hours: By default, this option is selected. You can change this option.
6.2.3 Diagram Menu
The Diagram menu is available when a workflow is open. Use the options on this menu to arrange workflow nodes.
The Diagram menu has these options:
6.2.3.1 Connect
Use this option to select a node in the workflow.
-
To connect a node: Select Diagram and click Connect. Link the selected node to another node by drawing a line from the selected node. You can only make valid selections.
-
To cancel a connection: To cancel a line that is not connected to anything, press Esc. This is the same operation as using the Connect option from the node context menu.
6.2.3.2 Align
You can use this option to align a set of elements and normalize the size of elements.
Horizontal Alignment
- None (Default): Performs no horizontal alignment.
- Top: Aligns the top edges of the selected elements.
- Middle: Aligns the horizontal centers of the selected elements.
- Bottom: Aligns the bottom edges of the selected elements.
Vertical Alignment
- None (Default): Performs no vertical alignment.
- Left: Aligns the left edges of the selected elements.
- Middle: Aligns the vertical centers of the selected elements.
- Right: Aligns right edges of the selected elements.
Size Adjustments
- Same Width: Changes the width of the selected elements to the average width of all the selected elements.
- Same Height: Changes the height of the selected elements to the average height of all the selected elements.
6.2.3.3 Distribute
You can use this option to evenly distribute (horizontally and vertically) selected elements in a diagram.
-
Horizontal Distribution: Changes the left or right distribution of the selected diagram elements.
-
Vertical Distribution: Changes the up or down distribution of the selected diagram objects.
6.2.3.4 Bring to Front
You can use this option to move the selected node in front of all other nodes.
6.2.3.5 Send to Back
You can use this option to move the selected node behind all other nodes.
6.2.3.6 Zoom
To zoom the view, go to Diagram and click Zoom. This menu is displayed: 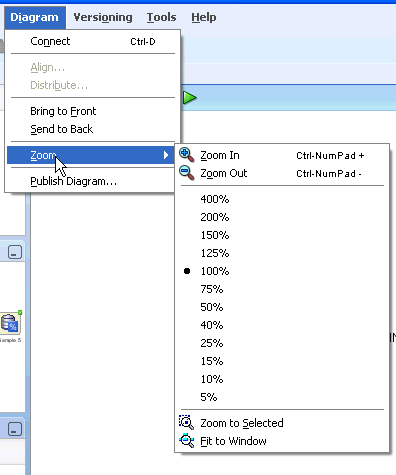
Description of the illustration diagram_zoom.gif
The default zoom setting is 100%. To return to the default, select 100%.
-
To zoom in or zoom out of an entire workflow: Click
 and
and  respectively, or set a specific percentage.
 -
To zoom in on a specific node or nodes: Select the node and then go to Diagram and click Zoom.
-
To fit the entire workflow in the window: Select Fit to Window.
6.2.3.7 Publish Diagram
You can use this option to save the current workflow as a graphic file in your system.
To publish a diagram:
-
Open the workflow that you want to save as a graphic file.
-
Go to Diagram and select Publish.
-
Browse for a location to save the graphic file.
-
Select the graphic file format. The supported file formats are:
-
PNG (default)
-
SVG
-
SVGZ
-
JPEG
-
-
Click OK. The workflow is saved as a graphic file.
6.3 Workflow Jobs
Workflow Jobs displays all running and recently run tasks, arranged according to connection. A task consists of running of a selected node and any ancestor nodes that must be run before running the node.
The following conditions apply for Workflow Job display:
-
Workflow Jobs displays the most recent run of a workflow.
-
When two or more tasks are active, the Workflow Jobs window is automatically displayed.
-
By default, the Workflow Jobs automatically displays the connection selected in the tab. To view tasks in a different connection, select a connection from the list at the top of the tab.
-
Workflow Jobs specifies for how long a task is displayed.
You an perform multiple tasks from the Workflow Jobs context menu. Right-click a line in the grid or below the lines in the grid.
See Also:
"Workflow Jobs Context Menu"6.3.1 Viewing Workflow Jobs
To view Workflow Jobs:
-
In the SQL Developer menu bar, go to View and click Data Miner.
If the Data Miner tab is not visible, then go to Tools and click Data Miner. Under Data Miner, click Make Visible. -
Under Data Miner, click Workflow Jobs.
6.3.2 Working with Workflow Jobs
You can perform the following tasks with Workflow Jobs:
-
View a particular task: Select the connection in which the task is running. Connections are listed in a drop-down list just above the Workflow Jobs Grid.
-
Terminate a running workflow: Click
 .
. -
View a log: Right-click a process in the Workflow Jobs and click View Log.
6.3.3 Workflow Jobs Grid
The Workflow Jobs grid displays the following:
-
Workflow name
-
Project name
-
Status. The values are:
-
ACTIVE: Indicates that the workflow has been executed. Indicated by
 .
. -
INACTIVE: Indicates that the workflow is idle.
-
STOPPED: Indicates that the workflow has been stopped.
-
SCHEDULED: Indicates that the workflow is scheduled to run.
-
FAILED: Indicates that the workflow execution has failed. Indicated by
 .
.
-
6.3.4 View an Event Log
To view a log of data mining events in the selected connection, right-click an entry in the workflow jobs and select Show Event Log. You can also click ![]() at the top of a workflow, just under the tab.
at the top of a workflow, just under the tab.
By default, all errors are displayed. You can display errors or informational events. The total number of events and the number of events displayed is at the top of the list. For example, Events: 2 of 90 means that 2 of the 90 events are displayed.
Each error or warning has a message and details associated with it. Select an event. The message and details are displayed in the lower pane of the Event Log window.
For each data mining event in the selected connection, the following are displayed:
-
Event: In Oracle Data Miner, events indicate the beginning and end of actions, such as
START(WORKFLOW)andEND(WORKFLOW).Each node is processed sequentially. -
Job: The name of the job that processes the event. These jobs are internal to Oracle Data Miner.
-
Node: The name of the node that is being processed. Not all events are associated with a node.
-
Sub-node: An internal step during node processing. For example, an Anomaly Build node has a sub-node that builds the model.
-
Time: Start time of the event.
-
Message: A message about the event. If the event did not encounter problems, then there is no message.
To see more information about the message, including message details, select the event. The message and the details are displayed in the pane below the list of events. Not all events have messages or message details associated with them.
-
Duration: The amount of time that is spent on processing the event. The duration is displayed for
ENDevents. The duration is displayed in days, hours, minutes and seconds.
All errors are shown. You can select the type of event to display by clicking the icons above the list of events:
-
To display errors, and events that failed, click
 .
.The default is to display errors only.
-
To display warnings, click
 .
. -
To display Informational Messages, such as the start and end of operations, click
 .
. -
To refresh, click
 .
. -
To search for events, click the down arrow next to
 . You can search by
 Node(default) or byAnyto search for anything that is not a node.
6.3.4.1 Informational Messages
Informational messages show the beginning and end of internal operations performed when a workflow runs. The following informational messages describe a successful build of an Anomaly Detection Model. The workflow took 5 minutes and 12 seconds to run. There were 26 events.
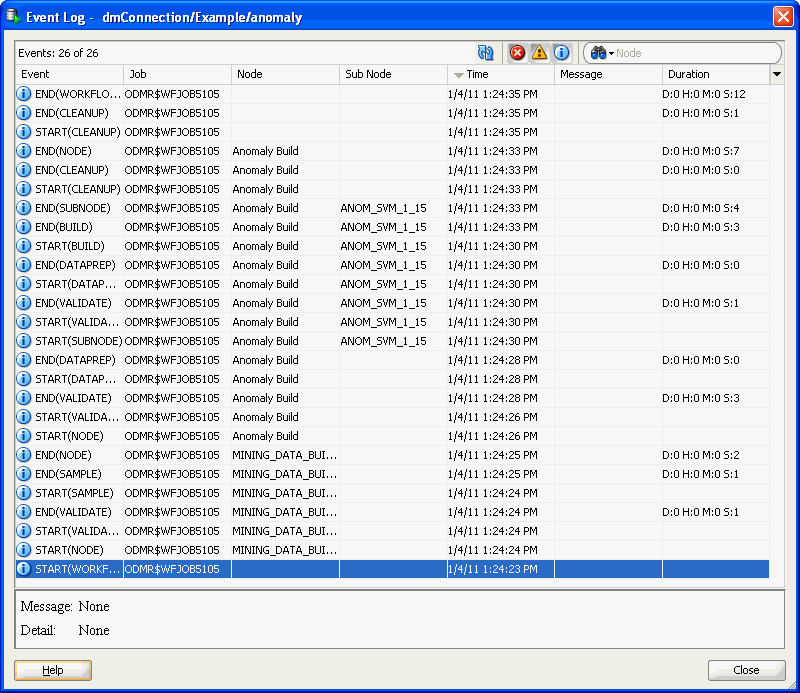
Description of the illustration informational.gif
6.3.5 Workflow Jobs Context Menu
To view the context menu, right-click a line in the Workflow Jobs grid or in a blank area of the grid. The context menu options are:
-
Go to Workflow: Displays the workflow for this result.
-
Sort by Most Recent: Sorts the entries.
-
Preferences: Displays the Workflow Jobs.
6.4 Projects
Projects reside in a connection. Projects contain all the workflows created in the data mining process.
You must create at least one project in a connection.
See Also:
"Data Miner Projects"6.5 Miscellaneous
This section describes several common controls and tasks:
-
Filter: Describes general information about filters.
6.5.1 Filter
To filter your search:
-
To display only those items that you are interested in, click
 . In other words, you can filter out items that you are not interested in, by using this option.
There are several filter options and a default option. To select a different filter option, click the triangle beside the binoculars icon. -
To clear the search, click
 .
.
6.5.2 Import Data (Oracle Data Miner)
Use the SQL Developer Import Data wizard to import data into a database table. You can create a table and import data into it, or you can import data into an existing table. In other words, you can import delimited data in an operating system file to the database.
To import data:
-
In SQL Developer, go to Connections.
-
Expand the connection that you are using for data mining.
-
Right-click the Tables node or a table name and select Import Data.
-
Specify the files from which to import the data. The file can be one of the following formats: XLS, TXT, CSV.
-
Click OK.
6.5.3 Filter Out Objects Associated with Oracle Data Mining
The Filter option filters out Oracle Data Miner (DR) objects and Oracle Data Mining (DM) objects. To filter the tables associated with data mining:
-
In SQL Developer, go to Connections.
-
Expand the user account that you use for data mining and select Tables.
-
In the tool bar for Connections, click
 .
. -
Select these filter criteria:
NAME NOT LIKE DR$%
NAME NOT KLIKE DM$%
NAME NOT LIKE ODMR$%
-
Click OK to filter the tables.
6.5.4 Copy Charts, Graphs, Grids, and Rules
You can export charts, graphs, grids, and also Cluster and Decision Tree Rules for use in external documents by copying them to the Microsoft Windows clipboard or saving them to a file. You can:
-
Copy charts to the clipboard or save to a file: To copy charts, right-click the chart and select any one of the following options in the content-menu:
-
Copy to Clipboard
-
Save Image As
-
View Data
-
-
Copy data grids to the clipboard: You can copy one or multiple rows in the Graph Data dialog box. To copy data grids:
-
Select the row that you want to copy in the Graph Data dialog box, while pressing the Ctrl key. To select multiple rows, click the rows while pressing the Ctrl key and Shift keys together.
-
Then copy the selected rows by pressing the Ctrl + C keys.
-
To paste the copied rows in the clipboard, press Ctrl + V keys.
-
-
Copy and view data content of charts: To copy data content of charts, right-click and select any one of the following options in the content menu:
-
Copy Image to Clipboard
-
Save Image As
-
-
Copy Cluster and Decision Tree Rules to the clipboard or to a file: To copy Cluster and Decision Tree Rules to a clipboard or a file, use the Save Rules option in the Model viewer.