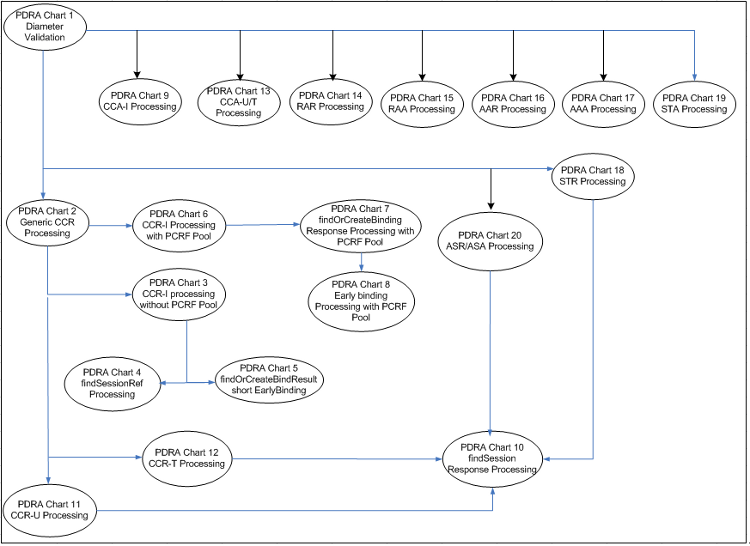
Figure 1 shows a summary of the error resolution flowcharts in this section and their relationships to each another. This relationship tree should help you understand the P-DRA business logic as it relates to error resolution task.
Each reference in the flowchart summary points to a corresponding error resolution flowchart in this appendix. Use the following table to reconcile those references:
| Chart number | Flowchart Name | Link |
|---|---|---|
| Chart 1 | Diameter Message Validation | Figure 1 |
| Chart 2 | Generic CCR Processing | Figure 1 |
| Chart 3 | CCR-I Processing without PCRF | Figure 1 |
| Chart 4 | findSessionRef Processing | Figure 1 |
| Chart 5 | findOrCreBindResShort Processing | Figure 1 |
| Chart 6 | CCR-I Processing with PCRF Pool | Figure 1 |
| Chart 7 | findOrCreateBinding Response Processing with PCRF Pool | Figure 1 |
| Chart 8 | Early Bind Pool | Figure 1 |
| Chart 9 | CCA-I Processing | Figure 1 |
| Chart 10 | findSession Response Processing | Figure 1 |
| Chart 11 | CCR-U Processing | Figure 1 |
| Chart 12 | CCR-T Processing | Figure 1 |
| Chart 13 | CCA-U/T Processing | Figure 1 |
| Chart 14 | RAR Processing | Figure 1 |
| Chart 15 | RAA Processing | Figure 1 |
| Chart 16 | AAR Processing | Figure 1 |
| Chart 17 | AAA Processing | Figure 1 |
| Chart 18 | STR Processing | Figure 1 |
| Chart 19 | STA Processing | Figure 1 |
| Chart 20 | ASR/ASA Processing | Figure 1 |
Error Resolution Flowchart Summary