Effectiveness Graphics for QoS Plus
- Data Transferred By Number of Accesses
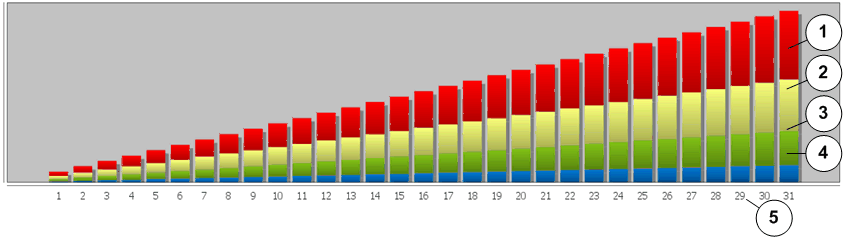
Indicates a histogram of the different regions of all of the LUNs in the Storage Domain by the frequency of I/O access.The histogram bar height represents the amount of data transferred. The y‑axis is not labeled.
- Tier Structure By Storage Class and Priority
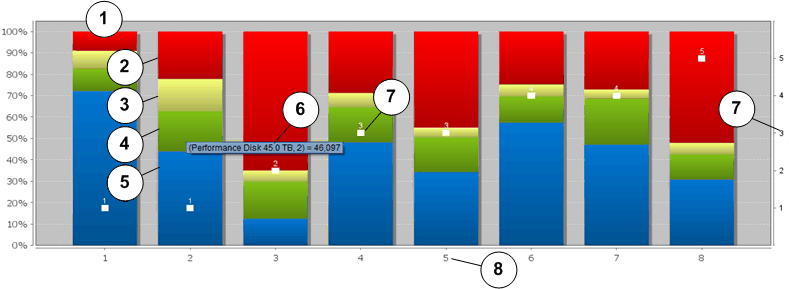
Indicates a graph of the Storage Class and the capacity of the LUN regions for the selected auto‑tiered LUNs. The chart also shows a number that represents the QoS priority for the auto‑tiered LUN. A table at the bottom of the chart provides the list of selected LUNs. The table is also a legend for the LUNs that are represented on the graph.
The two graphs allow you to observe the placement of the data blocks and determine the effectiveness of the QoS Plus feature that is applied to the selected auto‑tiered LUNs.
- Legend
-
1 I/O activity of the LUN region that occupies the Performance SSD 4 I/O activity of the LUN region that occupies the Capacity HDD 2 I/O activity of the LUN region that occupies the Capacity SSD 5 LUN region 3 I/O activity of the LUN region that occupies the Performance HDD
The histogram represents the I/O distribution and the data transfer activity for all of the auto‑tiered LUNs in the Storage Domain. The system counts the number of I/O accesses that was necessary to transfer data to and from the auto‑tiered LUNs. The information is then plotted on the graph from the lowest I/O activity to the highest. The system categorizes different regions of a LUN by the frequency of access and by Storage Class. The graph shows the amount of data transferred to each of these categories.
QoS Plus is most effective if the regions of the LUN that receive most of the I/O are in the best Storage Class. The graph shows that the storage is used effectively when the regions of the LUN that receive the most number of accesses are also in the most efficient Storage Class that is available, which is the Performance solid-state drives (SSDs). If the regions of the LUN with the most number of accesses are not in SSD, the performance could be improved by adding Performance SSD capacity to the Storage Domain.
- Legend
-
1 Allocated capacity of the LUN 5 Relative LUN storage capacity that occupies the Capacity HDD 2 Relative LUN storage capacity that occupies the Performance SSD 6 Tooltip 3 Relative LUN storage capacity that occupies the Capacity SSD 7 QoS Priority value: 1 = Premium
2 = High
3 = Medium
4 = Low
5 = Archive
4 Relative LUN storage capacity that occupies the Performance HDD 8 LUN Row number that corresponds to the list of LUNs below the graph
The Storage Class of each region within the LUN
The storage capacity of each region
A value that represents the QoS priority of the LUN
The graph information helps you determine if your LUNs are placed in the optimum Storage Class and assigned the appropriate QoS priority. Ideally, you want your LUNs with heavy I/O loads and larger capacity requirements assigned to the premium Storage Class and using the highest QoS priority level. Conversely, you want the LUNs with low I/O loads assigned to the low-cost Storage Class using a low QoS priority level.
Effectiveness Reports for QoS Plus
The Generate Auto‑Tier Effectiveness Report dialog allows you to view the Auto‑Tier Effectiveness report. The report summarizes the results of the analysis that the QoS Plus feature has performed on the auto‑tiered LUNs in the Storage Domain.
- Constrained skew
- Indicates the degree of uniformity of the data distribution and the I/O activity across all of the Storage Classes that are available to the auto‑tiered LUN. The report provides a value between 0 and 1. Use the information in the following table as a guide in interpreting the constrained-skew value.
Table 1 Constrained skew Approximate constrained skew value Description Is close to 1.0
Indicates that the I/O activity and that the LUN data are unevenly distributed across all of the available Storage Classes.
The LUN contains a small amount of data, which resides on high-cost Performance SSDs, that are receiving all of the I/O activity. The same LUN also contains a majority amount of data that resides on low-cost storage, such as Capacity drives, that is never accessed.
QoS Plus can benefit the LUN.
Is close to 0
Indicates that the I/O activity and data are evenly distributed across all of the available Storage Classes.
QoS Plus can provide little benefit for the LUN.
- Average IOPS
Indicates the number of IOPS that are averaged over the previous auto‑tier scan cycle.
- Peak IOPS
Indicates the number of IOPS for a two‑minute time frame where the IOPS were the greatest during the previous auto‑tier scan cycle.