35 Managing the PDU
The following information is included in this chapter:
35.1 Getting Started with PDU Management
Enterprise Manager Cloud Control 13.1 enables management and monitoring of Oracle hardware targets, including servers, switches, ZFS Storage appliance, Exadata storage cells, PDUs, racks, and Engineered Systems. PDU target provides monitoring information about the PDU powering the hardware in the rack.Discovering and managing your targets is a prerequisite for almost every action in the software. The discovery is made quick and easy with the Guided Discovery Wizard that guides you through the whole process. The discovery process requires only necessary information as input and helps you solve possible issues in order to successfully complete the discovery.
35.2 Location of PDU Information in the User Interface
Table 35-1 shows where to find information.
Table 35-1 Location of PDU Information in the BUI
| Object | Location |
|---|---|
|
Power Distribution Unit |
In the Enterprise Manager user interface, under Targets, click All Targets. In the Refine Search section, under Target type, click Servers, Storage, and Network. Click Systems Infrastructure PDU, then select a PDU from the displayed list. |
35.3 Actions for PDU
You can perform the following actions, depending on the requirements.
-
Discover a PDU
-
View the PDU
35.4 PDU Version Identification
PDU hardware is shipped in two versions, namely PDU v1 and PDU v2.
You can distinguish the PDU version by accessing the PDU Management Interface. This interface is accessible using the web browser on IP address or DNS name that you have assigned to the PDU. Knowledge of PDU version is required to solve some PDU monitoring or discovery issues.
Note:
PDU may be on an isolated management network not reachable by your web browser. In that case, make sure you reach the PDU management interface from within the management network.-
Open the web browser.
-
Enter the address of the PDU Management Interface in the web browser.
For example, http://<IP or DNS name of your PDU> for PDU v1 or https://<IP or DNS name of your PDU> for the PDU v2.
Note:
Whether to use http:// or https:// for the PDU v2 depends on how your PDU is configured. Try to use both if you are not sure. If neither of http:// or https:// work, the PDU is probably offline or the PDU address is incorrect. If the PDU Management Interface is turned off, you can turn it on using the PDU SNMP interface. -
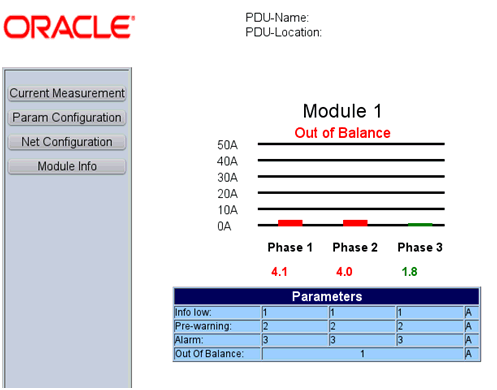
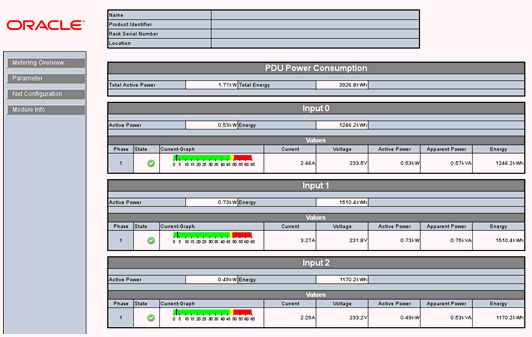
In the PDU Management Interface, you can distinguish the PDU version by checking the PDU Power Consumption section. The PDU Consumption details are displayed only for PDU v2. Figure 35-1 is an example for PDU v1 management interface and Figure 35-2 is an example for PDU v2 management interface.
35.5 Viewing the PDU Information
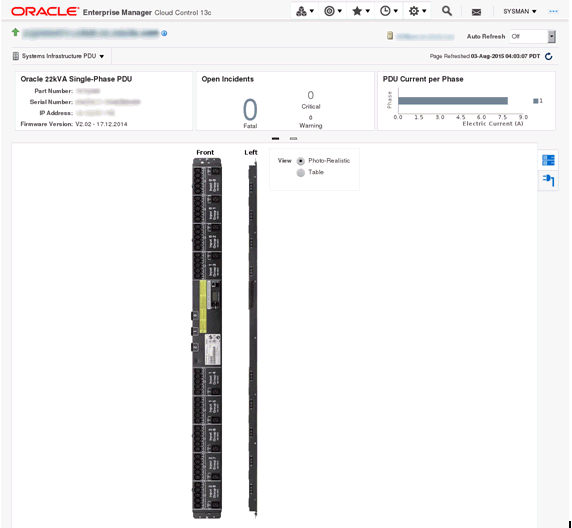
The PDU information screen is divided into two parts. The top region consists of dashlets that provide you a general overview of the system. The main region displays more detailed information of the PDU.
The first dashlet in the first series displays the summary of the PDU. It displays the part number, serial number, IP address, and firmware version of the PDU.
The second dashlet in the first series displays all the open incidents relayed on the PDU. Click on one of the displayed numbers to view the list of incidents of a given severity.
The third dashlet in the first series displays the power usage of the PDU. It displays a summary of the power (current) in amperes per phase of all the modules of the PDU.
The first dashlet in the second series displays the last configuration changes made on the PDU. It also displays the time when the last incident was raised.
35.5.1 Physical View of the PDU
Click the first tab in the main section of the PDU landing page for a physical view of the PDU. Physical view of the PDU displays the front and side view of the PDU. The PDU consists of one or more modules. You can click on any of the modules or the PDU itself to view more detailed information.
You can switch between photorealistic and tabular representation of the view.
-
Photorealistic view provides a realistic picture of the PDU, providing detailed graphics of all the components.
-
Table view is a tabular representation of the physical view, providing a list of displayed components with the most important information.
Figure 35-3 is a representation of the physical view of the PDU.
35.5.2 PDU Load View
Click the second tab of the main section of the PDU landing page to see the PDU Load view. The PDU load view displays historical data of the phase load (current, in Ampere) per module.
35.6 Changing PDU Monitoring Credentials
In case the HTTP and SNMP PDU credentials are changed on the PDU, you can change the credentials in the Enterprise Manager using the PDU's Management Interface.
35.6.1 Change the HTTP Credentials
Perform the following steps to change the http credentials:
-
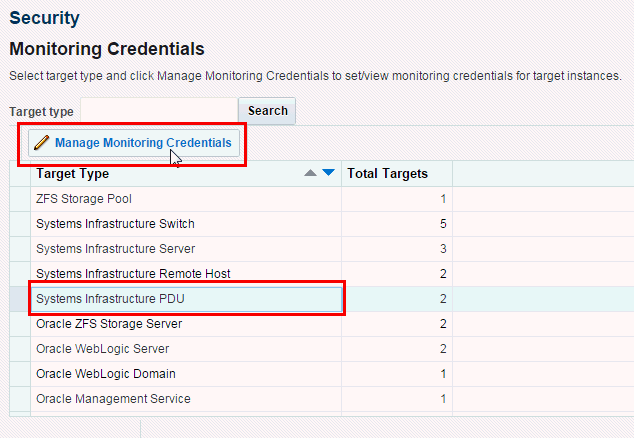
Under Setup, click Security, then click Monitoring Credentials.
-
In the Target Type column, select Systems Infrastructure PDU, then click Manage Monitoring Credentials.
-
In the Systems Infrastructure PDU Monitoring Credentials screen, select the HTTP Monitoring Credentials (in the Credential Set column), then click Set Credentials.
-
In the Enter Monitoring Credentials screen, enter new credentials for the PDU HTTP, then click Test and Save.
35.6.2 Changing the SNMP Credentials
Perform the following steps to change the SNMP credentials:
-
Under Setup, click Security, then click Monitoring Credentials.
-
In the Target Type column, select Systems Infrastructure PDU, then click Manage Monitoring Credentials.
-
In the Systems Infrastructure PDU Monitoring Credentials screen, select the SNMP Monitoring Credentials (in the Credential Set column), then click Set Credentials.
-
In the Enter Monitoring Credentials screen, enter new credentials for the PDU SNMP, then click Save.
35.7 PDU Test Connection and Metric Collection Error Troubleshooting
Collection of some PDU metric or test connection might fail. In that case, PDU test connection fails with an error message. This section explains how to troubleshoot such conditions.
35.7.1 Test Connection Error Identification
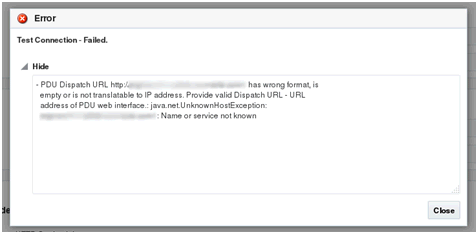
If a test connection fails, a message with a problem description is displayed. See the PDU Error States and Resolution table for possible PDU error states and their resolution and try to fix the problem source as described in the table and repeat the test connection.
35.7.2 Metric Collection Error Identification
If collection of some metric fails, a metric collection error event is raised for the PDU.
Note:
Incidents are not generated from metric collection errors by default. You can turn on incidents generation under Setup > Incidents > Incident Rules.Search for the rule Group metric collection error events for a target and enable it.
Perform the following steps to identify and view and view all metric collection errors of PDU:
-
Go to Target Menu at the left top corner of the PDU landing page, click Systems Infrastructure PDU.
-
Click Monitoring, then click All Metrics.
-
In the Overview section, click on the number in Metric Collection Errors.
-
Select and click a metric collection error to view more details.
A detailed error description is displayed.
See the PDU Error States and Resolution table for possible PDU error states and their resolution, try to fix the problem source as described in the Table 35-2, "PDU Error States and Resolutions". Repeat evaluation for every failed metric.
35.7.3 Metric Recollection
If you have evaluated all failed metrics, repeat the metric collection.
-
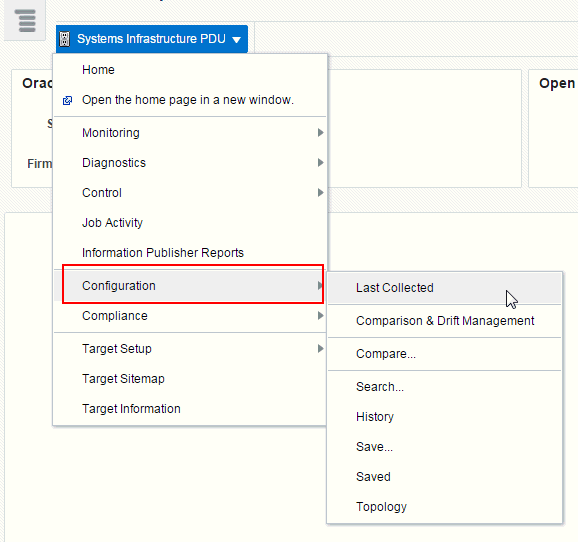
Go to Target Menu at the left top corner of the PDU landing page, click Configuration, then click Last Collected.
-
In the Latest Configuration screen, click the Refresh button.
When metrics are collected again and all reasons of collection errors are resolved, the incident disappears from Incidents Manager, dashlet, and Photorealistic view.
If the failed metric is displayed with the word Status, it is a performance metric which cannot be refreshed. You have to wait for the next scheduled metric recollection. In a default configuration, PDU performance metrics are recollected every 15 minutes.
Note:
Metric recollection interval can be changed by user in Enterprise Manager in Target Menu, submenu Metrics, item Metric and Collection Settings.35.8 PDU Error States
Most of the error states that can happen during test connection or metric collection are caused by PDU or network misconfiguration or unresponsive PDU. These errors can be fixed by user.
If you have completed problem resolution, repeat metric collection as described in Metric Recollection or test connection as described in Discovering and Promoting PDUs.
List of errors in the PDU Error States and Resolution table is not a complete list. New messages may be added or changed in the next releases.
Table 35-2 PDU Error States and Resolutions
| Error Message | Resolution |
|---|---|
|
PDU Dispatch URL http://pdu.example.com has incorrect format, is empty or is not translatable to IP address. Provide valid Dispatch URL - URL address of PDU web interface.: detailed exception |
Check that you provided valid PDU DNS name in PDU discovery. If you are sure you provided valid DNS name, make sure you have got DNS correctly configured on hosts with monitoring and backup agents. |
|
Cannot communicate with #PDU: 127.0.0.1. PDU is unreachable. PDU Web interface cannot be reached using HTTP or HTTPS. Check if PDU is online (Open address http://127.0.0.1 in web browser, try both http:// and https://) and try to repeat action (metric collection, connection test).: detailed exception |
Check that PDU is up and running as described in PDU Version Identification. Check your network configuration if PDU is reachable from monitoring agent and backup agent if set. |
|
Cannot communicate with #PDU: pdu.example.com using SNMP. PDU SNMP interface is down or unreachable or SNMP community string is incorrectly configured. Check if PDU is online (Open address https://pdu.example.com in web browser), check if community string is set correctly in Enterprise Manager and in PDU (Open address https://pdu.example.com in web browser, go to Net Configuration section, login, see NMS IPs-Communities table and Trap Hosts Setup IPs-Communities table), check if SNMP is enabled (Open address https://pdu.example.com in web browser, go to Net Configuration section, login, see if SNMP is enabled) and try to repeat action (metric collection, connection test). |
Check that PDU is up as described in PDU Version Identification. If yes, check if NMS and Trap Hosts Setup tables are correct and SNMP Community string was not changed as described in Verify PDU v1 NMS Table and Trap Hosts Setup Table and Verify PDU v2 NMS Table and Trap Hosts Setup Table, then recollection SNMP Configuration metric as described in Metric Recollection. If SNMP Community was changed in the PDU Management Interface, change it in the Enterprise Manager as well. Community string change is described in Metric Collection Error Identification. |
|
Cannot identify PDU model of #PDU: pdu.example.com. PDU model is not supported or it not possible to identify PDU model because the PDU is not reachable. Check that PDU is online (Open address https://pdu.example.com in web browser, try both http:// and https://) and try to repeat action (metric collection, connection test) or try a different PDU. |
Check that PDU is up and running as described in PDU Version Identification. Check your network configuration if PDU is reachable. Make sure that IP address od DNS name entered during discovery point to PDU not some different hardware and to supported PDU model as described in PDU Version Identification. |
|
Cannot login to #PDU: pdu.example.com. Wrong credentials. Please provide correct PDU user name and password in Enterprise Manager and try to repeat action (metric collection, connection test) |
Check that you provided correct HTTP credentials during PDU discovery. If incident with this message was raised, PDU HTTP credentials were probably changed in the PDU Management Interface. You have to change them in the Enterprise Manager as well. HTTP credentials change is described in Change the HTTP Credentials. |
|
Cannot login to #PDU: pdu.example.com. Another user is already logged in. Cannot proceed till another user is logged out. Ask another user to logout or wait until user is logged out automatically (approximately 30 minutes) and try to repeat action (metric collection, connection test). |
Another user is logged in to the PDU Management Interface. If the user who is logged in is you, go to the PDU Management Interface (see Discovering and Promoting PDUs) and click Logout button. If the user logged in is someone else, you have to wait for automatic logout for approximately 30 minutes. |
|
Unable to find PDU SNMP Community string for #PDU: pdu.example.com. Provide correct community string in Enterprise Manager and try to repeat action (metric collection, connection test). |
Provide correct SNMP Community string in PDU discovery and repeat discovery. If incident with this message was raised, you have to change SNMP monitoring credentials in the Enterprise Manager. SNMP credentials change is described in Changing the SNMP Credentials. |
|
SNMP version 3 is not supported for #PDU: pdu.example.com. Provide SNMP version 1 credentials in Enterprise Manager and try to repeat action (metric collection, connection test). |
SNMP V3 credentials are not supported, you have to provide SNMP V1 credentials Provide correct SNMP Community string in PDU discovery and repeat discovery. If incident with this message was raised, you have to change SNMP monitoring credentials in the Enterprise Manager. SNMP credentials change is described in Changing the SNMP Credentials. |
|
Cannot write monitoring EM Agent host IP address to the NMS IPs-Communities table of #PDU: pdu.example.com using PDU web interface. There is already entry with desired agent IP address 192.0.2.100 but with different community string. Remove this entry from table manually using the PDU web interface or change it to have correct community string (Open address https://pdu.example.com in web browser, go to Net Configuration section, login, see NMS IPs-Communities table) or provide correct community string in Enterprise Manager and repeat action (SNMP config metric collection, connection test). |
Make sure you entered correct SNMP community string during PDU discovery. Check if NMS table is correct and SNMP Community string was not changed as described in Verify PDU v1 NMS Table and Trap Hosts Setup Table and Verify PDU v2 NMS Table and Trap Hosts Setup Table. If incident with this message was raised, you have to change SNMP monitoring credentials in the Enterprise Manager. SNMP credentials change is described in Changing the SNMP Credentials. |
|
Cannot write monitoring EM Agent host IP address to the Trap Hosts Setup IPs-Communities table of #PDU: pdu.example.com using PDU web interface. There is already entry with desired agent IP address 192.0.2.100 but with different community string. Remove this entry from table manually using the PDU web interface or change it to have correct community string (Open address https://pdu.example.com in web browser, go to Net Configuration section, login, see Trap Hosts Setup IPs-Communities table) or provide correct community string in Enterprise Manager and repeat action (SNMP config metric collection, connection test). |
Make sure you entered correct SNMP community string during PDU discovery. Check if Trap Hosts Setup table is correct and SNMP Community string was not changed as described in Verify PDU v1 NMS Table and Trap Hosts Setup Table and Verify PDU v2 NMS Table and Trap Hosts Setup Table. If incident with this message was raised, you have to change SNMP monitoring credentials in the Enterprise Manager. SNMP credentials change is described in Changing the SNMP Credentials. |
|
Cannot write monitoring EM Agent host IP address to the NMS IPs-Communities table of #PDU: pdu.example.com using PDU web interface. Table is full. Remove some entries from table manually using the PDU web interface (Open address https://pdu.example.com in web browser, go to Net Configuration section, login, see NMS IPs-Communities table) and repeat action (SNMP config metric collection, connection test). |
Check that there is an empty slot in the NMS table as described in chapters Verify PDU v1 NMS Table and Trap Hosts Setup Table and Verify PDU v2 NMS Table and Trap Hosts Setup Table. |
|
Cannot write monitoring EM Agent host IP address to the Trap Hosts Setup IPs-Communities table of #PDU: pdu.example.com using PDU web interface. Table is full. Remove some entries from table manually using the PDU web interface (Open address https://pdu.example.com in web browser, go to Net Configuration section, login, see Trap Hosts Setup IPs-Communities table) and repeat action (SNMP config metric collection, connection test). |
Check that there is an empty slot in the Trap Hosts Setup table as described in Verify PDU v1 NMS Table and Trap Hosts Setup Table and Verify PDU v2 NMS Table and Trap Hosts Setup Table. |
|
Exception during lookup for IP address of network interface on EM Agent host through which is #PDU: pdu.example.com with address #PDU: pdu.example.com reachable. PDU is not reachable from Agent host. Exception during lookup for IP addresses of network interfaces on EM Agent host through which #PDU: pdu.example.com could be reachable. #PDU: pdu.example.com with address 203.0.113.200 is not reachable through any network interface on EM Agent host. Select another agent or try to resolve issues causing that PDU is not reachable. |
Check that PDU is up and running as described in PDU Version Identification. Check your network configuration if PDU is reachable. |
|
#PDU: pdu.example.com: Problem description. You probably tried to access unsupported PDU hardware not a supported PDU. |
Check that PDU is up and running as described in PDU Version Identification. Check your network configuration if PDU is reachable. Make sure that IP address od DNS name entered during discovery point to PDU not some different hardware and to supported PDU model as described in PDU Version Identification. |
|
Unsupported model of #PDU: pdu.example.com. Only PDU with maximum count of 4 modules is supported. Detected count of modules: 5 |
Check that PDU is up and running as described in PDU Version Identification. Check your network configuration if PDU is reachable. Make sure that IP address od DNS name entered during discovery point to PDU not some different hardware and to supported PDU model as described in PDU Version Identification. |
|
PDU does not respond. It is overloaded or offline. Cannot get/find something. Check if PDU is online (Open address https://pdu.example.com in web browser) and try to repeat action (metric collection, connection test). |
Check that PDU is up and running as described in chapter PDU Version Identification. Check your network configuration if PDU is reachable. Make sure that IP address od DNS name entered during discovery point to PDU not some different hardware and to supported PDU model as described in PDU Version Identification. |
35.9 PDU Alerts and Configuration
PDU and Enterprise Manager can be configured to report two kinds of incidents to the user:
-
If current level of a phase of some module in amperes crossed some set warning or alarm threshold.
-
If difference between current level in ampere of phases of PDU module is bigger than the set threshold.
You can set warning and alarm thresholds in both PDU and Enterprise Manager. These settings are independent on each other. Incidents are generated independently from warning and alarm thresholds set in PDU and in Enterprise Manager.
35.9.1 Configuring Alerts in a Legacy PDU
Perform the following steps to configure alarm and warning thresholds in a legacy PDU Management Interface:
-
Open the PDU Management Interface in the web browser (See PDU Version Identification).
-
In the PDU User Interface, click Param Configuration.
-
Login with your user name and password.
-
Set alarm and warning current thresholds in amperes for Input 0, then click Submit.
Note:
Info low is not used for PDU monitoring in Enterprise Manager. -
Repeat the above steps for all modules.
35.9.2 Configuring Alerts in Enterprise Manager
Perform the following steps to configure alarm and warning thresholds in Enterprise Manager.
-
Open PDU landing page as described in Physical View of the PDU.
-
Click the Target Menu Systems Infrastructure PDU.
-
Under Systems Infrastructure PDU, select Monitoring, then click Metric and Collection Settings.
Figure 35-10 Metric and Collection Settings
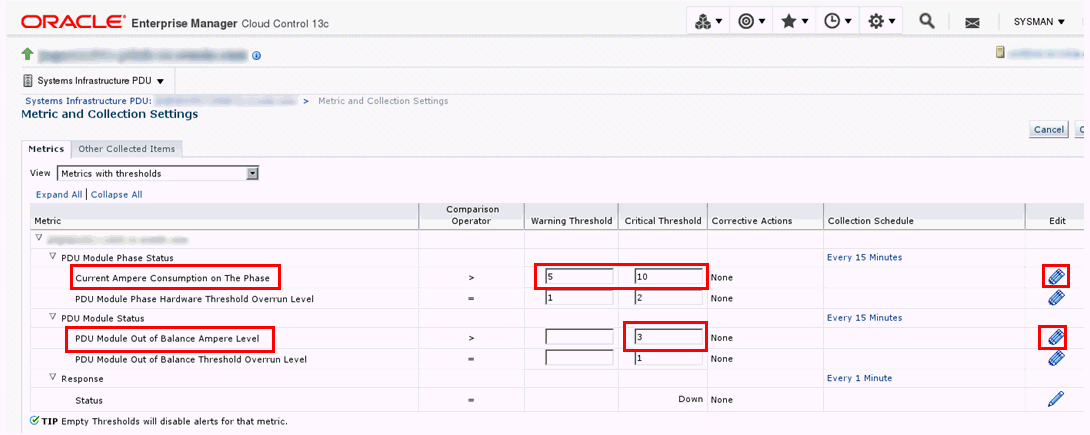
Description of ''Figure 35-10 Metric and Collection Settings''
-
In the table, click the Edit icon against Current Ampere Consumption on the Phase and edit the values of Warning Threshold and Critical Threshold.
-
Click the Edit icon against PDU Module out of Balance Ampere Level and edit the value of Critical Threshold.
Note:
Do not change Warning Threshold and Critical Threshold for PDU Module Phase Hardware Threshold Overrun Level and PDU Module out of Balance Threshold Overrun Level. It those values are changed, incidents will not to be generated based on alarm and warning levels set directly in the PDU or they will be generated incorrectly.If values were already changed, set PDU Module Phase Hardware Threshold Overrun Level Warning Threshold to 1, Critical Threshold to 2, and PDU Module out of Balance Threshold Overrun Level Critical Threshold to 1.
-
Click OK.
35.9.3 Viewing Alert Incidents
To view incidents generated from alarm and warning threshold and identify the incident, click Open Incidents dashlet to view a summary of all the incidents on the PDU. Click a specific incident to view incident details.
-
For example, any incident generated from alarm and warning thresholds set directly in PDU contains the following text:
PDU Module 0, Phase 1 crossed the Module Phase Ampere Level alarm or warning threshold set in PDU Web interface on Parameter page. Module Phase Ampere Level was 2.4 A.
-
For example, any incident generated from alarm and warning thresholds set in the Enterprise Manager contains the following text:
PDU Module 1, Phase 1 crossed the Module Phase Ampere Level alarm 2 A or warning 1 A threshold set by user in monitoring template. Module Phase Ampere Level was 3.2 A.
Incidents are automatically cleared when current level goes under the set alarm and warning levels.
35.10 Related Resources for PDU Management
See the following for more information:
