28 Administering and Monitoring a PaaS Cloud
This chapter describes the different options that are available to monitor the DBaaS and MWaaS services. It contains the following sections:
28.1 Viewing the Cloud Home Page
After the cloud services have been set up, and one or more self service users have submitted requests, you can view a unified view of the different service types on the Cloud Home page. You can use the rolled up data to identify problem areas and drill down for more details. From the Enterprise menu, select Cloud, then select Cloud Home to navigate to this page.
Note:
-
To view this page, you must have View privilege on the Cloud target. Out-of-the-box user roles have this privilege by default.
-
You can use the Personalize option to customize the Cloud Home page. This option allows you to add or delete regions, change the page layout, and so on.
-
General: This region shows the following:
-
Resource Providers: The total number of PaaS Infrastructure zones and software pools that have been created is displayed. Click on the link to drill down to the Resource Providers page.
-
Service Templates: The total number of service templates that have been defined.
-
Total Requests: The total number of requests for configured cloud services. Click on the link to drill down to the All Requests page.
-
Service Instances: The total number of members that are up or down. Click on the link to drill down to the Service Instances page.
-
-
Request Status: The status of service requests during a specific period. By default, the request status over the last 24 hours is displayed but you can select another duration such as 7 days, 30 days, and so on. You can view the request status for all requests or for a specific service type. To view the status for a specific service type, select type from the View drop down list.
-
Issues: The availability, performance, security, and other incidents across all the configured service providers.
-
Top Resource Provider Utilization: This region shows the Top level resource utilization for the configured resource providers. For example, the CPU and Memory Utilization for a PaaS Infrastructure Zone. To view more details, click the View Map link at the top of the region. This displays the Heat Map page with detailed information on the resource provider utilization. The number of resource providers and the threshold value to calculate color can be configured by using the Personalization feature.
-
Daily Charge for the Last 30 Days: Shows rolled up chargeback data across all service types.
-
Top Requested Services: This region lists the most requested service templates. You can see service utilization trend by user or service template for a selected period which can be 24 hours, 7 days, or 30 days.
The following options are available from the Cloud Home menu.
Note:
The following pages can be accessed only by users with theEM_SSA_ADMINISTRATOR role. To modify these pages, the users must have Manage privilege on the corresponding services and families. Out-of-the-box administrators have this privilege by default.-
Resource Providers: You can see the list of resource providers for which you have at least View Target Privilege. You can create a new resource provider, edit, or delete an existing resource provider. See Resource Providers Page.
Note: To create a new service provider, you must have Create Target Privilege on that resource provider target type.
-
Service Templates: Use this option to the Service Templates page from where you can create, edit, and delete service templates across different service families. See Service Templates Page for details.
-
Services Instances: Shows a list of service instances. See Service Instances Page for details.
-
Requests: Use this option to view all the requests, or view a summary in the Request Dashboard page.
-
Setup: The Setup menu allows you to define global settings across the different service types. The following options are available:
-
Getting Started: The Getting Started page lists the minimum tasks that are required to configure a service type and the order in which these tasks must be completed. This page is useful to self service administrators who are not familiar with the product.
-
Service Settings: Allows you to specify service specific settings such as Load Balancer Settings for MWaaS.
-
Request Settings: Allow you to specify request settings at many different levels (from all services to a specific service type). See Configuring Request Settings.
-
Quotas: Allows you to define quota for each service family. See Setting Up Quotas.
-
Data Sources: Used to launch the Create Profile and Create Test Master wizards if required by the service type.
-
28.1.1 Viewing the Resource Provider Utilization Heat Map
From the Enterprise menu, select Cloud, then select Cloud Home. On the Cloud Home page, click the View Map link in the Top Resource Provider Utilization% region to view the Resource Provider Utilization Heat Map.
This page shows the utilization metrics for all resource providers such as PaaS Infrastructure Zones, Database Pools, and Middleware Pools. The heat map provides a graphical representation of the resource provider utilization. On the Heat Map view, metrics are represented as boxes and the size and color of each box depicts potential problem areas. Select a box and click on a metric value to navigate to the Metric History page.
28.2 Viewing the List of Resource Providers
A resource provider is an entity that contains the actual resources required to provision the cloud services of a specific service type. From the Enterprise menu, select Cloud, then select Cloud Home to navigate to the Cloud Home page. From the Cloud Home menu, select Resource Providers to see a list of resource providers.
-
Name: The name of the resource provider.
-
Type: The type of resource provider. This can be:
-
PaaS Infrastructure Zone
-
Middleware Pool
-
Database Pool
-
Schema Pool
-
Pluggable Database Pool
-
-
Owner: The user who created the resource provider.
-
Parent: If the resource provider has a parent, it is listed here. For example, a PaaS Infrastructure Zone is the parent for a middleware or database pool.
-
Members: The members associated with the resource provider (this includes member type and number of members).
-
Service Instances: The service instance associated with the resource provider. Click on the link to drill down to the Home page.
-
Description: A description of the resource provider specified by the administrator while creating the resource provider.
You can create a resource provider, edit an existing one, or delete a resource provider.
28.3 Viewing the List of Service Templates
From the Enterprise menu, select Cloud, then select Cloud Home. From the Oracle Cloud menu, select Service Templates to view this page.
This page shows a list of all the service templates that are available to the self service administrator across the different service families. For each service template, the following details are displayed:
-
Name of the service template
-
The service family to which belongs (for example, Database, Middleware, and so on).
-
The type of service.
-
The owner of the service.
-
The resource providers associated with the service template.
-
The number of service instances associated with the service template.
-
A description of the service template.
You can perform the following actions:
-
Create: Select this option to launch the Create Service Template wizard.
-
Create Like: Select this option to create a copy of an existing service template.
-
Edit: Select a service template and click Edit to modify an existing template. Click Submit after modifying the template to update the template.
-
Delete: Select a service template and click Delete to delete the template.
-
Grant and Revoke Privileges: The
EM_SSA_ADMINISTRATORcan grant or revoke service template privileges to other users with theEM_SSA_ADMINISTRATORrole.
28.3.1 Granting, Revoking, and Reassigning Service Template Privileges
The owner (the self service administrator who has created the template, or the SUPER_USER can grant or revoke privileges over a service template to one or more users or roles. Only the SUPER_USER can grant or revoke privileges over all service templates to other users and roles.
-
Grant Privileges: Select the service template for which privileges are to be granted and select Grant from the Actions menu.
To grant privileges to other users, select User in the Type drop down list and click Search. A list of users to whom the privileges can be granted is displayed. Select one or more users from the list and click Grant to grant the privilege.
In the Select Privilege to Grant drop down list, select Manage or Full to grant the privilege to the user. To allow users to edit, and modify the configuration in the service template, select Manage access. To allow users to edit, delete, and modify the service template, select Full access.
To grant privileges to one or more user roles, select Role in the Type drop down list and click Search. A list of roles to whom the privileges can be granted is displayed. Select one or more roles from the list and click Grant to grant the privilege.
-
Revoke: Select a service template for which privileges have been granted and click Revoke. In the Search drop down list, you can select one of the following:
-
Name: The name of the user to whom the privilege has been granted.
-
Type: Select the type which can either be User or Role to whom the privilege has been granted.
-
Privilege: The type of privilege that has been granted which can be View, Manage, or Full.
Based on the search criteria, the list of users or roles to whom the privileges have been granted is displayed. Select the users or roles for whom the privileges are to be revoked and click Revoke.
-
-
Reassigning a Service Template: Login as a Super Administrator user, select the template and click Reassign to reassign the ownership of the service template to another user. Select the user and click Reassign to reassign the service template.
28.4 Viewing the List of Service Instances
The Service Instance page shows the list of all service instances. From the Enterprise menu, select Cloud, then select Cloud Home. From the Oracle Cloud menu, select Service Instances to view this page.
The following details are displayed:
-
Service Instance Name: The name associated with the service instance. Click on the link to drill down to the target home page.
-
Status: The status of the service instance.
-
Service Instance Type: The type of request (Middleware or Database).
-
Resource Provider: The Resource Provider with which the instance is associated.
-
Service Template: The service template that was used to create the service instance.
-
Policies: The number of policies associated with the service instance. Click on the link to drill down to the Policies page.
-
Created By: The user who created this service instance.
-
Creation Date: The date on which the service was created.
-
Expiry Date: The date on which the service will expire and no longer be available.
You can perform the following actions:
Note:
You must have Manage privilege on the service types on which these operations are to be performed. This privilege is assigned to the out-of-the-box self service administrators roles by default.-
Start: Select a service instance that has been stopped and click Start to start the service.
-
Stop: Select a service that is running and click Stop to stop the service.
-
Delete: Select a service and click Delete. You are prompted to specify the schedule and indicate whether the service instance is to be deleted immediately or at a later date. Select the schedule and click OK to delete the request.
-
History: Select a service and click History to view a list of all actions that have been performed on the service instance.
-
Grant, Revoke, and Reassign Privileges: See Granting, Revoking and Reassigning Privileges to Service Instances.
28.4.1 Granting, Revoking, and Reassigning Privileges to Service Instances
The self service administrator can grant or revoke privileges over a service instance to one or more users or roles. Self service users can also grant or revoke privileges over service instances they own. The user who created the service instance (owner) or the SUPER_USER can reassign the ownership of a service instance to another user.
To grant or revoke access to a service instance, the self service administrator must select Enterprise > Cloud Home > Setup > Request Settings and enable the following flags:
-
Enable self service user to share service instances with other Users.
-
Enable self service user to share service instance Roles.
These settings can be defined either at global level, service family level, or at other User or Role level. See Section 11.2.2.1, "Creating a PaaS Infrastructure Zone" for details.
-
Grant Privileges: Select the service instance for which privileges are to be granted and select Grant from the Actions menu.
To grant privileges to other users, select User in the Type drop down list and click Search. A list of users to whom the privileges can be granted is displayed. Select one or more users from the list and click Grant to grant the privilege.
In the Select Privilege to Grant drop down list, select View, Manage, or Full to grant the privilege to the user. To allow users to edit, and modify the configuration in the service instance, select Manage access. To allow users to edit, delete, and modify the service instance, select Full access. To provide users with read only access, select View access.
To grant privileges to one or more user roles, select Role in the Type drop down list and click Search. A list of roles to whom the privileges can be granted is displayed. Select one or more roles from the list and click Grant to grant the privilege.
-
Revoke: Select a service instance for which privileges have been granted and click Revoke. In the Search drop down list, you can select one of the following:
-
Name: The name of the user to whom the privilege has been granted.
-
Type: Select the type which can either be User or Role to whom the privilege has been granted.
-
Privilege: The type of privilege that has been granted which can be View, Manage, or Full.
Based on the search criteria, the list of users or roles to whom the privileges have been granted is displayed. Select the users or roles for whom the privileges are to be revoked and click Revoke.
-
-
Reassigning a Service Instance: Login as a Super Administrator user, select the instance and click Reassign to reassign the ownership of the service instance to another user. Select the user and click Reassign to reassign the service instance.
28.5 Viewing the Cloud Request Dashboard
The self service administrator can use the Cloud Request Dashboard to track the status of all database and middleware requests. The self service administrator can view the requests across all resource providers for all users. The requests the self service administrator can view depends on the instance level privileges. All trends and graphs on this page apply to the current filter and time period specified. By default, the status across all services over the last 7 days is displayed.
From the Enterprise menu, select Cloud, then select Cloud Home. From the Oracle Cloud menu, select Requests, then select Dashboard to view the cloud request dashboard.
The following charts are displayed:
-
Request Trends: You can view recent trends for Failed, Successful, Average Wait Time, Average Processing Time and Scheduled requests. Trends are shown across two time periods (for example, previous week, current week). Click the drop down list in the Completed Requests chart to filter and view failed, successful, partially successful, or completed requests.
-
Average Request Wait Time: The elapsed time from which a request is scheduled to start and its actual start time.
-
Average Request Processing Time (Zone): The average time taken to process the request for the selected criteria. For example, if a specific service template is selected as the filter criteria, then the average time taken to create the service instance from the selected service template in the specified time period (last 24 hours, last 7 days, or last 30 days) is displayed.
You can choose to filter the requests listed on the page by selecting a value in the View By drop down list and specifying the Filter value and the Type. For example, if you select Resource Provider in the View By drop down list, and All in the Filter column, and Create in the Type column, you will see the Create requests for all resource providers.
You can click the Edit (wrench icon) option to edit the layout of the Request Dashboard page. The following service settings can be modified:
-
Summary Columns: The number of columns that can be displayed in the Summary region.
-
Long Running Threshold: The percentage of average processing time used to determine if the time taken to complete a request is longer than normal.
-
Maximum Chart Items: The maximum number of resource providers, service types or service families that can be shown in each chart. The remaining items are listed in the All Others category.
-
Include Archived Requests: Select this check box to include deleted but not yet purged requests in the charts. This option is useful in providing a more accurate picture of the total number of requests processed during the time periods
-
Chart Time Period: The default view period (7 days) for the chart.
Modify the values as required and click OK. To restore the earlier settings, click Restore Defaults.
28.6 Viewing All Cloud Requests
From the Enterprise menu, select Cloud, then select Cloud Home. From the Oracle Cloud menu, select Requests, then select Show All to view a list of all cloud service requests.
For each request, the name of the request or job, status of the request, the request type (Create, Delete, and so on), the user who submitted the request, service type (database, schema, WebLogic, and so on), date on which the request was submitted, and so on is displayed. Click on the Name link to drill down to the Job Activity page. The Status link shows the Request Details popup window.
You can do the following:
-
Reschedule: Select a request that is scheduled to run at a future date and click Reschedule to change the date on which the request should be initiated.
-
Delete: Select a request and click Delete to delete the request. Deleted requests are still present in the repository and will be purged according the purge policy defined in the Request Settings page. See Section 11.2.3, "Configuring Request Settings" for details.
-
Clean Up: Use this option to clean up failed requests. This may include shutting down any partially configured services and deleting any partially configured storage used for the failed service.
Note: Failed provisioning requests cannot be deleted unless they have been cleaned up.
28.7 Viewing the PaaS Infrastructure Zone Home Page
A zone is a logical entity that allows homogenous resources to be grouped together. The resources consist of components (servers, storage, networks, operating systems, applications) that are required to create new services. From the Enterprise menu, select Cloud, then select Cloud Home. Click on a resource provider link on the Cloud Home page to navigate to the Resource Providers page and click on the PaaS Infrastructure Zone link to drill down to the PaaS Infrastructure Zone Home page.
The PaaS Infrastructure Zone Home page contains the following regions:
-
General: This region lists the total number of Hosts, Dependent Providers (Software Pool), Requests, and Service Instances in the zone. It also shows the Placement Policy Constraints that have been defined for the zone.
-
Request Summary: Shows the percentage of requests that are in progress, failed, successful, partially successful, or scheduled.
-
CPU and Memory: The average CPU and memory utilizations by Hosts in the zone is displayed in these charts.
Note:
You can set the thresholds for these metrics on the All Metrics page. To navigate to this page, from the PaaS Infrastructure Zone menu, select Monitoring, then select All Metrics. Select the metric for which the threshold is to be set, click Modify and change the settings. -
Issues: Shows the outstanding incidents and problems for the target.
-
Members: Shows the members of the zones and the member type (Oracle VM Zone or Host).
-
Hosts: Lists the hosts in the PaaS Infrastructure Zone. Click on the Utilization link to view details on the CPU and memory has been utilized for all the hosts, and the number of service instances created on the host. Click on the Name link to drill down to the Host Home page.
-
Service Template Summary: Shows the service templates associated with the zone. The software pool associated with each service template and number of service instances in each resource pool is also displayed.
28.8 Viewing the Database Pool Home Page
A database pool contains a set of resources that can be used to provision a database instance within a PaaS Infrastructure Zone.
This page contains the following regions:
-
General: This region displays the following:
-
Summary: Displays a description of the database pool and PaaS Infrastructure Zone to which it belongs.
-
Members and Databases: Shows the list of Members (Oracle Homes and Hosts) and Databases in the pool. The Databases region lists the total number of databases and the number of single instance or RAC databases in the pool.
-
Placement Policy Constraints: The placement policy constraints that specify maximum ceilings for each host member of the pool are displayed.
-
-
Standby Pools: If one or more standby pools are present, they are listed here.
-
Top Utilized Hosts: This region shows the list of top utilized hosts over the last 7 days. Click on the link to drill down to the Host Home page. You can sort by:
-
Memory: The average memory utilized over the last 7 days as a percentage of the total memory on the host.
-
CPU: The average CPU utilized over the last 7 days as a percentage of the CPU available on the host.
-
Storage: The average storage utilized over the last 7 days as a percentage of the total storage available on the host.
-
Instances: The number of database instances on the host.
-
-
Members: Lists all the members in the database pool. Click on the links in the Members table to drill down to the Database or Host Home page.
-
Overview of Incidents and Problems: This region lists any incidents or problems that have occurred.
-
Memory Utilization: The chart shows the memory utilization by different hosts present in the database pool. The color coded chart shows the different memory utilization range across the different hosts.
-
CPU Utilization: The chart shows the CPU utilization by different hosts present in the database pool. The color coded chart shows the different CPU utilization range across the different hosts.
-
Storage Utilization: The chart shows the storage utilization by different hosts present in the database pool. The color coded chart shows the different storage utilization range across the different hosts.
-
Service Template and Instances: Shows the service templates and service instances associated with the database pool.
28.9 Viewing the Schema Pool Home Page
You can define one or more schemas that can be deployed on a database.
-
General: This region displays the following:
-
Summary: Displays a description of the schema pool and PaaS Infrastructure Zone to which it belongs. I
-
Members and Services: Shows the list of Members (Databases and Hosts) and Services in the pool.
-
Placement Policy Constraints: The placement policy constraints that specify maximum ceilings for each database member in the pool are displayed.
-
-
Top Allocated Databases: This region shows the list of top utilized databases in the schema pool. Click on the link to drill down to the Database Instance page.
-
Memory: The total memory allocated for each service based on the workload as a percentage of the total SGA size of the database.
-
CPU: The total CPU allocated for each service based on the workload as a percentage of the CPU count.
-
Storage: The total storage utilized on all the tablespaces of the database as a percentage of the total size of the database.
Note:
Total here includes requests budgeted for services that have been requested and are active. -
Services: The number of database services.
-
-
Members: Lists all the members in the schema pool. Click on the links in the Members table to drill down to the Database Instance Home page.
-
Overview of Incidents and Problems: This region lists any incidents or problems that have occurred.
-
Memory Allocation: The chart shows the memory allocation across different databases present in the schema pool. The color coded chart shows the memory allocation range across all the databases.
-
CPU Allocation: The chart shows the CPU allocation across different databases present in the schema pool. The color coded chart shows the CPU allocation range across all the databases.
-
Storage Allocation: The chart shows the storage allocation across different databases present in the schema pool. The color coded chart shows the storage allocation range across all the databases.
-
Service Template and Instances: Shows the service templates and service instances associated with the schema pool.
28.10 Viewing the Pluggable Database Pool Home Page
A PDB pool contains one or more container databases that can be used to create PDBs within a PaaS Infrastructure Zone.
This page contains the following regions:
-
General: This region contains the following:
-
Summary: This region displays a description of the database pool and PaaS Infrastructure Zone to which it belongs. Click on the Parent PaaS Infrastructure Zone link to drill to the Home page.
-
Members and Databases: This region displays a list of Members (Oracle Homes and Hosts) and Databases in the pool. The Databases region lists the total number of databases and the number of single instance or RAC databases in the pool.
-
Placement Policy Constraints: The placement policy constraints that specify maximum ceilings for the pool are displayed.
-
-
Top Allocated Databases: This region shows 5 to 15 pluggable databases (depending on your selection), sorted by Memory, CPU, Storage, or Services.
-
Memory: The total memory allocated for each service based on the workload as a percentage of the total SGA size of the Container database.
-
CPU: The total CPU allocated for each service based on the workload as a percentage of the total CPU count.
-
Services: The number of database services.
-
-
Members: This region shows the list of members in the PDB pool. Click on the links in the Members table to drill down to the database or host home page.
-
Overview of Incidents and Problems: This region shows a list of any incidents and problems that have occurred for any of the targets in the PDB pool.
-
Memory Allocation: This chart shows the memory allocation by different container databases in the database pool. The color coded chart shows the memory allocation range across all the container databases.
Note:
Total here includes requests budgeted for services that have been requested and are active. -
CPU Allocation: This chart shows the CPU allocation by different container databases in the pool. The color coded chart shows the CPU allocation range across all the container databases.
-
Service Templates and Instances: This region shows the list of service templates associated with the PDB pool. Click on the Service Template link to drill down to the Service Template Details page.
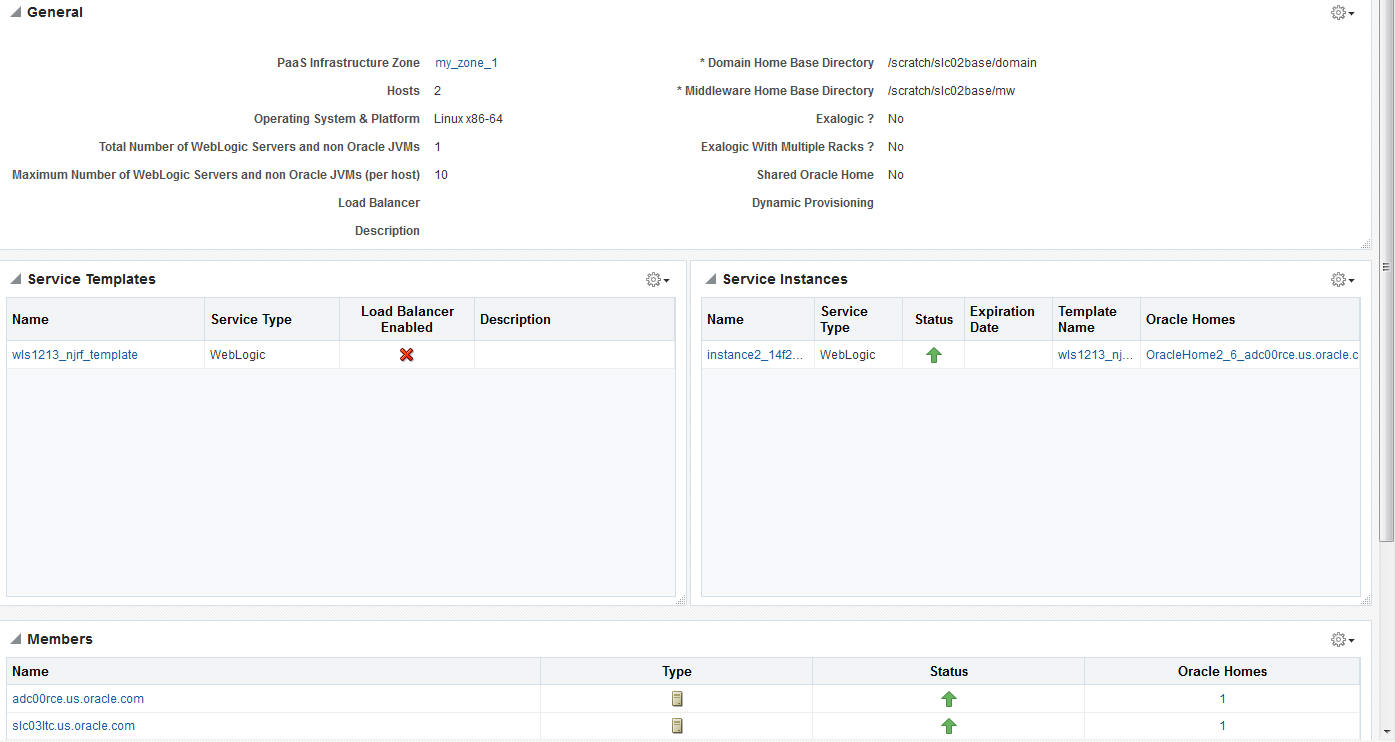
28.11 Viewing the Middleware Pool Home Page
The Middleware Pool Home page provides detailed information of the Middleware Pool. To view this page, from the Enterprise menu, select Cloud, then select Cloud Home. Click on the Resource Providers link on the Cloud Home page to navigate to the Resource Providers page. Click on a Middleware Pool name to drill down to the Middleware Pool Home page. The Middleware Pool Home page contains the following regions:
-
General: This region shows the following information:
-
Parent PaaS Infrastructure Zone: The zone with which the Middleware Pool is associated. Click on the link to drill down to the PaaS Infrastructure Zone Home page.
-
Oracle Homes: The total number of Oracle Homes in the Middleware Pool.
-
Oracle Home Version: The version of the Oracle homes.
-
-
Placement Policy Constraints:
-
Total Java Servers (per host): The maximum number of WebLogic servers that can be running on each host.
-
Java Servers: The total number of WebLogic servers in the Middleware Pool.
-
-
Load Balancer: This region shows the following details:
-
Load Balancer Configuration: The name of the load balancer configuration associated with the Middleware Pool. Click on the link to view the load balancer details.
-
Load Balancer Type: The type of load balancer. This can be Oracle HTTP Server, Oracle Traffic Director, or Third Party Load Balancer.
-
-
Service Templates: The number of service templates with which the Middleware Pool is associated. For each service template, the name, a column indicating if the load balancer configuration has been enabled, and the description of the template is displayed. You can drill down to detailed page to see which MWaaS instances are associated with each service template.
-
Service Instances: The service instances running on the Middleware Pool are displayed. For each service instance, the name, the status, date on which it is scheduled to expire, the service template with which is associated, and the location of the Oracle Home is displayed.
-
Members: This region shows a list of members in the Middleware Pool. The name of the target, the target type, the host on which it is running, and the location of the Oracle Home is displayed.
28.12 Viewing the Cloud Services Reports
Oracle BI Publisher is an Oracle's enterprise reporting solution and provides a single reporting environment to author, manage, and deliver all of your reports and business documents. Utilizing a set of familiar desktop tools, such as Microsoft Word, Microsoft Excel, or Adobe Acrobat, you can create and maintain report layouts based on data from diverse sources. The Cloud Services BI reports consist of the following:
-
Most Requested Service Types
-
Service Request Status
-
Service Request Types
-
Cloud Requested Duration Thread
You can view these reports online and export them PDF, RTF, PowerPoint, and Excel formats. To view the reports, log into Enterprise Manager as a user with the EM_CLOUD_ADMINISTRATOR role and from the Enterprise menu, select Reports, then select BI Publisher Reports. Click on a report under the Cloud Services menu to launch the BI Publisher application and directly view the report.
28.12.1 Most Requested Service Types
This report shows the most requested reports sorted by service type. You can filter the data displayed by selecting any of the following parameters:
-
Service Family
-
Service Type
-
User Name
-
Start Date
-
End Date
28.12.2 Service Request Status
This report shows the service request trends sorted by status. You can filter the data displayed by selecting any of the following parameters:
-
Service Family
-
Service Type
-
Request Type
-
Request Status
-
User Name
-
Start Date
-
End Date