13 Monitoring Performance
This section describes the issues and tasks involved in monitoring the performance of distributed applications.
Service-oriented, distributed applications, which are characterized by modular development and dynamic binding, have a critical need for a single point of management from where one can monitor the behavior of the application as a whole, identify actual or potential problems, and take corrective action.
This chapter includes the following sections:
To monitor the performance of distributed applications, you must be able to do the following.
-
Examine the user experience to assess the quality of service rendered and to understand use patterns.
-
Discover the components that make up the application, identify request flows of interest, and determine where performance issues or errors occur in the flow.
-
Find the root cause of poor performance and failure by looking at the infrastructure supporting the logical application, or by obtaining more detailed information.
Used together, the products described in this guide offer the functionality described above. You do not need to use all these to learn about your application's performance. For example, you could start by monitoring the end-user experience and then later, add transaction monitoring. The next section describes the different monitoring options that are available to you.
13.1 Monitoring Views and Dimensions
End-to-end performance monitoring requires multiple views and dimensions:
-
A complete view of the topology of the logical application, including routing schemes and database access
-
A complete view of the underlying infrastructure
-
Varying detail about the distributed application components used
-
For web-based applications, the ability to access html source for the web pages visited by users
-
Access to machine-level execution detail for application components running in a Java Virtual Machine
-
The ability to go from the logical to the physical view of the application
RUEI, JVMD, BTM, and Enterprise Manager provide the functionality required for end-to-end performance monitoring. As mentioned before, you do not need to install and configure all of these. You can use the piece that addresses your most immediate concerns and add more later.
-
Real User Experience Insight (RUEI)
Helps you identify problems with user interfaces, evaluate the quality of service offered, and understand and anticipate use patterns. With Enterprise Manager 13c registering a RUEI system automatically creates End User Services (EUS) corresponding to each RUEI Application/Suite. The EUS has the same name as the RUEI Application/Suite, and can be used to create a business application (See business application below)
-
Java Virtual Machine Diagnostics (JVMD), Enterprise Manager
Provides a server-level view of the request flow and of the internal workings of the application execution environment for those services that execute in a Java Virtual Machine. JVMD uses an execution context ID (ECID) to allow you correlate events. Fusion Middleware injects an ECID that can be used to track transaction operations (messages). With Enterprise Manager 13c, JVMD can set an ECID in the datastream if an ECID is not already present. This makes JVMD more useful in environments that are use middleware from suppliers other than Oracle.
-
Selenium beacons, Enterprise Manager
Selenium is a framework for testing web applications. You can use it to create tests that are integrated into Enterprise Manager as a Generic Service - Test Based. See the Enterprise Manager Cloud Control Administrator's Guide for more information on creating service tests and the online help for details about the Selenium Transaction test type.
-
Business Application, Enterprise Manager
Allows you to define Business Applications, in which context you van view and analyze RUEI and BTM information, and to access more detailed monitoring information.
With Enterprise Manager 13c, there is a new service level target, called an End User Service (EUS) automatically created, corresponding to each RUEI Application/Suite. If your goal is to monitor a single End User Service (RUEI Application Suite), then you may not need to create a Business Application. However Business Applications allow you to combine various targets (for example, multiple End User Services or a combination of BTM, system and EUS targets).
-
Business Transaction Management (BTM)
Discovers the components that make up your application and allows you to define transactions, which include operations that are of special interest. You can follow the work your application does as it crosses servers (tiers of execution) and also see the topology of your distributed application. BTM is most useful where a JVM does not interaction with the database or in an environment with complex webservice interactions (otherwise JVMD, Selenium and/or RUEI may be sufficient to monitor the environment).
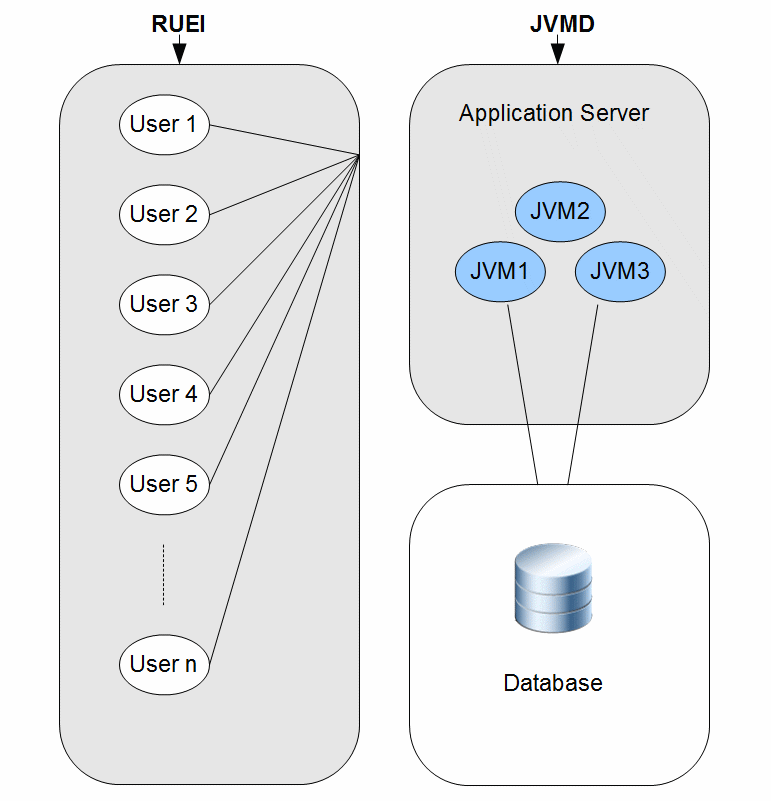
Figure 13-1 illustrates a simple application configuration where:
-
RUEI monitors the actions of web users and can create reports, segmented in a variety of ways, that tell you who has requested a page, what pages were requested, which servers were affected, what the response time was, and what the throughput rate is for a given session or user flow.
-
JVMD provides insight into code running in each JVM, allowing for real-time and historical diagnostics on your Java applications.
Note:
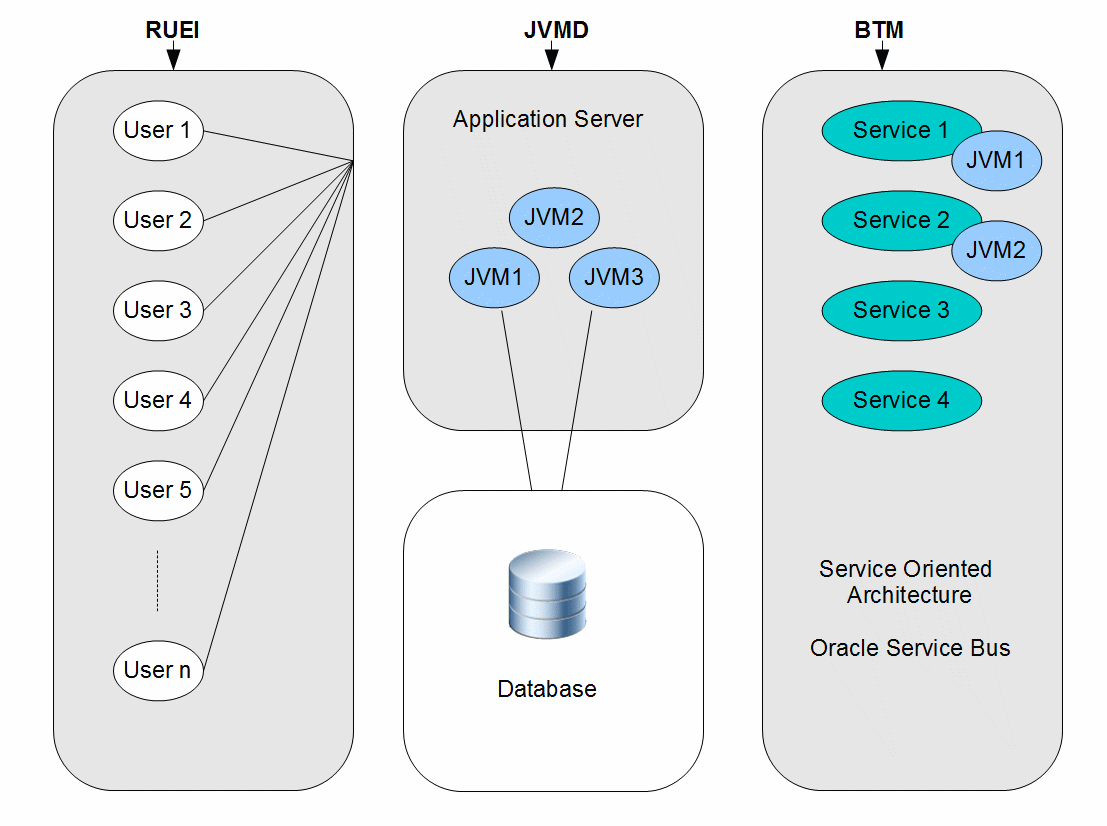
This release of Enterprise Manager automatically adds an ECID header for Java applications that do not automatically provide an ECID. You can now perform tracing and diagnostics that were previously only available to Oracle Fusion Middleware components as described in Section 13.2.1, "ECIDs for Components Other Than Oracle Fusion Middleware Components."Figure 13-2 a more complex application configuration where BTM allows us to discover back-end application components and to define and monitor the request flows (transactions) that are critical to our understanding of application performance. For a given time period, we can determine the number of started and completed transactions, the throughput, and the average and maximum response times.In the example shown in Figure 13-2 the back-end components are using Oracle Service Bus which provides the most value to anyone using BTM to analyze transactions. However, BTM can be used in other configurations, supporting many third party systems.
In addition to using RUEI, BTM, and JVMD to monitor end-to-end application performance, you can also use the Enterpriser Manager (EM) console to monitor Business Applications that include RUEI applications and BTM transactions. For more information see Chapter 17, "Monitoring Business Applications."
13.2 Using ECIDs to Track Requests
Because RUEI, BTM, and JVMD have a different focus and level of granularity, it helps to have some shared identifier to help us realize that we are looking at a shared process or element.
An Execution Context ID (ECID) is an identifier for tracking a request for components in the Oracle technology stack. An ECID is usually generated by the outer-most Oracle component handling the request and may be propagated to the Oracle components handling that request, potentially crossing server boundaries.
Note:
This release of Enterprise Manager automatically adds an ECID header for Java applications that do not automatically provide an ECID. You can now perform tracing and diagnostics that were previously only available to Oracle Fusion Middleware components as described in Section 13.2.1, "ECIDs for Components Other Than Oracle Fusion Middleware Components."The creation and propagation of ECIDs enable the sharing of context and of diagnostic data between components. Although ECIDs are not universally used, where they are used, they provide good support for end-to-end diagnostic work.
Several technologies generate ECIDs for message traffic; these include RMI, JAX-RPC, JAX-WS, EJB, JMS, JDBC, Servlets, and SOA. (In some cases, ECIDs are supported only when communication occurs between WebLogic servers.)
Where ECIDs are used, they can help the user determine whether they are indeed looking at the same object across execution contexts. For example, you can correlate error messages from different target components if they share the same ECID.
The components used in end-to-end performance monitoring all support the use of ECIDs.
-
RUEI displays ECIDs assigned to page objects in the history shown for a particular page.
-
If BTM observes an incoming message to have an ECID, it assigns the ECID as an intrinsic property of the message. Users can then search for messages with a particular ECID and determine, when looking at table views of operations, which operations have the same ECID. (Request and response messages for the same operation can have different ECIDs.)
-
ECIDs are also used at the lowest level to further identify threads running in the Java Virtual Machine.
-
ECIDs can also be used in the correlation of log entries for Oracle Fusion Middleware components that use the Oracle Diagnostic Logging (ODL) framework.
To have ECIDs generated by default by an HTTP server or Web Logic server, follow the instructions given in My Oracle Support Knowledge Document 1527091.1.
13.2.1 ECIDs for Components Other Than Oracle Fusion Middleware Components
This release of Enterprise Manager automatically adds an ECID header for Java applications that do not automatically provide an ECID. You can now perform tracing and diagnostics that were previously only available to Oracle Fusion Middleware components.
The Oracle Dynamic Monitoring Service (DMS) enables Oracle Fusion Middleware components to put an ECID in the X-ORACLE-DMS-ECID header of a response. If you are not using an Oracle Fusion Middleware component, JVMD creates a dummy ECID in the X-ORACLE-DMS-ECID header. This ECID serves the same purpose as the DMS-generated ECID allowing Enterprise Manager identify the request.
Note:
Generation of dummy ECIDs is performed only in environments where:-
DMS is not active
-
JVMD is installed on the application server
-
Instrumentation is enabled on the Enterprise Manager JVM target configuration page
13.3 Setting up End-to-end Monitoring
To obtain end-to-end monitoring, you must install, configure, and connect the products described in Section 13.1, "Monitoring Views and Dimensions". You might not need to deploy all these pieces at once. You can start with the piece that gives you the functionality you need and add other pieces later.
This section describes the steps required to set up end-to-end application performance monitoring for each dimension of performance monitoring. The purpose of each step is explained, and references are given to the relevant documentation. This section includes the following:
Before looking at the set-up instructions, take a moment to look over the following illustrations, which provide a topological view of the pieces that you can deploy to enable end-to-end monitoring.
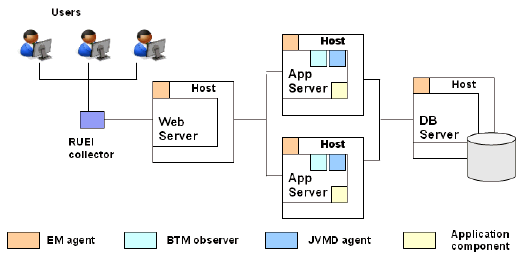
Figure 13-3 shows how the RUEI collector, EM agents, BTM observers, and JVMD agents are deployed in a monitored environment.
-
The RUEI collector must be deployed in front of the web server.
-
The EM agent must be deployed on the machine hosting the application servers and database servers used by the distributed application.
-
The BTM and JVMD agents must be deployed in the application servers where application components are deployed.
Of course, which of these you deploy, depends on the views you need. For example, if you are not interested in machine-level runtime information, you do not need to deploy the JVMD agent.
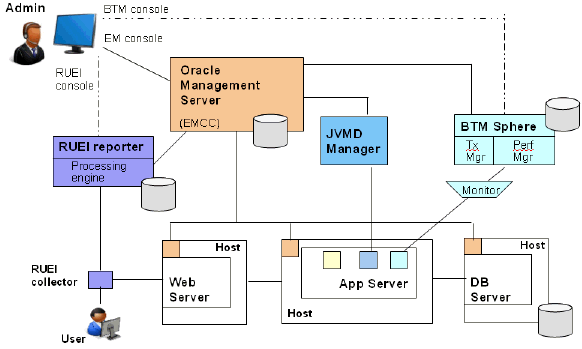
Figure 13-4 shows how RUEI, OMS, JVMD, and BTM are connected to one another and to their corresponding data collection points.
-
It shows that each processing engine connects to its respective console, which allows the administrator to create and update monitored objects.
-
It shows how RUEI, JVMD, and BTM are connected to the Oracle Management Server, which allows the sharing of data that enables the creation and monitoring of Business Applications.
A minimal user environment is shown below the administrative layer.
13.3.1 Set up Enterprise Manager
You need Enterprise Manager to create and monitor Business Applications. Enterprise Manager is also required if you want to do deep-dive diagnostics by looking at machine-level performance data. For more info on this option, see Section 13.3.2, "Set up Java Virtual Machine Diagnostics."
-
Install and configure Enterprise Manager. See Oracle Enterprise Manager Cloud Control Basic Installation Guide for more information.
-
Install an Oracle management agent on the hosts where targets and application components monitored by RUEI or BTM are running. See "Installing Oracle Management Agent" in Oracle Enterprise Manager Cloud Control Basic Installation Guide.
-
Launch Enterprise Manager and use the Enterprise Manager console to create and monitor Business Applications. See "Set up Business Transaction Management."
13.3.2 Set up Java Virtual Machine Diagnostics
To access machine-level performance data using the JVMD or RID views, you must install the JVMD manager and JVMD agents. JVMD is an integral part of Enterprise Manager, so the latter must be installed before you install JVMD.
To set up Java Virtual Machine Diagnostics:
-
Deploy the JVMD Manager (JVM Diagnostics Engine) in Enterprise Manager. You need this step to access JVM monitoring data. For information, see "Installing JVM Diagnostics" in Oracle Enterprise Manager Cloud Control Basic Installation Guide.
-
Install a JVMD agent on all nodes where targets and services monitored by RUEI and BTM are running. You need this step to collect JVM data for a given server. For information, see "Installing JVM Diagnostics" in Oracle Enterprise Manager Cloud Control Basic Installation Guide.
13.3.3 Set up Real User Experience Insight
To obtain information about the user experience, you must install and configure RUEI, and then register it with Enterprise Manager.
-
Install and configure RUEI. This step includes the following:
-
Install collectors, processor, and reporter in the monitored environment.
-
Install the reporter database.
-
Configure the RUEI reporter.
Configuration teaches RUEI to identify users, to specify the collection of pages that make up an application, to specify the scope of monitoring, to configure mail notification, and to provide security options. It is also at this time that you set up a connection to the Oracle Enterprise Manager. For information, see Oracle Real User Experience Insight Installation Guide from the appropriate RUEI documentation library:
http://www.oracle.com/technetwork/documentation/realuserei-091455.html -
-
Register RUEI with Enterprise Manager. Specify the port where the Reporter system can be accessed and provide access credentials. You need this step to establish communication between RUEI and EM. For information, see Chapter 17, "Monitoring Business Applications."
13.3.4 Set up Business Transaction Management
To discover your application components, to define transactions, and to define monitoring options for these, you must use Business Transaction Management. In the context of monitoring Business Applications, BTM is used to monitor cross-tier transactions; it is not needed for single-tier applications.
To set up Business Transaction Management:
-
Install and configure BTM. This step includes the following:
-
Installation and configuration of central servers. (At this time, you can also configure the connection to the Oracle Enterprise Manager server.)
-
Installation and configuration of monitors, which defines communication between monitors and observers.
-
Installation of observers on every server hosting the services to be monitored.
For information, see Oracle Business Transaction Management Installation Guide.
-
-
Enable access to JVMD. You need this step to access JVMD and RID views from BTM. For information, see "Enabling Access to the JVMD and RID Views" in Oracle Business Transaction Management Online Help.
-
Wait for traffic, discover services, and define transactions in BTM. Discovery in BTM is always dynamic. In a production environment, you must wait for traffic before you can discover application components. In a testing environment, you should run traffic to enable discovery. For more information, see Oracle Business Transaction Management Online Help.
-
Register BTM with Enterprise Manager. Specify the port where the Sphere can be accessed and provide access credentials. You need this step to establish communication between BTM and EM. For information, see Chapter 17, "Monitoring Business Applications."
13.3.5 Create the Business Application
For end-to-end monitoring, you want to create a Business Application that includes your RUEI applications (End User Services), BTM transactions, and the system that supports these. You can build up your Business Application as you go along. You can start by including only the RUEI application, and then add any related transactions. You can even start by looking at the system that supports your distributed applications without including either a RUEI application or a BTM transaction.
To create a Business Application:
-
Create a system in Enterprise Manager that specifies the hosts and containers where monitored application components are running. These hosts and containers are the infrastructure of your distributed application. You need this step for Enterprise Manager to collect and return information about the health of the underlying infrastructure. For more information, see the online help for the Enterprise Manager Console.
-
Create a Business Application using the Enterprise Manager console. This step specifies the RUEI applications (End User Services) and BTM transactions to be included in a Business Application, and it specifies which system (Step 1) supports the Business Application. For information, see Chapter 17, "Monitoring Business Applications."
Note:
With Enterprise Manager 13c, there is a new service level target, called an End User Service (EUS) corresponding to each RUEI Application/Suite. The EUS has the same name as the RUEI Application/Suite, and is used to create a business application. -
Monitor the Business Application. Use the Enterprise Manager Console to monitor the performance of your business application. For more information, see Chapter 17, "Monitoring Business Applications."
-
Edit the RUEI application if needed.
If you have defined a RUEI application and monitoring results in Enterprise Manager show that you need to change its definition to segment data differently or to re-set key performance indicators, you will need to use the RUEI console to change the application definition. For information, see the appropriate Oracle Real User Experience Insight User's Guide at the following URL:
http://www.oracle.com/technetwork/documentation/realuserei-091455.htmlEnterprise Manager is automatically updated with the new definitions.
-
Edit the BTM transaction if needed.
If you have defined a transaction and monitoring results suggest that you need to change the transaction definition to collect more or less data, to add properties or conditions, or to re-set key performance indicators, you will need to use the BTM console to change the transaction definition. For more information, see Oracle Business Management Online Help.
EM is automatically updated with the new definitions.
13.4 User Roles and Privileges
User roles and privileges define accessibility to component functions. The following guidelines apply as you work with components to monitor application performance.
-
Overall, higher privileges are required to create entities in RUEI and BTM than to monitor them in EM.
-
Clicking through from one component to another exposes you to each console's native authentication system. Make sure that you have the privileges required for each component to perform your work.
-
With the exception of the
adminandsuperAdminrules, in EM roles are always associated with targets. What is visible to you in the EM console depends on your role with regard to a particular target. -
You need the
super adminrole to register a BTM or RUEI system with EM. Once the RUEI or BTM system is registered with EM, you don't need thesuper adminrole to create a business application. -
You need
Create Any Targetprivilege andView Targetprivilege on the RUEI or BTM system target to access the credentials used by EM to talk to RUEI and BTM. -
You need
Manage Business ApplicationandBusiness ApplicationMenu Item Application Performance Management resource privileges. -
To view JVM Diagnostics data, you must have
JVM Diagnostics Userprivileges. -
To manage JVM Diagnostics operations such as creating and analyzing heap and thread snapshots, tracing threads, and so on, you must have
JVM Diagnostics Administratorprivileges.


