14 Understanding the User Experience
This section describes the Real User Experience Insight (RUEI) stand-alone product. For information on using RUEI monitoring functions from the Enterprise Manager console, see Chapter 17, "Monitoring Business Applications."
RUEI allows you to monitor application performance. In particular, RUEI monitors the user's interaction with a web browser, usually the first step (application component) in your distributed application. This first step is a crucial one because it identifies those problems that are most visible to users and because it discovers use patterns that can help you improve the design and effectiveness of your user-facing services.
This section introduces the concepts and tasks involved in working with RUEI to understand the user experience. It includes the following topics:
RUEI offers a rich set of features, for complete information about its use, see Oracle Real User Experience Insight User Guide.
RUEI can be configured to allow you to monitor performance without requiring access to the network infrastructure, however this chapter assumes that network data collection is used, but the features described are available for the other non-network data collection configurations. Specifically, Section 14.1, "What Does RUEI Discover?" in this chapter mentions requirements, for example port configuration and network data collection, that are only required if you configure network data collection. For further information on non-network data collection see the RUEI documentation. To view a visual demonstration on how you can use RUEI, navigate to the following URL and click Begin Video:
https://apex.oracle.com/pls/apex/f?p=44785:24:0::NO:24:P24_CONTENT_ID,P24_PREV_PAGE:5783,1
14.1 What Does RUEI Discover?
Users work with your application by interacting with a web page that contains one or more objects. Interacting with an object, for example clicking on a link, the user sets in train a sequence of calls that invoke the services that make up your distributed application. RUEI focuses on the initial interaction with of one or more web pages; Business Transaction Management (described in the next chapter) monitors the sequence of calls that follow from that interaction.
Typically, a single RUEI instance is installed to collect network data before the Web servers, behind a firewall in the DMZ. RUEI can monitor all users accessing a web page, and it does so without affecting server or network response time.
When you install and configure RUEI, you specify the following information:
-
The ports that it should watch for traffic (scope of monitoring)
-
How to identify users (using cookie information or log-in information)
-
How to deal with security issues and how to monitor encrypted data
-
How to identify pages that are associated with a RUEI application
A RUEI application is a collection of pages. In the configuration process, you teach RUEI which pages are associated with a given application.
Once RUEI begins to monitor traffic on the ports you have specified, it can identify and organize the information it discovers according to the scheme you have defined when you configured RUEI.
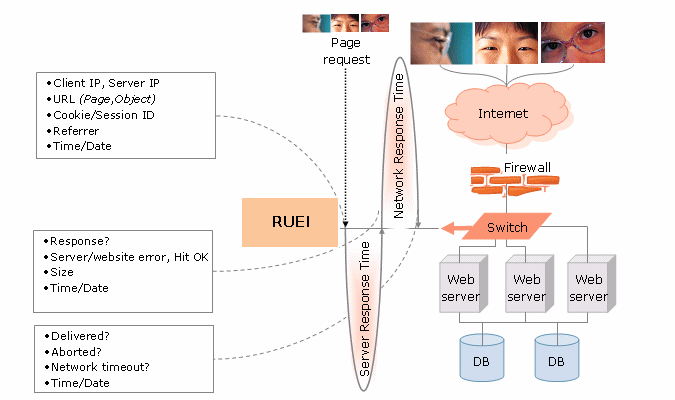
Figure 14-1 shows how RUEI collects data associated with a page request.
-
When the user performs an action on a monitored page, RUEI sees the request and starts measuring network timings and the time it takes the Web Server to present the visitor with the requested object.
At this point, RUEI knows who requested the page (IP client), which object was requested, and from which server the object was requested (IP server).
-
When the Web server responds and sends the object to the user, RUEI sees that response and stops timing the server response time.
At this point, RUEI can see whether there is a response from the server, whether this response is correct, how much time the Web server required to generate the requested object, and the size of the object.
RUEI can also see whether the object was completely received by the user or if the user aborted the download. Therefore RUEI can determine the time it took for the object to traverse the Internet to the visitor, and it can calculate the Internet throughput between the user and the server (connection speed).
Every time an object on a page associated with a RUEI application is accessed, RUEI gathers the following information:
-
Who requested the page and what object they requested
-
Which server hosted the page
-
The response time and the correctness of the response
-
The size of the object
-
Whether the object was completely received or aborted
-
The internet throughput for this request/response sequence
The next section explains the various ways in which you can view and analyze this data using RUEI.
14.2 Viewing and Analyzing RUEI Data
Using the information it collects while the user is interacting with your application, RUEI can present a number of views to help you understand performance issues and use patterns relating to the user experience.
In addition to monitoring data on an ongoing basis, you have the option of creating Service Level Agreements that specify the expected level of service. This agreement is expressed in terms of a number of Key Performance Indicators (KPI) that define benchmark values. For more information, see "KPIs and Service Level Agreements."
Another aspect of evaluating performance is the monitoring of use patterns. You can define a user flow as a sequence of pages, and monitor whether the steps of the flow are completed. For more information, see "User Flows."
Data reported is scoped either to active sessions (5 minute duration) or closed sessions which might stretch for several days.
This section introduces some of the most commonly used RUEI views and also describes some additional ways of analyzing the information it gathers. The screenshots show the RUEI user interface, but much of the information is available in Enterprise Manager. The following sections are included:
14.2.1 Dashboards
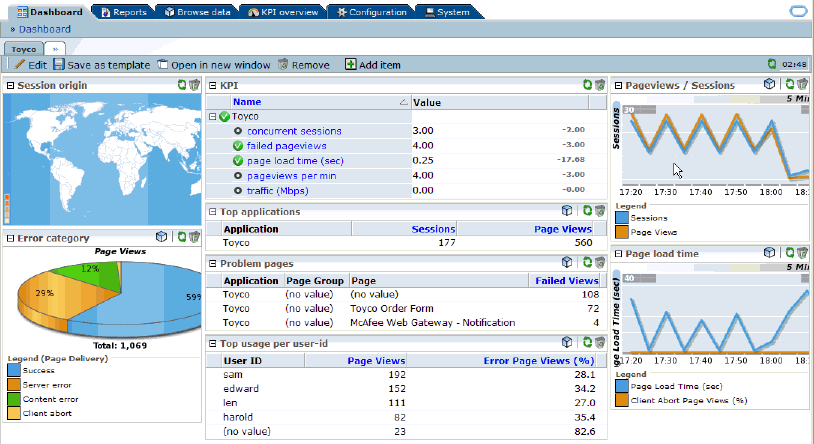
The RUEI Dashboard offers the most comprehensive view of user activity. It provides the following views of activity over the last twenty four hours (much of this information is available from the Business Application or EUS dashboard in Enterprise Manager):
-
A regional, map-based view of the current session activity
-
The five most active applications by page view
-
The five top problem pages
-
The most recent alerts across all monitored applications
-
The status of defined KPIs across all monitored applications, showing how much they have changed from the previously recorded value
-
A chart showing the proportion of errors due to network errors, client aborts, server errors, website errors, and content errors
-
Charts showing average page-load time, and the relationship of page views to sessions
-
You can view data from more than one RUEI instance or view the data aggregated from all connected RUEI instances
14.2.2 Reports
RUEI provides an extensive library of pre-defined reports that allow you to display collected user information in a standard way. You use controls in the Reports tab to generate and view reports.
You begin by using controls in the Reports tab to specify a time period and to select the report you want to generate. Reports are grouped by category, for example Applications or Clients. Each category offers a variety of reporting options. For example, the Clients category allows you to generate reports for Performance per country, Sessions per browser, Sessions per language, Sessions per OS, and so on.
Reports are displayed in table or graphic form and they can be saved as PDF files or exported to other tools.
You can customize reports, you can create new reports, you can create shortcuts to your favorite reports, and you can define filters to constrain reported findings.
14.2.3 Session Diagnostics
The session diagnostics facility allows you to perform root cause analysis of operational problems that have occurred in a given time period.
Diagnostics information is available in a variety of categories; for example, All sessions, failed URLs, slow URLs, Failed pages, and so on. The specific search criteria varies with each group. For example, in the Failed pages category, you can narrow the search by application name, Client IP address, and User ID. You can also use additional filters to limit results.
For some diagnostics categories, you can also specify a search order. For example you can search the most active sessions first.
To use the facility you specify a time period, search criteria (including filters), and search order. RUEI returns all user records that match your search criteria in the order you specified. You can then search further within the currently displayed user records to isolate specific sessions.
The user record that is returned to you includes the complete session page history for a five minute period. You can inspect each page to see its loading satisfaction level, whether it is a key page, and whether it contains an error. You can also select a page to display full page content and the underlying html code received by the server and the client.
In some cases, you can click the Replay icon beside a viewed page to replay the complete user session. This allows you to review each page viewed by the visitor during a session, together with any reported error messages.
You can also click out to external tools from the Session diagnostics facility from selected functional areas. For more information, see "How Does RUEI Work with BTM and JVM Diagnostics?."
You can export complete session contents to external utilities for further analysis, to integrate with other data, or to create the basis for generating test scripts.
14.2.4 User Flows
You create a user flow to define a logical task. A user flow is a collection of web pages and actions. It contains a number of steps that need to be performed to complete the task. In addition to viewing user flows in the RUEI user interface, you can also view user flows as an option on the Business Application or EUS dashboard in Enterprise Manager. For example, a Purchase user flow might have the following defined steps:
-
Item selection
-
Shipping information
-
Billing information
-
Confirmation
Each step can consist of multiple pages. For example, the Item selection step might include a number of pages from which items are selected.
User flow steps are defined in terms of conditions specifying the requirements that must be met for the step to be considered complete. For example, if the Billing information includes conditions relating to alternate methods of payment, only one of these conditions need be satisfied for the step to complete. Steps can be labeled as required or optional. Steps can also have an associated time period against which time-outs and the user experience can be evaluated.
User flows can be associated with a specific application or they can stand on their own.
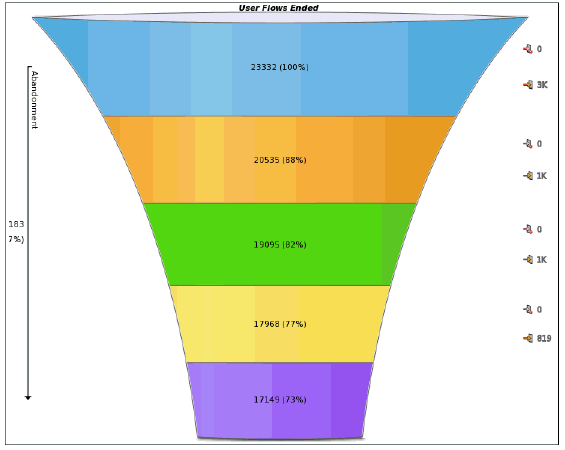
User flow activity is reported at the most generic level using a funnel shape that illustrates the transition of the visitor through the flow steps for a given time period. The narrowing of the funnel represents visitors lost due to time-outs or visitor aborts. Figure 14-3 shows a sample illustration of a user flow.
The flow starts at the top and narrows as users drop off. Each step of the flow is shown in a different color. To the right of the figure are numbers showing how many users aborts and user time outs made up the loss of users for a given step. Following the funnel illustration is more detailed information (not shown in Figure 14-3) about the activity for each step.
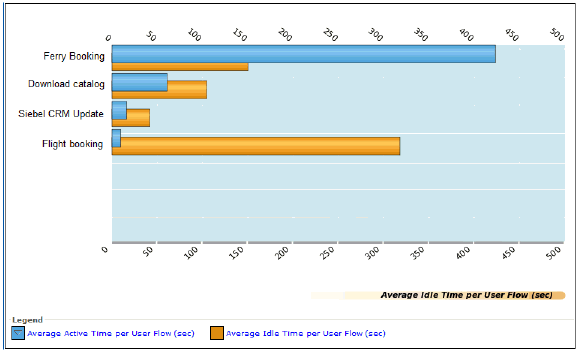
RUEI provides further insight into user flow activity with a view that compares user active time with idle time for each flow. This kind of analysis might suggest which of your pages are most difficult for the user to complete. An example of this view is shown in Figure 14-4:
Note the difference between the Ferry Booking and Flight Booking average idle time. Greater idle time might reflect poor web page design.
User flows provide an excellent means of finding trouble spots, identifying patterns of use, and improving the overall user experience.
14.2.5 KPIs and Service Level Agreements
In addition to the continuous, passive monitoring provided by RUEI, you can set up active monitoring using Key Performance Indicators (KPIs) to monitor specific aspects of performance, and you can define Service Level Agreements that alert you when the specified benchmarks are breached. You can review this data using dashboards and reports. In addition to viewing KPI and SLA information in the RUEI user interface, you can also view an SLA dashboard or SLA summary region as an option on the Business Application or EUS dashboard in Enterprise Manager.
An SLA defines an expected level of service, typically expressed in terms of one or more Key Performance Indicators. For example a KPI might test whether a service is available 99% of the time, and an SLA might be defined to report when availability falls below this value.
KPIs are grouped into categories such as load times, sessions, throughput, and so on. You can define your own category; for example, user flow completion or website availability.
When you define a KPI you specify the following information:
-
whether to associate it with data from a specific application or whether it will be generic
-
what metric to apply
-
whether filters are needed to further define the scope of the KPI. For example, if you selected the user-flow-load-time or Ended user flows metric, you need to specify the user flow to which it refers.
-
whether the KPI has a minimum or maximum target range. Targets can be fixed or relative to historical performance.
-
whether and how the KPI should be incorporated into an SLA
-
whether an alert should be associated with the KPI
RUEI gives you very fine control over active monitoring. You can create service-level and alert schedules that are sensitive to normal periodic variation in target values, and you can define alert profiles and escalation procedures to specify who should be notified when an alert is triggered.
14.3 What Questions Can RUEI Answer?
RUEI can answer questions like the following about the user experience:
-
What time of the day are the greatest number of page hits?
Look at the chart that relates page views to sessions on the Dashboard tab.
-
What regions in Europe are experiencing the greatest user activity.
Look at the Session origin map for Europe, in the Dashboard tab.
-
What percentage of total errors is due to client aborts?
Look at the Functional errors chart in the Dashboard tab.
-
What are my most problematic pages?
Look at the Problem Pages listing in the Dashboard tab.
-
Which browser is most heavily used by clients in France?
Select the Sessions per browser report from the Clients category in the Reports tab, and filter by client-location/country.
-
Show me user records for the Bookings application that have a specific ECID.
Select the Session diagnostics group, and then specify the application name and the ECID of interest. For information about ECID, see Section 13.2, "Using ECIDs to Track Requests."
-
In what step of my Booking user flow am I losing the most customers?
Look at the user flow funnel and status details.
-
How many users returned to a previous step in my user flow?
Look at the Status Details for a user flow to see the number of users returning for each step. A high number of returning users might indicate the need to carry some status information forward into the following screen.
-
When has the availability of my creditCheck service fallen below 95%?
Define a KPI for that metric, and define a Service Level Agreement that alerts you when the desired value is breached.
14.4 What Aspects of RUEI Can You Access from the EM Console?
You can access monitoring information about the user experience from the Enterprise Manager console. However you cannot define or edit user flows, KPIs, SLAs, or custom Reports in the Enterprise Manager console. All that needs to be done using the RUEI console.
What information is provided in the Enterprise Manager console depends on how you have defined your application and monitoring features in RUEI. Should you find that you need different information, you can use the RUEI console to edit the appropriate elements. Enterprise Manager will be automatically updated with the new definition, and it will display the information you need after you have run additional traffic.
Overall, the information you can access from the Enterprise Manager console includes the following for each RUEI application associated with the current business application:
-
On the Business Application Home page, you can view the Key Performance Indicators (KPIs) defined for your application, their status, and their defined thresholds. You can also view an overview of incidents and problems associated with the business application. Some of these might have been generated by RUEI.
Note:
With Enterprise Manager 13c, there is a new service level target, called an End User Service (EUS) corresponding to each RUEI Application/Suite. The EUS has the same name as the RUEI Application/Suite, and is used to create a business application. -
The alerts generated by KPIs defined for RUEI applications are reported as events in Incident Manager. To view these events select Monitoring and then Incident Manager from the Enterprise menu. Then open the Events Without Incidents predefined view. Click the event of interest to view more information.
To reach more detailed monitoring information for RUEI applications, select Real User Experience (RUEI) and then Real User Experience (RUEI) Data from the Business Application drop down. You will be able to see the following regions:
-
RUEI Key Performance Indicators region, which gives more detailed information for defined KPIs
-
Top User and Application Violations region, which allows you to examine the application pages with the highest number of violations
-
Top executed User Requests region, where you can view the most frequent user requests and actions, and assess their impact on the business application
-
Top Users region, where you can monitor the most active users of the targets associated with the business application
To perform root cause analysis of operational problems, you can use the RUEI Session Diagnostics facility. You access this facility by selecting Real User Experience (RUEI) and then RUEI Session Diagnostics from the Business Application drop down.
To view the RUEI Metrics page, select Real User Experience (RUEI) and then RUEI Metrics from the Business Application drop down.
For complete information about working with RUEI in the Enterprise Manager Console, see "Monitoring Business Applications."
14.5 How Does RUEI Work with BTM and JVM Diagnostics?
RUEI can work seamlessly with BTM and JVMD if you install and configure these as described in "Setting up End-to-end Monitoring." Options include the following:
-
You can click out to JVMD to get activity information for the selected request based on its ECID. You can access the Request Instance Diagnostics page by a right-click on a record in a RUEI Session Diagnostics view.
-
You can click out to Business Transaction Management to display information about a business transaction from the Session Diagnostics facility.
-
You can click out the Business Transaction Management to provide aggregated information about the specific flow of work associated with the selected request. This option is available through the BTM service/operation dimension within the URL diagnostics group.
-
You can click out to Business Transaction Management to provide aggregated information about the service deployed within your application environment associated with the selected request. This option is available through the BTM service dimension within the URL diagnostics group.
For additional information about how RUEI works with external tools, see "Configuring Clickouts to External Tools" in Oracle RUEI User's Guide.


