15 Discovering Services and Working with Transactions
This section describes the Business Transaction Management (BTM) stand-alone product. For information on using BTM monitoring functions from the Enterprise Manager console, see Chapter 17, "Monitoring Business Applications."
Monitoring the user experience treats the sequence of operations that follows a page hit as a black box. A user action triggers a request: the request goes out, a response is returned, and if the tardiness or absence of the reply is not directly related to the web page, it is impossible to determine its cause. (This series of actions is illustrated in Figure 13-1.) Business Transaction Management (BTM), another aspect of monitoring application performance, allows you to examine the sequence of operations that ensue from the original request. BTM focuses on the monitoring of transactions, a subset of these operations, to help you locate which operations in the sequence have performance issues and errors.
This section introduces the basic concepts and tasks involved in working with BTM. It includes the following topics:
BTM offers a rich set of features that we cannot hope to describe in a single chapter. For complete information about its use, see Oracle Business Transaction Manager Online Help. To view a visual demonstration on how you can use BTM, access the following URL and click Begin Video:
https://apex.oracle.com/pls/apex/f?p=44785:24:539253248237801::NO:24:P24_CONTENT_ID,P24_PREV_PAGE:6366,1
15.1 What Does Business Transaction Management Discover?
Business Transaction Management uses dynamic discovery, based on traffic flow, to discover the essential characteristics of a running application. These include the following elements:
-
Application components: the logical service that designates a deployed component type, the endpoints (instances of that service), and the operations that can be invoked on an endpoint
-
The dependencies among components
-
The containers (application servers) where application components are running
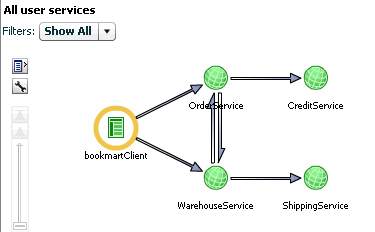
After you run traffic, BTM can display the services and dependencies found in a dependency graph, like the one shown in Figure 15-1.
Although BTM can discover a wide variety of components, it uses a web-service model to represent these components and their dependencies, no matter what their actual type. According to this model, services interact by sending request and response XML messages. For example, if you have a composite application consisting of a web service that calls an EJB that accesses a database via JDBC, it will be modeled as three services that communicate using XML messages. When you use the Business Transaction Management console to view discovered components, these are listed as services, and the messages they exchange are listed as operations belonging to these services. A message corresponds to either the request or response phase of an operation. The figure below shows how BTM represents related discovered services.
The figure shows five inter-related services and the flow of traffic between them. The circled service is the service initiating traffic. You can drill down further to show service operation dependencies, this view is the starting point for a transaction definition, which is described next.
15.2 Defining Transactions
Once you have run traffic and discovered the services that make up your application, you can define a transaction that includes some or all of those services in a flow. Normally, a transaction will be comprised of a subset of the flow of services that make up your application. You will use transactions to focus on an area of interest in order to get a better understanding of performance or to troubleshoot problems.
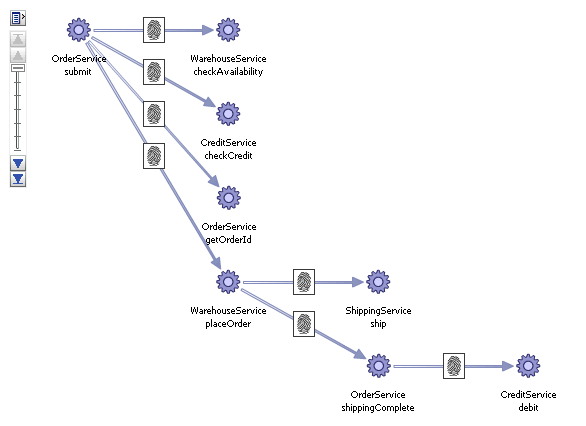
By default, a transaction begins with the operation you select as a starting operation and it ends with the response message of that operation. You can customize the definition by changing the operations that are included in the transaction definition and by including flows whose relevance cannot be automatically discovered. The figure below shows a graphical representation of a transaction definition based on the dependency graph shown in Figure 15-1.
The figure shows the sequence of operations that follows the starting operation of the transaction, OrderService:submit. (The fingerprint icon shown on the arrows linking the operations means that these operations were automatically correlated using message fingerprints. If they had been manually correlated, a key icon would have been used instead.)
By default, monitoring is enabled for a transaction. BTM will capture basic measurements of transaction performance: average response time, started transactions, completed transactions, and maximum response time. You can increase the depth and extent of monitoring by specifying the following additional features:
-
You can choose to segment transaction measurements based on host address and by individual consumer.
-
You can enable instance logging to see a list of transaction instances recorded in a given time period. You can then assemble and inspect a given instance, view any property values for that instance, and create conditions based on these property values.
-
You can enable message logging, which allows you to view message content for the operations you specify. You can also search for an operation based on the content of its request or response message.
Each of these features exact some cost on BTM performance and resources. For example, for applications that process large volumes of data, instance logging can take up a lot of database space. To help balance monitoring needs with performance, BTM allows you to define properties for a given operation to capture partial content of a message without having to log message content. You can also use properties to manually correlate messages, to search for specific transaction instances, and to define conditions.
The features you choose when you define a transaction govern the kind and extent of monitoring that follows. In addition to this type of monitoring, you can also configure BTM to alert you about special situations by using conditions and service level agreements:
-
Service level agreements (SLA) define standards of performance for your transactions based on aggregate measurements. Business Transaction Management then monitors deviations from those standards, and when deviations occur, an alert is issued and displayed in the Management Console. When you view BTM-related information in the Enterprise Manager console, events corresponding to these SLAs are shown in the Events Without Incidents view of the Incident Manager. To view these events on the Business Application page see Section 15.2.1, "Promoting SLA Violations to the Business Application Page".
-
Conditions can alert you when an expected message does not arrive, when a specified message property value is encountered, or when a fault occurs. They are tools to help you detect issues in specific transaction instances. When the condition is triggered and satisfied, Business Transaction Management assembles the corresponding transaction instance, allowing you to view its content and perform whatever analysis is needed for troubleshooting or other performance evaluation. Note that evaluating conditions on each transaction instance requires instance logging to be enabled and can affect BTM performance.
15.2.1 Promoting SLA Violations to the Business Application Page
By default SLA violation events are not promoted to incidents and will not appear in the Business Application page. To promote events to incidents, follow these steps:
-
From the Setup menu, select Incidents, then select Incident Rules.
-
Click Create Rule Set. In the Create Rule Set page, in the Targets region, select the All Targets of types option. Select the Business Application target type.
-
Click Create in the Rules region and in the Select Type of Rule to Create window, choose Incoming events and updates to events option and click Continue. The Create New Rule: Select Events page appears. In the Type drop down, select Application Performance Management KPI Alert.
-
Click Add. The Add Actions window appears. Select the Always execute the actions option and Create Incident option.
-
Click Next, review the rules, and click Continue to save the rule. All events that match the criteria will be promoted to incidents and will appear in the Business Application page.
15.3 Monitoring Transactions
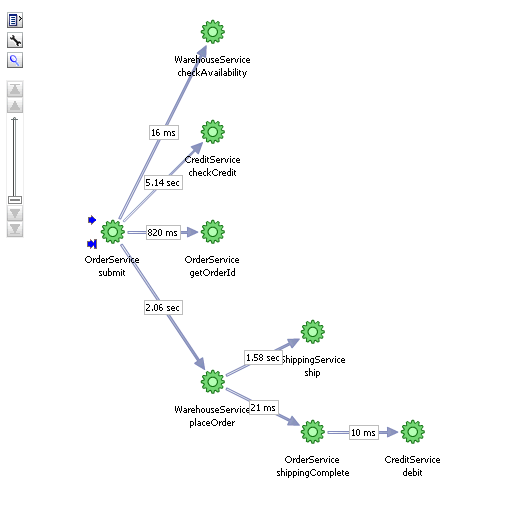
How much information Business Transaction Management gathers for a given transaction depends on the transaction definition as explained above. At a minimum, if you have not enabled any features, BTM displays core measurements for the selected transaction in the Main area of the BTM console. This includes the number of started and completed transactions, the throughput, the average response time, the maximum response time, and the number of violation alerts. The figure below shows graphic monitoring information for the transaction whose definition is illustrated in Figure 15-2. The numbers shown represent the average response time for a link. If you right-click on the link, a popup window displays the link throughput. In addition to the figure, BTM displays a grid view that lists the core measurements described above.
In the Tabs area of the display, BTM shows information about performance data segmented by consumer or client address, alerts, assembled transaction instances, logged message content, SLA compliance, and the transaction definition. How much of this data is available depends on the transaction definition. For example, if you have not enabled message logging, you will not be able to view message content.
In addition to the core instruments, you can enable additional instrumentation and monitoring both for transactions and for services and operations. For more information, see "About Instruments" in Oracle Business Transaction Management Online Help.
15.4 What Questions Can Business Transaction Management Answer?
Using transactions, properties, service level agreements, and conditions, Business Transaction Management can answer questions like the following about your application:
-
What is the logical structure of my application? What are the operations that make up my application components, and what are their call dependencies?
Open the Service Map view to display currently active services and their dependencies.
-
Where can I look at my environment infrastructure and the dependencies between the elements of that infrastructure?
Select the Containers view. From here you can see the application components hosted in a given container, and you can also see the operations that make up each component.
-
How can I get a quick overall sense of operational status?
Select Operational Health Summary from the Dashboards view. This gives you current failure and warning counts, alerts, and admin status.
-
How are my transaction flows performing, and what is the volume of traffic?
Select a transaction in the Transaction view and check monitoring data for a transaction for throughput and average response time numbers.
-
What parts of my application are most heavily used?
Check the Most Load items in the Top 10 Services dashboard.
-
Which services are most error prone?
Check the Most Faults items in the Top 10 Services dashboard.
-
Which are my slowest transactions?
Check Slowest Avg Response Time table in the Top 10 Transactions dashboard.
-
How does current performance compare with historical norms?
Define a baseline for the performance metric of interest and define warning and alert levels for an SLA on selected operations. Once the baseline is defined, it's displayed as a reference on the Transaction Summary page and Analysis tab. You can also receive alerts if you configure SLAs. View results in the SLA Compliance tab.
-
Which of my customers is getting the slowest service?
Define consumer segmentation and view results in the Analysis tab.
-
Are there any bottlenecks in traffic flow? Do I need to add a load balancer.
Look for unusually high throughput numbers and slow average response time on services.
-
How many orders exceeded $10,000 in the last week?
Define a property for the message element that specifies the invoice total. Then, define a condition that uses this property to alert you for the occurrence of any order that exceeds that amount. The count of the condition is tracked as an instrument that is displayed on the Analysis tab for the transaction.
15.5 Accessing BTM from the Enterprise Manager Console
You can access monitoring and definitional information about transactions from the Enterprise Manager Console. You cannot edit transactions, create properties, define conditions or set Service Level Agreements in the Enterprise Manager console. All that needs to be done in the Business Transaction Manager console.
Of course, as we explained in "Defining Transactions," what information is provided depends on what features you have enabled when you defined the transaction. For example, if you don't enable instance logging, you will not be able to view information about individual transaction instances. Should you find that you need a different amount of information, you can use the Business Transaction Management console to edit the transaction definition. Enterprise Manager will be automatically updated with the new definition, and it will display the information you need after you have run additional traffic.
Overall, the information you can access from the Enterprise Manager console includes the following for each transaction associated with the current business application:
-
On the Business Application page, you can view the list of all associated transactions, along with the selected transaction's current compliance status, the number of transaction instances started and completed during a given period, the average completion time, and the maximum completion time.
-
On the Transaction Home page, which you can reach by clicking a transaction on the Business Application page, you can view SLA compliance and a tree table list of the transaction service operations with core measurements, with the breakdown of the performance measurements across service instances (endpoints) for cases where the service has replicates.
-
Right clicking on an endpoint in the Transaction Home page gives you the option of launching the BTM UI to see the details for that operation or to launch JVMD.
You can access more extensive and detailed information for a given transaction by clicking Launch BTM from the Transaction Home Page. This will open a new window which allows you to view Tab information from the Business Transaction Management console.
For complete information about working with BTM in the Enterprise Manager Console, see "Monitoring Business Applications."
15.6 How Does Business Transaction Management Work with RUEI and JVM Diagnostics?
Business Transaction Management can work seamlessly with RUEI and JVMD if you install and configure these as described in "Setting up End-to-end Monitoring." Options include the following:
-
You can access the Business Transaction Management from RUEI. For information, see "Configuring Clickouts to External Tools" in Oracle Real User Experience Insight User's Guide.
-
You can access Java Virtual Machine Diagnostics (JVMD) and the Request Instance Diagnostics (RID) view from the Business Transaction Management console.
You can access the JVMD view by selecting an operation and selecting Drilldown to JVMD from its drop list. You can then view details about an executing JVM process for the period within which the operation executes. You can see stack frames for executing threads, thread state information, aggregate information about the frequency and cost of method execution, and so on.
For a message that has been assigned an ECID, you can view information in the Request Instance Diagnostic view, which displays a list of the JVMs through which request steps with the specified ECID executed. You can access the RID view by selecting an operation and selecting Request Instance Diagnostics from its drop list.
For more information, see "Accessing Other Diagnostic Tools" in Oracle Business Transaction Management Online Help.


