4 Managing Communications Applications with Enterprise Manager Cloud Control
This chapter describes how to manage Oracle Communications applications using Oracle Application Management Pack for Oracle Communications with Oracle Enterprise Manager Cloud Control.
Overview
Application Management Pack for Oracle Communications provides management capabilities for the following Oracle Communications applications:
-
Business support systems (BSS):
-
Oracle Communications Billing and Revenue Management (BRM) including Elastic Charging Engine (ECE), Pipeline Configuration Center (PCC), and Pricing Design Centre (PDC).
-
Oracle Communications Network Charging and Control (NCC)
-
Oracle Communications Offline Mediation Controller
-
-
Operations support systems (OSS):
-
Oracle Communications ASAP
-
Oracle Communications Order and Service Management (OSM)
-
Oracle Communications Unified Inventory Management (UIM)
-
-
Integrations:
-
Oracle Application Integration Architecture for Communications (Oracle AIA)
-
Supported Actions
You perform a variety of actions in Enterprise Manager Cloud Control, including discovering, provisioning, patching, upgrading, and monitoring applications.
Actions supported vary by application. Not all actions are supported by all applications. Table 4-1 lists supported actions for each application.
See "Supported Applications, Suites, and Solutions" for information about supported Oracle Communications applications and versions.
Table 4-1 Supported Application Management Pack for Communications Actions
| Action | ASAP | BRM | ECE | NCC | Offline Mediation Controller | OSM | PDC | PCC | UIM | Oracle AIA |
|---|---|---|---|---|---|---|---|---|---|---|
|
Discover |
Yes |
Yes |
Yes |
Yes |
Yes |
Yes |
Yes |
No |
Yes |
Yes |
|
Provision |
Yes |
Yes |
No |
No |
No |
Yes |
Yes |
Yes |
Yes |
No |
|
Start/Stop Processes |
No |
Yes |
Yes |
Yes |
Yes |
No |
Yes |
No |
No |
No |
|
Patch/Roll back patches |
No |
Yes |
No |
No |
No |
No |
No |
No |
No |
No |
|
Upgrade |
No |
No |
No |
No |
No |
No |
Yes |
No |
No |
No |
|
Monitor |
Yes |
Yes |
Yes |
Yes |
Yes |
Yes |
Yes |
No |
Yes |
Yes |
|
View/Compare Configurations |
No |
Yes |
Yes |
Yes |
Yes |
Yes |
Yes |
No |
Yes |
Yes |
|
Edit Configurations |
No |
Yes |
No |
No |
No |
No |
No |
No |
No |
No |
|
Manage Alerts |
Yes |
Yes |
Yes |
Yes |
Yes |
Yes |
Yes |
No |
Yes |
Yes |
|
View Topology |
Yes |
Yes |
Yes |
Yes |
Yes |
Yes |
Yes |
No |
Yes |
Yes |
|
Manage Compliance |
No |
No |
No |
No |
No |
Yes |
No |
No |
Yes |
Yes |
Discovering Applications
Discovery enables adding already installed Oracle Communications applications in your environment to Enterprise Manager Cloud Control. Application Management Pack for Oracle Communications provides automatic and guided discovery modules for supported Oracle Communications applications and components running on managed host targets. After discovery, you promote new Oracle Communications targets to a managed status.
See "Adding Oracle Communications Targets" for information about adding existing Oracle Communications targets to your Enterprise Manager Cloud Control instance.
Provisioning and Upgrading Applications
You provision and upgrade supported Oracle Communications applications, components and suite configurations using the Communications Suite Installation Procedure in Enterprise Manager Cloud Control.
The procedure requires an understanding of the installation parameters of each application and assumes that all prerequisites for installing those applications are met. See "Preparing New Hosts for Application Provisioning" for more information about ensuring application hosts are ready. See "About Providing Valid Installation Parameter Values" for information about required values for installation parameters.
You can provision one or more applications using a single Communications Suite Installation Procedure execution. For example, you can provision Oracle Communications applications that form the Order to Cash solution at the same time.
The Communications Suite Installation Procedure supports:
-
Provisioning application suites. See "About Provisioning Application Suites".
-
Provisioning highly-available suites and clustered applications. See "About Provisioning Highly-Available Suites and Clustered Applications".
-
Upgrading PDC. See "Upgrading PDC".
-
Provisioning all supported applications. See "Provisioning Applications and Suites" and "Provisioning BRM".
The Communications Suite Installation Procedure requires that application and component hosts exist as managed host targets in your Enterprise Manager Cloud Control environment. See "Understanding Oracle Communications Targets" for information about adding new and existing hosts as managed targets.
Note:
On Oracle Real Application Clusters (Oracle RAC) databases, the Communications Suite Installation Procedure supports provisioning BRM and OSM only.About Providing Valid Installation Parameter Values
The values that you provide for the installation parameters during the Oracle Communications Installation Procedure are required by the Oracle Communications application installer for the selected application. Typically, you enter these values during the installation interview process for the application you are installing.
You must use values that respect the validations performed by the application installer. For example, if a product does not allow a user name and password to be the same or requires special characters in the password, you must use values that meet those requirements.
The Communications Suite Installation procedure validates that you have provided values for all required fields, but it does not immediately validate the content of the values. You will not be notified that you have used invalid values until after the procedure fails.
See the specific Oracle Communications application product installation guides for information about the parameters and their required values.
About Provisioning Application Suites
Oracle Communications application suites, such as the Order to Cash solution suite, provide cross-application functionality. Provision supported applications suites using the Communications Suite Installation Procedure.
You can provision the following application suites on both a single server meeting the minimum technical requirements for multi-application installation or across distributed high-availability hosts:
-
Order to Cash suite:
-
ASAP
-
BRM
-
OSM
-
PCC
-
PDC
-
UIM
-
-
OSS Service Fulfillment suite:
-
ASAP
-
OSM
-
UIM
-
You provision a suite in the same way as other targets, as described in "Provisioning Applications and Suites".
After provisioning applications suites, you must manually deploy solution cartridges. For information about deploying cartridges for the individual applications, see:
-
Oracle Communications Order and Service Management Cartridge Guide for Oracle Application Integration Architecture
-
Oracle Communications Unified Inventory Management Installation Guide
-
Oracle Communications ASAP Installation Guide
About Provisioning Highly-Available Suites and Clustered Applications
You can provision supported Oracle Communications applications in the following high-availability and cluster configurations:
-
A highly-available OSS fulfillment suite
-
A highly-available Order to Cash suite
-
An OSM cluster with multiple nodes
-
A UIM cluster with multiple nodes
You provision highly-available or clustered targets in the same way as other targets, as described in "Provisioning Applications and Suites".
By default, the Communications Suite Installation Procedure includes OSM and UIM clusters with two nodes. You can add more nodes using the Configure button as described in "Provisioning Applications and Suites".
Important:
If you are provisioning an OSM cluster on a WebLogic Server domain that uses a shared storage system such as Network File System (NFS), ensure that the user IDs are consistent across all WebLogic Server client machines that access the shared storage.For more information about best practices for WebLogic Server on shared storage, see the Oracle Maximum Availability white paper, available at the following link:http://www.oracle.com/au/products/database/fusion-middleware-maa-155387.html
Upgrading PDC
Upgrading PDC involves the following steps:
-
Perform the following tasks as described in the discussion of pre-installation tasks for the PDC patch installation in Oracle Communications Pricing Design Center Installation and System Administration Guide:
-
Shut down the current PDC instance.
-
Back up your existing PDC installation.
-
Install the recommended BRM version or patch.
-
Install the recommended version of JRE/JDK.
-
Upgrade WebLogic Server to the recommended version.
-
Enable the SSL Port for the WebLogic Server domain and ensure that the domain's state is Release Configuration.
-
Upgrade Oracle Application Development Runtime to the recommended version.
-
-
Set the path to the JAVA_HOME environment variable as described in "Setting the Java Home Path for PDC".
-
Provision PDC as described in "Provisioning PDC".
Setting the Java Home Path for PDC
To set the Java home path for PDC:
-
Go to the MW_Home/user_projects/domains/bin directory, where MW_Home is the directory where the Oracle Middleware components are installed.
-
Open the setDomainEnv.sh file in a text editor.
-
Search for the following line:
JAVA_HOME="
-
Edit the value to match the absolute path to the directory where you installed the version of Java required by the version of PDC to which you are upgrading.
For example:
JAVA_HOME="/pinhome/pin136/opt/portal/7.5/ThirdPartyApps/jre/1.7.0" -
Save and close the file.
-
Restart the administration server.
Provisioning PDC
Provision PDC as described in "Provisioning Applications and Suites" and, when specifying the domain parameters under ADMIN Configuration, ensure that you select the Do you want to upgrade PDC option.
Provisioning Applications and Suites
This section describes provisioning the following Oracle Communications application types:
-
Order to Cash and OSS Fulfillment suites
-
OSM single nodes and OSM clusters
-
UIM single nodes and UIM clusters
-
ASAP
-
PCC
-
PDC
See "Provisioning BRM" for information about provisioning BRM.
To provision an Oracle Communications application or suite:
-
Log in to the Enterprise Manager Cloud Control administration console.
-
From the Enterprise menu, select Provisioning and Patching, and then Procedure Library.
The Deployment Procedure Manager page appears.
-
In the Select column, select the Communications Suite Installation Procedure option.
-
Click Launch.
The Communications Suite Provisioning page appears.
-
Under Choose Targets, click Add to select the types of Oracle Communications targets to provision.
The System Types dialog box appears.
-
Select the check box for each type of system to provision.
You can provision multiple system types at a time, but you cannot provision multiple OSS system types unless they are included in a suite. For example, you can select a PCC target and an OSM target, but if you select an invalid combination, such as an OSM target and an ASAP target, an error is displayed when you click OK and you cannot proceed.
To provision multiple OSS system types included in a suite, select one of the OSS Fulfillment Suite or Order to Cash Suite options.
-
Click OK.
The selected systems are added to the Choose Targets table, which displays each system's components.
For applications that require an Oracle WebLogic Server installation, an ADMIN row is automatically added for specifying the WebLogic Server installation used for provisioning. The ADMIN row also lets you provide details for the Fusion Middleware Repository Creation Utility (RCU).
For highly-available suites and application clusters, a PROXY row is automatically added for each OSM and UIM cluster and rows are added for OSM and UIM nodes.
-
(Optional) You can save your provisioning configuration as a custom system. This is useful when you plan to provision multiple instances of the same application on multiple targets or for backing up configurations for reuse at a later time.
To save a provisioning procedure configuration as a custom system:
-
Click Save.
The Custom System Name dialog box appears.
-
In the Name field, enter a name for the configuration.
-
Click OK.
-
-
For targets that require an Oracle WebLogic Server domain, do the following:
-
Select the ADMIN row.
-
From the menu in the Target Name column, select the host of the administration server from which to provision the target.
The table is updated with the Free RAM, RAM, Free Storage and Storage values for the selected host.
-
In the Host Configurations region, under ADMIN Configuration, enter values for the required fields.
The RCU fields are required for OSM, UIM, and ASAP on Fusion Middleware 12c. On Fusion Middleware 11g, they are required for UIM only. Any values provided in these fields when provisioning OSM or ASAP on Fusion Middleware 11g are ignored.
-
(Optional) For PDC targets, to upgrade PDC, select the Do you want to upgrade PDC option.
-
-
For highly-available suites and cluster applications, do the following:
-
(Optional) To add more cluster nodes or proxies:
-
Select a UIM or OSM cluster row.
-
Click Configure.
-
Select Add Application or Add Proxy.
A row for the application or proxy is added to the table under the cluster.
-
-
Specify the port for the WebLogic Server proxy:
-
Select the PROXY row.
-
From the menu in the Target Name column, select the host for the proxy.
For highly-available and cluster environments intended for demonstrations and development, you can use the same host for the administration server, the proxy server, and the application.
The table is updated with the Free RAM, RAM, Free Storage and Storage values for the selected host.
-
In the Host Configurations region, in the WebLogic Proxy Server Port field, enter the port for the WebLogic Server proxy.
Note:
Using the Remove button can result in invalid configurations, such as an OSM cluster with no nodes. When provisioning a cluster, do not remove the individual application rows. When provisioning a highly-available suite, you can remove all of the rows representing an entire cluster, but do not remove only the individual application rows within the cluster.
-
-
-
For PDC targets, do the following:
-
Select the PDC BRM PACK row.
-
In the Host Configurations region, under PDC BRM PACK Configuration, enter values for the required fields.
Selecting Support Migration is optional. The Migration Username and Migration User Password fields are required only if you select the Support Migration option.
-
(Optional) Select the Support Migration option and enter values for all of the Migration fields.
-
-
For each component in the Choose Targets table that you have not yet configured, do the following:
-
Select the component's row.
-
From the menu in the component's Target Name column, select the host on which to provision the component.
The table is updated with the Free RAM, RAM, Free Storage and Storage values for the selected target host.
Note:
For OSS applications, the provisioning procedure uses the hosts that you select for the application rows as managed servers in the WebLogic Server domain. The procedure installs the applications from the administration server host, not the managed server hosts. As a result, the application home directories are located on the administration server host. -
In the Host Configurations region, enter values for all required fields.
Note:
Passwords for database users must not begin with $$.Note:
For PDC targets, the PDC Managed Server SSL Port field is required. During installation, Secure Sockets Layer (SSL) is enabled by default for the WebLogic servers used by PDC. If you do not want to use SSL, you can disable it in the WebLogic Server Administration Console. See the WebLogic Server documentation for more information about using SSL.
-
-
Click Next.
-
Provide the preferred credentials for the target host. See "About Host Preferred Credentials" for more information.
-
Under Schedule, specify when the installation procedure should run.
-
Click Next.
-
Under Review, verify your provisioning configuration by checking the summary provided, and then click Finish.
Tip:
You can view the status of the provisioning process in the Procedure Activity tab. Click the procedure name in the Run column to view the procedure's status. To update the status, click Refresh. The Procedure Steps table displays all of the provisioning procedure steps and their corresponding statuses. View details about any step by selecting the option for that step in the Select column.Provisioning BRM
This section provides an overview of how to set up a new Oracle Communications BRM system and components using the Communications Suite Installation Procedure. Applications Management Pack for Oracle Communications provides two options for provisioning BRM:
-
The BRM Basic option installs a limited set of components on a single target host. Use these systems for development or simple deployments of BRM. See "Provisioning a Basic BRM System" for a list of included components.
-
The BRM Advanced option enables selecting specific components for installation on one or more hosts. Use this option when installing production systems or testing systems with distributed component architecture.
Using the procedure requires an understanding of BRM architecture and installation. See Oracle Communications Billing and Revenue Management Installation Guide for more information about installation details, including installation parameters.
To set up a new BRM instance:
-
Download the required BRM InstallShield MultiPlatform (ISMP) packages from the Oracle Software Delivery Cloud to a location accessible from the Management Server. See "Downloading the BRM Installers" for more information.
-
Create the BRM source components in the Enterprise Manager Cloud Control Software Library. See "Creating the BRM Source Components" for more information.
-
Create the Oracle Enterprise Database used by BRM. See "Specifying the BRM Database" for more information.
-
Provision either a single instance BRM system or individual components on one or more host targets. See "Provisioning a Basic BRM System" and "Provisioning BRM Components" for more information.
Downloading the BRM Installers
Download the BRM ISMP installer packages from the Oracle Software Delivery Cloud at:
You must download all of the BRM ISMP installer packages when using the BRM Basic option.
Place the downloaded ISMP packages into a file share location accessible from your Enterprise Manager Cloud Control Management Server. The Communications Suite Installation Procedure requires either a local or remote path to the location where the packages are installed.
In some cases, a single ISMP package provisions multiple BRM components. For example, the Portal Base package includes the Connection Manager (CM), Data Manager (DM) and BRM Applications. Table 4-2 contains a list of the ISMP packages and the included installable components in each package.
Table 4-2 BRM ISMP Packages Descriptions and Base Components
| BRM ISMP Package | Installable Components | Source Component Name Format | Base Component |
|---|---|---|---|
|
AccountSynchTool |
Account Synchronization CM Account Synchronization DM |
AccountSynchTool_release_OS |
oracle_brm_cm |
|
BRM Base |
Batch Controller CM Proxy CMMP Connection Manager Email Data Manager Formatter Invoice Data Manager Oracle Data Manager BRM Applications (Device Management, Load notification event, Load price list, Pin A/R taxes, Pin balance transfer, Pin billed, Pin bill handler, Pin bulk adjust, Pin export price, Pin invoice, Pin monitor, Pin ood handler, Pin rate change, Pin remit, Pin rerate, Pin subscription, Pin trial bill, Pin unlock service Invoicing, Misc, Pin_cfg_bpdump, SOX_Unlock, Subscription, Testnap, UEL, GL_Export, Diagnostics, Infranet Manager CLI, Infranet Manager, Node Manager, Export_price, Credit_Control Billing, Account Dump Utility, Development_Files) |
PortalBase_release_OS |
NA |
|
BRM_Services_Framework_Mgr_AAA |
BRM Services Framework Manager AAA |
BRMServicesFrameworkMgrAAA_release_OS |
oracle_brm_cm |
|
BRM_Services_Framework_Mgr |
BRM Services Framework Manager |
BRM_Services_Framework_Mgr_release_OS |
oracle_brm_cm |
|
CIBERRoaming |
CIBER Roaming |
CIBERRoaming_release_OS |
oracle_brm_pipeline |
|
CollectionsMgr |
Collections Manager |
CollectionsMgr_release_OS |
oracle_brm_cm |
|
ContentMgr |
Content Manager |
ContentMgr_release_OS |
oracle_brm_cm |
|
EAI_FrameworkMgr |
EAI Connection Manager (CM) module EAI Data Manager Payload Generator External Module |
EAIFrameworkMgr_release_OS |
oracle_brm_cm |
|
EmailMgr |
Email Manager |
EmailMgr_release_OS |
oracle_brm_cm |
|
GPRS_AAA_Mgr |
GPRS AAA Manager |
GPRSAAAMgr_release_OS |
oracle_brm_cm |
|
GPRS_Mgr_30 |
GPRS Manager 3.0 |
GPRSMgr_release_OS |
oracle_brm_cm |
|
GSM_AAA_Mgr |
GSM AAA Manager |
GSMAAAMgr_release_OS |
oracle_brm_cm |
|
GSM_Mgr |
GSM Manager |
GSM_Mgr_release_OS |
oracle_brm_cm |
|
IPAddressMgr |
IP Address Manager |
IPAddressMgr_release_OS |
oracle_brm_cm |
|
Interconnect |
Interconnect Manager |
Interconnect_release_OS |
oracle_brm_pipeline |
|
InventoryMgr |
Inventory Manager |
InventoryMgr_release_OS |
oracle_brm_cm |
|
LDAPMgr |
LDAP Manager LDAP Manager has a single component, LDAPMgr. The pin_channel_export component gets deployed as part of it. |
LDAPMgr_release_OS |
NA |
|
MultiDBMgr |
MultiDB Manager |
MultiDBMgr_release_OS |
oracle_brm_cm |
|
NumberMgr |
Number Manager |
NumberMgr_release_OS |
oracle_brm_cm |
|
PaymentechMgr |
Paymentech Manager |
PaymentechMgr_release_OS |
NA |
|
Pipeline |
BRE Real-Time Pipeline |
Pipeline_release_OS |
NA |
|
Pipeline_ConfMgr |
Pipeline Configuration Manager |
PipelineConfMgr_release_OS |
oracle_brm_pipeline |
|
RadiusMgr |
Radius Manager |
RadiusMgr_release_OS |
oracle_brm_cm |
|
RatedEventLoader |
Rated Event Loader, Event Extraction Manager |
REL_release_OS |
NA |
|
ResourceResMgr |
Resource Reservation Manager |
ResourceResMgr_release_OS |
oracle_brm_cm |
|
RevAssuranceMgr |
Revenue Assurance Manager |
RevAssuranceMgr_release_OS |
oracle_brm_cm |
|
SIMMgr |
SIM Manager |
SIMMgr_release_OS |
oracle_brm_cm |
|
SuspenseMgr |
Suspense Manager |
SuspenseMgr_release_OS |
oracle_brm_cm |
|
TAPRoamingmanager |
TAP Roaming Manager |
TAPRoamingMgr_release_OS |
oracle_brm_pipeline |
|
ThirdParty |
ThirdParty Applications |
ThirdParty_release_OS |
NA |
|
Timos |
Timos Data Manager |
Timos_release_OS |
NA |
|
VertexMgr |
Vertex Manager |
VertexMgr_release_OS |
NA |
|
VertexQuantumMgr |
Vertex Quantum Manager |
VertexQuantumMgr_release_OS |
NA |
|
VoucherMgr |
Voucher Manager |
VoucherMgr_release_OS |
oracle_brm_cm |
|
WirelessSuite |
GSM AAA Manager GSM Manager GPRS AAA Manager GPRS Manager Number Manager RRF Manager Services Framework Manager Services Framework AAA Manager SIM Manager You cannot choose which features to install. They are all installed. |
WirelessSuite_release_OS |
oracle_brm_cm |
Creating the BRM Source Components
You must configure the ISMP packages as source components in the Enterprise Manager Cloud Control Software Library before running the provisioning procedure. If your environment uses custom applications, you must also create source components for the applications. Use the upload source components utility to upload the ISMP packages into the Software Library.
To add the BRM ISMP packages to the Software Library:
-
Confirm the BRMComponents folder exists in the Software Library. See "Creating the Oracle Communications Folders for BRM Installers" for more information.
-
Open a shell session to the host where your Enterprise Manager Cloud Control Management Server is installed.
-
Change directories to the following location:
EM_home/gc_inst/user_projects/domains/GCDomain/default_xml/platform/swlibUtil
-
Open the upload_src.xml file for editing.
-
Edit the environment parameters in Table 4-3 for your environment.
Table 4-3 upload_src.xml Environment Parameters
Parameter Description HOSTSTR
The Enterprise Manager Cloud Control fully qualified domain name.
SID
The database SID for the Enterprise Manager Cloud Control repository.
DB_USER
The database administrative user. For example, sysman.
DB_PW
The database administrator's password.
PATH
The relative path of the BRMComponents directory in the Software Library.
FILEPATH
The file path to the location where the ISMP installers are stored. This path must be accessible from the Management Server.
-
Confirm that the listing of BRM components is consistent with the ISMP packages downloaded in your environment. The packages and names must match the operating system platform you are provisioning on. For example, the listing for the BRM Account Synch Tool installer uses the following format in the upload_src.xml file:
-
On Linux:
<DISPLAY_NAME>BRM_AccountSynchTool_7.5.0_Linux</DISPLAY_NAME>
<DESCRIPTION>AccountSynchTool_7.5.0_Linux</DESCRIPTION>
<FILE_NAME>7.5.0_Accountsynchtool_linux_32_opt.bin</FILE_NAME>
-
On Solaris:
<DISPLAY_NAME>BRM_AccountSynchTool_7.5.0_Solaris</DISPLAY_NAME>
<DESCRIPTION>AccountSynchTool_7.5.0_Solaris</DESCRIPTION>
<FILE_NAME>7.5.0_SMSSettlement_Reports_solaris_32_opt.bin</FILE_NAME>
-
-
Upload the source components configuration using the following command in the same directory:
perl upload_src_comp.pl -loglevel 2 OMS_homewhere OMS_home is the path of your Management Server's home directory. The BRM components ISMP installers are uploaded to the Software Library.
Check the upload_src_comp.log file for errors if the procedure is unsuccessful. Increase the log level to a maximum of 3 when running the perl command if more detail is needed in the utility's log.
Specifying the BRM Database
BRM requires an Oracle Enterprise Database. When provisioning either a BRM system or components you must choose whether to create a database instance or use and existing instance.
You must specify an existing database when using the BRM Basic option. See "Provisioning a Basic BRM System" for more information on provisioning a BRM system on a single host using an existing database.
Some BRM components, such as the Data Manager, Batch Rating Engine, and Real-time Pipeline, require connection to a BRM database to complete provisioning and to start the service. When provisioning one or more BRM components using the BRM Advanced option, you can specify whether to create a database or use an existing database. See "Provisioning BRM Components" for more information on specifying database information with component provisioning.
About Provisioning Multischema BRM Systems
You can use the Communications Suite Installation Procedure to provision multischema systems with up to nine secondary database schemas.
To provision multischema systems, you must run the Communications Suite Installation Procedure twice with the BRM Basic option. First you run the procedure for all secondary schemas, then you run it again for the primary schema.
See "Provisioning a Basic BRM System" for more information about how to run the Communications Suite Installation Procedure with the BRM Basic option.
See the discussion of managing a multischema system in BRM System Administrator's Guide and the discussion of installing a multischema system in BRM Installation Guide for more information about multischema architecture and management.
Provisioning a Basic BRM System
Use the BRM Basic option in the Communications Suite Installation Procedure to provision a basic system. The procedure installs the following BRM components:
-
Portal_Base
-
AccountSyncTool
-
RatedEventLoader
-
WebServicesMgr
-
BRM_JCA_Adapter
-
DM_AQ
-
PaymenttechMgr
-
EAI_FrameworkMgr
-
CollectionsMgr
-
ContentMgr
-
WirelessSuite
-
AccountMigrationMgr
To provision a BRM system:
-
Log in to the Enterprise Manager Cloud Control administration console.
-
From the Enterprise menu, select Provisioning and Patching, and then Procedure Library.
-
In the Deployment Procedure Manager, select Communications Suite Installation Procedure.
-
Click Launch.
-
Under Choose Targets, click Add.
-
Select BRM Basic.
-
Click OK.
A BRM Basic entry is added to the Choose Targets table, which displays the BRM component as a row.
-
(Optional) You can save your provisioning configuration as a custom system. This is useful when you plan to provision multiple instances of the same application on multiple targets or for backing up configurations for reuse at a later time.
To save a provisioning procedure configuration as a custom system:
-
Click Save.
The Custom System Name dialog box appears.
-
In the Name field, enter a name for the configuration.
-
Click OK.
-
-
Select the Target Name text box from the BRM row.
-
Select a managed host target from the drop down list.
The resource information for the target host appears and the Host Configurations area displays the parameters required for BRM Basic provisioning.
-
Enter the path to the location where the BRM ISMP installers are located in the BRM Installers Folder field. Click Browse to use the Remote File Browser tool.
-
In Host Configurations, provide the parameters needed by the BRM installer. Typically, you enter these values during the installer interview process. Enterprise Manager Cloud Control does not immediately validate the values you provide. See Oracle Communications Billing and Revenue Management Installation Guide for more information on installation parameters.
The BRM Basic option requires an existing database on which to install and configure the BRM instance. The procedure creates the specified database user based on the parameter values entered.
-
To install a multischema system:
-
Select Enable MultiDB.
-
From the No Of Schemas list, select the number of additional schemas.
-
Click Go.
The Add Schemas dialog box appears with fields for the number of schemas that you selected from the No Of Schemas list.
-
For each additional schema, provide values for the fields described in Table 4-4.
Table 4-4 Secondary Schema Fields
Field Description db_no
The unique database number for the secondary schema. For example, 0.0.0.2.
pin_owner
The user name for the primary database schema. For example, PIN.
pin_dm_secondary_owner
The user name for the secondary database schema. For example, PINB.
pin_dm_secondary_passwd
The password for the secondary database schema user.
pin_dm_secondary_dbname
The alias for the secondary database schema. For example, pindbhostname.
pin_dm_secondary_hostname
The machine name where the secondary DM is running.
pin_dm_secondary_port
The DM port number for the secondary database schema.
sec_pin_home
The directory on the secondary installation machine where to install BRM. For example, /home/oracle/pinhome2
This must match the value you entered in the BRM Home Directory field for the secondary schema in the BRM Configuration area under Host Configurations. The staging location for the secondary installation is the immediate child of this directory.
login_user
The user for the secondary installation system.
login_password
The password for the secondary installation system user.
-
Click Save.
-
-
(Optional) Expand Advanced and edit the default port numbers for the BRM components.
-
Click Next.
The Credentials page appears.
-
Provide the preferred credentials for the target host. See "About Host Preferred Credentials" for more information.
-
Click Next.
-
Under Schedule, specify when the procedure should run.
-
Click Next.
-
Under Review, verify your installation configuration by checking the summary, and then click Finish.
Provisioning BRM Components
You provision individual BRM components using the Communications Suite Installation Procedure BRM Advanced option. For example, configure production system components requiring a distributed architecture across multiple target hosts using this functionality.
You must deploy the ThirdParty and BRM Base packages to a target in your installation before deploying optional components. Optional components require CM and DM configuration data when using the BRM Advanced provisioning procedure. Be sure to provide the proper CM and DM parameter values, including correct host names and port numbers, for the environment your optional managers are joining. The procedure cannot validate these parameters as they are specific to your environment.
See Oracle Communications Billing and Revenue Management Installation Guide for more information about installing a distributed architecture on multiple hosts.
To provision BRM components using the BRM Advanced option:
-
Log in to the Enterprise Manager Cloud Control administration console.
-
From the Enterprise menu, select Provisioning and Patching, and then Procedure Library.
-
In the Deployment Procedure Manager, select Communications Suite Installation Procedure.
-
Click Launch.
-
Under Choose Targets, click Add.
-
Select BRM Advanced.
-
Click OK.
A BRM Advanced row is added to the Choose Targets table, which displays the component as a row.
-
(Optional) You can save your provisioning configuration as a custom system. This is useful when you plan to provision multiple instances of the same application on multiple targets or for backing up configurations for reuse at a later time.
To save a provisioning procedure configuration as a custom system:
-
Click Save.
The Custom System Name dialog box appears.
-
In the Name field, enter a name for the configuration.
-
Click OK.
-
-
Select the row for the added component and click Configure.
The Search and Select: Entities window containing a list of BRM ISMP installer packages.
-
Select the BRM packages containing the components to provision. You can select more than one component to provision for the procedure by holding the control key.
-
Click Select.
An entry for the selected installer is added to the list of systems on the Choose Targets page.
-
Select the newly added installer row in the list.
The BRM Components list appears. This list contains the BRM components included in the installers selected.
-
Select the BRM components to provision.
-
Click Add.
A row for the BRM components is added to the list of systems on the Choose Targets page.
-
Click in the Target Name field of the newly added components and select a target from the drop down list.
The component's required Host Configuration parameters appear.
-
In Host Configurations - target_name, provide the parameters needed by the BRM installer for the selected component. Typically, you enter these values during the installer interview process. Enterprise Manager Cloud Control does not immediately validate the values you provide.
The BRM Advanced option enables specifying whether to use an existing BRM database or to initialize a new database instance for use with provisioning. Set the database usage and partitioning behavior using the parameters in Table 4-5.
The procedure uses the values specified for the pin_setup.values file used during BRM configuration. For information about pin_setup.values, see the chapter about installing BRM in Oracle Communications Billing and Revenue Management Installation Guide.
When adding components to an existing BRM system, you must provide parameters for the database already in use and ensure that the procedure is not set to drop existing tables. By default, the options to initialize the database and drop all BRM tables is set to YES.
Table 4-5 Component Provisioning Database Parameters
Parameter Description Default Value SetupInitDb
Specifies whether to initialize the BRM databases.
YES
SetupCreatePartition
Specify whether to add partitions to your event tables.
Enter Yes to have the installer add 12 monthly partitions, a historic partition, and a last partition to your event tables.
Enter No if you want the installer to add only a historic partition and a last partition to the tables. You can use this partitioning layout for a simple test or demonstration system. For a production system, however, you must add purgeable partitions after installation is complete and before the system generates events.
This sets the $CREATE_PARTITIONS parameter in the pin_setup.values file to Yes.
This prompt is displayed only if you enter Yes to Partition event tables.
YES
EnablePartition
Specify whether you want to enable partitioning.
To partition any tables, you need Oracle Partitioning. If you select Yes but do not have Oracle Partitioning installed, the BRM setup program fails when it tries to create partitions.
This sets the $ENABLE_PARTITION parameter to Yes in the pin_setup.values file.
Important
If you select No and then change your mind after you've installed BRM, you will have to upgrade your BRM database from a nonpartitioned to a partitioned version before you can partition your tables.
If you plan to use Rated Event Loader to load prerated events, you must partition your event tables.
If you select Yes, you must configure pin_setup to set up any non-event partitions. Your event tables will be partitioned automatically.
YES
CLASSES_TO_BE_PARTITIONED
Assign a list of classes that you want to partition.
You cannot partition classes after you run the pin_setup utility
NA
SetupDropAllTables
Enter whether you want to drop the database tables.
If you select YES, the installer drops all existing tables on your system. This results in irrecoverable loss of data. Do not use this unless you have backed up all of your existing data.
If you select NO, the installer uses your existing BRM tables.
In test systems, select YES to reinitialize the database.
YES
CreateDatabaseTables
Enter whether you want the installer to create default BRM tablespaces for you.
Enter No to create custom tablespaces manually. You must create your tablespaces before you run the pin_setup script.
YES
-
(Optional) Expand Advanced to specify the component's configuration parameters used in the BRM pin.conf file.
-
Click Next.
The Credentials page appears.
-
Provide the preferred credentials for the target host. See "About Host Preferred Credentials" for more information.
-
Click Next.
-
Under Schedule, specify when the procedure should run.
-
Click Next.
-
Under Review, verify your installation configuration by checking the summary, and then click Finish.
Tip:
You can view the status of the provisioning process in the Procedure Activity tab. Click the procedure name in the Run column to view the procedure's status. To update the status, click Refresh. The Status Detail displays all of the provisioning procedure steps and their corresponding statuses. View any step's status by clicking on the link in the Status column. -
Rediscover the BRM target as described in "Rediscovering BRM Targets Using Guided Discovery".
Patching Applications
You can patch BRM installations using the BRM Patching Procedure. The procedure uses Enterprise Manager Cloud Control integration with Oracle Support for searching and downloading patches, then performs patch installation on managed BRM targets.
The BRM Patching Procedure does not support installing password protected patches. Only generally available patches from My Oracle Support are supported.
Install password protected patches and patches unavailable from within Enterprise Manager Cloud Control using the offline patching process. For more information about performing offline patch installation, see Oracle Enterprise Manager Lifecycle Management Administrator's Guide.
You can patch a single BRM target at a time using the BRM Patching Procedure. To patch multiple targets, run the procedure for each target individually.
Patching BRM involves the following tasks:
You can roll back the patch that was most recently applied to a BRM component or system. You can roll back patches on multiple BRM components at a time. See "Rolling Back BRM Patches".
Patching Multischema BRM Systems
To patch multischema systems:
-
Patch the target on the primary schema. See "Patching BRM".
-
Grant permissions for each secondary schema user as follows:
-
Log in to the primary database schema as a privileged user.
-
Run the following commands:
GRANT ALL ON DD_OBJECTS_T TO secondary_schema_user;
GRANT ALL ON DD_OBJECTS_FIELDS_T TO secondary_schema_user;
GRANT ALL ON DD_TYPES_T TO secondary_schema_user;
GRANT ALL ON DD_FIELDS_T TO secondary_schema_user;
-
-
Patch the targets on the secondary schemas.
-
Perform post-patch tasks for all the schemas. See "BRM Post-Patch Tasks".
Patching BRM
To patch managed BRM targets:
-
Log in to the Enterprise Manager Cloud Control administration console.
-
Ensure that the Management Agent for the target you intend to patch is up and running.
For information about verifying Management Agent status, see the discussion of controlling and configuring Management Agents in Oracle Enterprise Manager Cloud Control Administrator's Guide.
-
From the Enterprise menu, select Provisioning and Patching, then select Procedure Library.
The Deployment Procedure Manager page appears.
-
Select BRM Patching Procedure and click Launch.
-
Under Choose Targets and Patches, click Add.
The Search and Select: Targets window appears.
-
Specify the target information:
-
In the Target Type field, enter the target type.
-
In the Target Name field, enter the name of the target.
-
In the On Host field, enter the host name.
-
-
Click Search.
-
Select the BRM target to patch.
-
Click Select.
The BRM component to be patched is now listed on the Choose Targets and Patches page.
-
In the target's row, click Add Patch.
The Choose BRM Patches window appears.
-
Specify search criteria for the patch and click Search Patches.
A list of patches meeting the search criteria appears.
-
(Optional) Click the link in the ReadMe column for detailed patch information from Oracle Support.
-
Select the correct patches to apply and click Add Patches.
-
Under Target Configuration, provide the information required about your BRM target. Typically, this information includes the location of your BRM installation and database credentials.
-
Click Next.
The Credentials page appears.
-
Provide the preferred credentials for the target host. See "About Host Preferred Credentials" for more information.
-
Click Next.
-
Under Schedule, specify when the procedure should run.
-
Click Next.
-
Under Review, verify your installation configuration by checking the summary, and then click Finish.
-
Monitor the status of the patching process as described in "Monitoring BRM Patching Status".
-
Perform post-patch tasks as described in "BRM Post-Patch Tasks".
Monitoring BRM Patching Status
To monitor the status of the patching procedure:
-
Log in to the Enterprise Manager Cloud Control administration console.
-
From the Enterprise menu, select Patching and Provisioning, and then Procedure Activity.
-
In the Run column, click the name of the BRM patching procedure for which you want to monitor status.
The Procedure Steps table for the selected BRM patching procedure appears.
-
In the Name column, expand the BRM Patching Phase and host name entries.
All of the steps for the BRM patching procedure appear.
-
In the Status column, review the status of the steps.
-
In the Select column, select any step for which you want to view more details.
-
Click Refresh.
The status of all steps is updated.
-
If any steps fail, review the logs, resolve the issue, and try again.
For example, if the Automate Post Patch Steps PortalBase step fails and the Connection Manager target is down:
-
In the BRM_home/var/cm.pinlog file, search for the following line:
fm_collections_config_scenario_cache cache not specified in pin.conf
-
If the line appears, open the Connection Manager configuration file (BRM_home/sys/cm/pin.conf).
-
Add the following line anywhere in the file:
- cm_cache fm_collections_config_scenario_cache number_of_entries, cache_size, hash_size
where number_of_entries, cache_size, and hash_size are appropriate numbers for your system. For example:
- cm_cache fm_collections_config_scenario_cache 256, 40960, 54
-
Save and close the file.
-
Retry the patching procedure.
-
Ignoring Steps During BRM Patching
You can safely ignore failed BRM patching procedure steps in the following situations:
-
If a patch does not included upgrade packages, the patching procedure automatically ignores the upgrade step. However, the post-patch step may attempt to run scripts that the upgrade package would have created. Because these scripts are missing, the step fails.
-
When patching BRM on Solaris environments using Patch Set 10 with Patch 19921037, the following steps fail:
-
Stage BRM Solaris Patches
-
Unzip Solaris BRM Patches
-
To ignore a step:
-
Log in to the Enterprise Manager Cloud Control administration console.
-
From the Enterprise menu, select Provisioning and Patching, then select Procedure Activity.
The Deployment Procedure Manager page appears.
-
In the Run column, click the name of the failed patching procedure.
The Procedure Steps table for the selected BRM patching procedure appears.
-
In the Name column, expand the BRM Patching Phase and host name entries.
All of the steps for the BRM patching procedure appear.
-
Select the check box beside the failed step.
A tab with details about the step appears.
-
From the Actions menu, select Ignore.
The patching procedure continues automatically.
BRM Post-Patch Tasks
After patching BRM, perform the following tasks:
-
Verify the patch log files for any errors. By default, the patch log files are located in the following directory:
BRM_home/staging/patching/Where BRM_home is the directory where BRM is installed.
-
Verify that the testnap utility works. See Oracle Communications Billing and Revenue Management Developer's Guide for information about using testnap.
-
The patching process backs up your Pipeline Manager registry files, such as wireless.reg and wirelessRealtime.reg, and creates new ones. For each registry file, merge any configuration changes that you made in the original files to the new registry files.
For example:
-
In the new real-time pipeline registry file, search for the following section:
RealtimePipeline { ModuleName = NET_EM Module { ThreadPool { Port = -
Edit the Port entry so that the value is the same as in the backup registry file. For example:
ThreadPool{ Port = 14579
See the discussion of using registry files to configure Pipeline Manager in Oracle Communications Billing and Revenue Management System Administrator's Guide for more information about registry files.
-
-
Rediscover the BRM target as described in "Rediscovering BRM Targets Using Guided Discovery".
Viewing Applied BRM CM and Pipeline Manager Patches
To view the list of patches that have been applied to a BRM CM or Pipeline Manager target:
-
Log in to the Enterprise Manager Cloud Control administration console.
-
Navigate to the home page for the BRM or pipeline target to which you applied the patch, as described in "Viewing Home Pages".
The Patch Set Level field in the Summary displays the component's patch level.
Rolling Back BRM Patches
To roll back the most recently applied patch on one or more BRM targets:
-
Log in to the Enterprise Manager Cloud Control administration console.
-
From the Enterprise menu, select Provisioning and Patching, then select Procedure Library.
The Deployment Procedure Manager page appears.
-
From the Procedure Library table, select BRM Patching RollBack Procedure.
-
Click Launch.
-
Under Choose Targets and Patches, click Add.
The Select Targets dialog box appears.
-
Select the BRM target for whose patch you want to roll back. You can select multiple targets.
-
Click Select.
The BRM target appears in the Choose Targets and Patches table.
-
Click Next.
The Patch Analysis Report page appears, showing the BRM targets on the same host that will be rolled back.
-
Review the information on the page and click Next.
The Credentials page appears.
-
Enter the user name and password for the BRM host and click Next.
The Schedule page appears.
-
Specify when the procedure should run and click Next.
The Review page appears.
-
Verify the schedule and patch information and click Finish.
The Procedure Activity page appears.
-
(Optional) Monitor the status of the rollback as follows:
-
In the Run column, click the name of the rollback procedure.
The Procedure Steps table for the selected BRM patching procedure appears.
-
In the Name column, expand the BRM Patching RollBack Phase and host name entries.
All of the steps for the rollback procedure appear.
-
In the Status column, review the status of the steps.
-
In the Select column, select any step for which you want to view more details.
-
Click Refresh.
The status of all steps is updated.
-
Monitoring Oracle Communications Application Targets
You can monitor supported Oracle Communications application and component targets in Enterprise Manager Cloud Control. Monitoring targets enables you to maintain your Oracle Communications environment and manage incidents and alerts.
Application Management Pack for Oracle Communications provides extended metrics for Oracle Communications applications that augment standard monitoring data.
Once you have discovered and promoted your Oracle Communications targets, you can monitor a variety of metrics. You use configurable thresholds when configuring warning and critical event states notifications useful for alerting you to potential system problems.
The following monitoring procedures are supported:
See "About Conditions that Trigger Notifications" for information about the formatting of the metric conditions.
Using the Communications Applications Landing Page
Application Management Pack for Oracle Communications provides a landing page where you can view summary information about all discovered Oracle Communications targets in one place.
The Communications Applications landing page shows a list of all discovered Oracle Communications targets. Targets that are members of systems or dynamic groups are organized under their parent system or group. You can expand systems, groups, and individual targets to see related targets, including infrastructure components such as databases and WebLogic Server domains.
To use the Communications Applications landing page:
-
Log in to the Enterprise Manager Cloud Control administration console.
-
From the Targets menu, select Communications Applications.
The Communications Applications landing page appears.
-
Do any of the following:
-
Review the availability of all Oracle Communications targets.
-
Filter the list of targets by target name and lifecycle status.
-
Expand top-level systems, groups, or targets to see the status of related targets.
-
View the availability chart and incidents and violations table for an individual target or system by highlighting its row in the list of targets.
-
View details about an incident or violation by clicking its name in the Incidents and Violations table.
-
View the home page for a target, system, or group by clicking its name in list of targets.
-
Set up data discrepancy reports by clicking Data Discrepancy. See "Identifying Discrepancies in Shared Data" for more information.
-
Discover new Oracle Communications targets by clicking Add. See "Discovering and Rediscovering Targets Using Guided Discovery" for more information.
-
Edit configurations for a target by highlighting its row in the list of targets and clicking Configure. See "Managing Configuration" for more information.
-
View details about infrastructure components by clicking the Infrastructure Targets tab.
-
Viewing Home Pages
You can view home pages for applications, components, and suite level targets managed in Enterprise Manager Cloud Control. These home pages provide an overview of the target, including information such as availability, metric alerts and other performance data.
To view a home page:
-
Log in to the Enterprise Manager Cloud Control administration console.
-
Do either of the following:
-
To select the target from the list of all targets:
-
From the Targets menu, select All Targets.
-
In the Target Type tree, select the type of target you want to view.
-
In the list of targets, click the name of the target you want to view.
The target's home page appears.
-
-
To select the target from the Communications Applications landing page, which contains a list of Oracle Communications targets only:
-
From the Targets menu, select Communications Applications.
The Communications Applications landing page appears.
-
From the list of targets, click the name of the target you want to view.
The target's home page appears.
-
-
You can customize target home pages by adding new regions and changing the page layout. Not all regions that you can add are applicable to all targets. For example, if you add an ECE-related region to the home page for an OSM target, there will be no data to display in that region.
See the discussion of personalizing Cloud Control in Oracle Enterprise Manager Cloud Control Administrator's Guide for more information about customizing pages.
Viewing Target Metrics
You can view the details about individual metrics collected for Oracle Communications targets, including values, severity, and alerts that are triggered for that metric.
To view data from individual metrics for Oracle Communications application targets:
-
Log in to the Enterprise Manager Cloud Control administration console.
-
Navigate to the home page for the target for which you want to view metrics, as described in "Viewing Home Pages".
-
Under the target's name, from the target type menu, select Monitoring and then All Metrics.
-
In the navigation tree, expand the metric category and select the metric you want to view.
Monitoring Log Files
You can use Application Management Pack for Oracle Communications to monitor application log files for specific error patterns and send alerts for targets when patterns are found.
For BSS targets, you can view log files within the Enterprise Manager Cloud Control administration console. See "Viewing and Managing Log Files".
For BRM, ECE, NCC, Offline Mediation Controller, Oracle AIA, and OSM targets, Application Management Pack for Oracle Communications provides default error pattern templates for generating alerts based on log files. You can edit the templates to add custom error patterns.
The maximum number of alerts generated and shown for the log file monitoring metric for Oracle Communications targets is different for different target types:
-
For targets that have large log files that are not regularly rotated, such as BRM, the maximum number of alerts generated for one error pattern is set to 20. After 20 occurrences of one pattern, the log file monitoring metric skips that pattern and checks the next pattern. This prevents performance degradation when processing large log files with many occurrences of the same error pattern.
-
For targets that rotate log files (external to Enterprise Manager Cloud Control), such as OSM, the maximum is set much higher. Processing time is not a performance issue for regularly-rotated log files.
You can also include error pattern templates in monitoring templates. For more information about log file monitoring and using monitoring templates, see Oracle Enterprise Manager Cloud Control Administrator's Guide.
Viewing and Managing Log Files
You can view and manage log files for BSS targets.
To view and manage log files:
-
Log in to the Enterprise Manager Cloud Control administration console.
-
Navigate to the home page for the target for which you want to view log files, as described in "Viewing Home Pages".
-
In the Log Files Contents or Quick Links region, click View Log Files. For PDC, you choose between domain logs, synchronization logs, and transformation engine logs.
The list of log files for the target appears.
-
(Optional) Filter the list by entering a value in Filter log files field and clicking Filter log files.
-
Select a log from the list to view the contents.
-
(Optional) Click Download to save a copy of the log file to your local machine.
-
(Optional) Click Clear Log File to clear the contents of the log file.
-
(Optional) For BRM Connection Manager targets:
-
Click EnableDebugging to enable debugging.
-
Click DisableDebugging to disable debugging.
Enabling debugging sets the log to debug dynamically without needing to invoke a BRM utility to restart the target. If you disable debugging, you must manually debug and restart the target.
-
Applying Error Pattern Templates to Targets
To apply error pattern templates to targets:
-
Log in to the Enterprise Manager Cloud Control administration console.
-
From the Enterprise menu, select Provisioning and Patching and then Procedure Library.
The Deployment Procedure Manager page appears.
-
Select AMS Error Patterns Editing Procedure and click Launch.
The Choose Targets page appears.
-
From the Select Application menu, select the target type for which you are editing or applying error templates.
The content from the error pattern file for that target type appears.
-
(Optional) Add custom error patterns and pattern help to the error pattern file content. Use the following format for patterns and help:
@target_PATTERNS = (
"common_string##common_string",
...
%target_ERROR_HELP = (
"common_string##common_string" => "help_message",
where:
-
target is different for different target types. For example, for BRM and NCC, target is PCM. This line appears automatically in the file.
-
common_string is the common content that always appears for this error.
-
help_message is a short description to help interpret the error.
For example, the following error line appears in the diagnostic log for an OSM node, where the bold content is the common content:
[OSM_managed_server] [ERROR] [] [oracle.communications.ordermanagement.compliance.agent.ComplianceAgent] [tid: [STANDBY].ExecuteThread: '2' for queue: 'weblogic.kernel.Default (self-tuning)'] [userId: user] [ecid: id] [APP: oms] Skipping copy to /osm_domain_home/osm_compliance/scripts/copyComplianceWLSTScripts.bat since target is newer than source.
To monitor the OSM logs for this error pattern, the pattern appears in the file content as follows:
@PCM_1_PATTERNS = (
...
"agent.ComplianceAgent##Skipping copy to##since target is newer than source.",
...
%PCM_1_ERROR_HELP = {
...
"agent.ComplianceAgent##Skipping copy to##since target is newer than source." => "Compliance",
...
-
-
Click Next.
The Selected Targets page appears.
-
Review the list of targets to which the error pattern will be applied and click Next.
The Schedule page appears.
-
Under Schedule Configuration, specify when the procedure should run.
-
Click Next.
-
Review the error patterns and targets and click Finish.
Any changes made to the error patterns are saved and the error patterns are applied to the specified targets.
-
(Optional) Review the status of the procedure on the Procedure Activity tab.
-
(Optional) Customize thresholds for alerts and configure corrective actions for log file pattern matching. See "Configuring Alerts" for more information.
Configuring Alerts
Application Management Pack for Oracle Communications lets you configure when to generate alerts and notify administrators. You can generate alerts based on thresholds for individual metrics and based on larger incidents. You can specify automated responses to alerts by using corrective actions and automatically escalate incidents using incident rules.
About Incident Management
In addition to configuring alerts for specific metrics, you can use the Enterprise Manager Cloud Control incident management functionality to monitor larger trends in service disruption that can impact multiple targets and domains.
For example, if you are monitoring a host and an individual metric such as CPU utilization exceeds the acceptable threshold, it may or may not indicate a larger issue with the host. However, if all metrics related to the host exceed acceptable thresholds, it indicates extreme load on the host and represents a larger problem. You can use incident management to monitor such issues together.
You can also automate the creation, assignment, priority, notification, and escalation of incidents by using incident rules.
See the discussion of using incident management in Oracle Enterprise Manager Cloud Control Administrator's Guide for more information.
Configuring Metric Monitoring Thresholds and Alerts
Application Management Pack for Oracle Communications provides default thresholds for critical metrics in supported applications. Enterprise Manager Cloud Control also includes default thresholds for host metrics including CPU and physical memory usage. You can define additional metrics needed for your environment.
To better suit the monitoring needs of your organization, you can edit the thresholds provided and define new thresholds. When defining thresholds, choose acceptable values to avoid unnecessary alerts.
You can establish thresholds that quickly provide important information by defining baselines reflecting how your system runs for a normal period.
To edit alert thresholds for Oracle Communications targets:
-
Log in to the Enterprise Manager Cloud Control administration console.
-
Navigate to the home page for the target for which you want to configure metrics and thresholds, as described in "Viewing Home Pages".
-
Under the target's name, from the target type menu, select Monitoring, and then Metric and Collection Settings.
-
Configure the monitoring thresholds as required for your environment by clicking the Edit pencil icon for a metric.
-
Edit the Warning Threshold and Critical Threshold fields.
Click Add to create a monitored object for the selected metric.
-
Click Continue.
-
Click OK to save your changes.
For detailed information on configuring Enterprise Manager Cloud Control notification settings, see Oracle Enterprise Manager Cloud Control Administrator's Guide.
Adding Corrective Actions
Corrective actions let you specify automated responses to alerts. Corrective actions ensure that routine responses to alerts are automatically executed, ensuring problems are dealt with before they impact business operations. By default, Application Management Pack for Oracle Communications does not include any corrective actions set for alerts generated by Oracle Communications applications.
See the section on creating corrective actions in Oracle Enterprise Manager Cloud Control Administrator's Guide for more information on configuring corrective actions.
To add corrective actions for warnings and critical alerts:
-
Log in to the Enterprise Manager Cloud Control administration console.
-
Navigate to the home page for the target for which you want to configure collection schedules, as described in "Viewing Home Pages".
-
Under the target's name, from the target type menu, select Monitoring, and then Metric and Collection Settings.
-
Click the edit pencil icon for the metric you want to configure a corrective action for.
-
Under Monitored Objects, click Edit.
-
Under Corrective Actions for Warning or Critical, click Add.
The Add Corrective Action page appears.
-
From the menu, select a corrective action.
-
Click Continue.
-
Enter the required information to define the corrective action.
-
Click Continue.
Configuring Collection Schedules
To configure collection schedules for collection items and metrics:
-
Log in to the Enterprise Manager Cloud Control administration console.
-
Navigate to the home page for the target for which you want to configure collection schedules, as described in "Viewing Home Pages".
-
Under the target's name, from the target type menu, select Monitoring, and then Metric and Collection Settings.
-
Configure the Collection Schedule time interval by clicking on the currently set interval link for a listed metric.
-
Set the new Frequency Type and Repeat Every values, and then click Continue.
-
Click OK to save your changes.
Extending Monitoring Metrics
You can extend the ready-to-use metrics by using Enterprise Manager Cloud Control metric extensions. Metric extensions are metrics that you create to fit the needs of your environment. You can apply metric extensions to individual targets or large numbers of targets by using monitoring templates.
See "Creating Metric Extensions" for detailed examples of how to create metric extensions to monitor custom log files for a BRM target and Java Messaging Service (JMS) for an OSM system target.
See Oracle Enterprise Manager Cloud Control Administrator's Guide for information about using monitoring templates and metric extensions.
Creating Metric Extensions
The examples in the following procedure demonstrate how to create metric extensions to monitor a custom log file for a BRM target or JMS for an OSM system target.
To create metric extensions:
-
For custom log file monitoring, create a script to parse the error patterns in your custom log files. You can use the default scripts available with the plug-in as a template. The default scripts are located in the AMP_home/agent/scripts directory.
-
Log in to the Enterprise Manager Cloud Control administration console.
-
From the Enterprise menu, select Monitoring and then Metric Extensions.
The Metric Extensions page appears.
-
From the Create menu, select Metric Extension.
The Create New: General Properties page appears.
-
Enter the values for the general properties:
-
From the Target Type menu, select the target type for which you are creating a metric extension.
For example:
-
For BRM custom log file monitoring, Oracle BRM DMO
-
For OSM JMS monitoring, Order and Service Management System
-
-
In the Name ME$ field, enter a name for the metric extension.
This name must be unique for this target type. The name is prefixed with ME$.
For example:
-
For BRM log file monitoring, BRM_CDR_SAMPLE
-
For OSM JMS monitoring, OSM_JMS_SAMPLE
-
-
In the Display Name field, enter a display name for the metric extension. _SAMPLE.
This name must be unique for this target type, but the value can be the same as for the Name ME$ field because the display name is not prefixed with ME$.
For example:
-
For BRM log file monitoring, BRM_CDR_SAMPLE
-
For OSM JMS monitoring, OSM_JMS_SAMPLE
-
-
From the Adapter menu, select an adapter type.
For example:
-
For BRM log file monitoring, OS Command - Multiple Columns
-
For OSM JMS monitoring, Java Management Extensions (JMX)
-
-
In the Description field, enter a description of the metric.
-
-
Enter the values for collection schedule properties:
-
From the Data Collection options, select Enabled.
-
From the Use of Metric Data options, select Alerting and Historical Trending.
-
In the Upload Interval field, enter 1.
-
From the Collection Frequency menu, select By Minutes.
-
In the Repeat Every field, enter 15.
-
-
Click Next.
The Adapter page appears.
-
Enter the values for the properties:
For example:
-
For BRM log file monitoring:
-
In the Command field, enter %perlBin%%/perl.
-
In the Script field, enter the path to the log file parsing script using the available variables.
For example, %scriptsDir%/parse_cdr_log.pl "%installLoc%" "new_comp_log" %scriptsDir%
-
Leave the Arguments field blank.
-
In the Delimiter field, enter a vertical bar (|).
-
In the Starts With field, enter em_result=.
-
In the Upload Custom Files region, click Upload.
-
Click Choose File.
-
Navigate to the log file parsing script and select it.
-
Click OK.
-
-
For OSM JMS monitoring:
-
Click Browse MBeans.
The Select MBean and Attributes dialog box appears
-
In the Select Target field, search for and select the OSM system for which you want to create the monitoring extension.
-
Click List MBeans.
The MBeans for the selected target appear.
-
Select the osmWsJmsWorkManager MBean.
-
Select the following attributes:
FairShareRequestClass
Type
ResponseTimeRequestClass
MinThreadsConstraint
MaxThreadsConstraint
WorkManagerShutdownTrigger
IgnoreStuckThreads
DeploymentOrder
-
Click Select.
The MBean is added to the Metric field and the attributes are added to the Column Order field in the order that you selected them.
-
-
-
Click Next.
The Columns page appears.
-
Add new metric columns corresponding to the adapter output.
For example:
-
For BRM log file monitoring, use the order and details in Table 4-6.
Table 4-6 BRM Log File Monitoring Metric Extension Column Properties
Name Display Name Column Type Value Type Comparison Operator Warning Critical log_file_name
Oracle BRM Log File Path
Data Column
String
NA
NA
NA
log_file_match_pattern
Match pattern in Perl
Key Column
String
NA
NA
NA
log_file_match_pattern_desc
Error message help
Data Column
String
NA
NA
NA
log_file_match_count
Log file patern match occurance count
Data Column
Number
>
1
2
-
For OSM JMS monitoring, use the order and details in Table 4-7. Leave the alert threshold columns blank.
Table 4-7 OSM JMS Monitoring Metric Extension Column Properties
Name Display Name Column Type Value Type FairShareRequestClass
FairShareRequestClass
Data Column
String
Type
Type
Data Column
String
ResponseTimeRequestClass
ResponseTimeRequestClass
Data Column
String
MinThreadsConstraint
MinThreadsConstraint
Data Column
String
MaxThreadsConstraint
MaxThreadsConstraint
Data Column
String
WorkManagerShutdownTrigger
WorkManagerShutdownTrigger
Data Column
String
IgnoreStuckThreads
IgnoreStuckThreads
Data Column
String
DeploymentOrder
DeploymentOrder
Data Column
Number
-
-
Click Next.
-
From the Host Credentials options, select Use Default Monitoring Credentials.
-
Test the metric extension:
-
Click Next.
The Test page appears.
-
In the Add Targets table, click Add.
The Select Targets dialog box appears.
-
Select a target for which to test the metric extension and click Select.
-
Click Run Test.
-
Review the results in the Test Results region.
-
-
Click Finish.
The metric extension is created.
-
Highlight the newly-created metric extension.
-
From the Actions menu, select Save As Deployable Draft.
-
Highlight the newly-saved metric extension.
-
From the Actions menu, select Publish Metric Extension.
The metric extension is ready to be deployed to targets.
You can deploy metric extensions to individual targets by using the Actions menu. You can deploy metric extensions to multiple targets, including groups of targets, by adding them to monitoring templates and applying the monitoring templates to targets.
For information about deploying metric extensions, creating monitoring templates, adding metric extensions to monitoring templates, and applying monitoring templates to targets, see Oracle Enterprise Manager Cloud Control Administrator's Guide.
About Conditions that Trigger Notifications
Management Agents continuously collect metrics on the health and performance of your Oracle Communications applications and host targets and return the information to the Management Server. Enterprise Manager Cloud Control generates alerts and notifications when metric values exceed preset conditions notifying you of potential issues with your environment.
Application Management Pack for Communications includes default conditions with thresholds for metrics such as application process up/down status, CPU and memory usage by a process, and transaction latency. You can customize the conditions containing the metric thresholds using the Enterprise Manager Cloud Control administration console.
See "Configuring Metric Monitoring Thresholds and Alerts" for information on setting thresholds.
Table 4-8 describes each attribute in a condition.
Table 4-8 Condition Attributes
| Attribute | Description |
|---|---|
|
Condition Name |
The name of the condition. |
|
Evaluation and Collection Frequency |
The rate at which the metric is collected and evaluated to determine whether it has crossed its threshold. The evaluation frequency is the same as the collection frequency. |
|
Upload Frequency |
The rate at which the Management Agent moves data to the Management Repository. For example, upload every nth collection. The upload frequency for a metric comes from the Enterprise Manager default collection file for that target type. This column is present in the Metric Collection Summary table only when the Upload Frequency is different from the Collection Frequency. |
|
Operator |
The comparison method Enterprise Manager Cloud Control uses to evaluate the metric value against the threshold values.
|
|
Default Warning Threshold |
Value that indicates whether a warning alert should be initiated. If the threshold is reached for the number of consecutive occurrences, a warning alert is triggered. |
|
Default Critical Threshold |
Value that indicates whether a critical alert should be initiated. If the threshold is reached for the number of consecutive occurrences, a warning alert is triggered |
|
Consecutive Number of Occurrences Preceding Notification |
Consecutive number of times a metric's value reaches either the warning threshold or critical threshold before a notification is sent. |
|
Alert Text |
Message indicating why the alert was generated. See the chapter on managing alerts in Oracle Enterprise Manager Cloud Control Administrator's Guide for information on formatting alert text. |
See the overview of key default collection metadata elements and attributes in Oracle Enterprise Manager Cloud Control Extensibility Programmer's Reference for more information about using and customizing collection item conditions in target definition files.
Table 4-9 provides an example of a metric attributes summary table. Collected metrics for each Oracle Communications application with default conditions are summarized in similar tables in the monitoring chapters. The table shows the attributes that trigger warning or critical notifications, and when configurable, the threshold values.
Table 4-9 Sample Conditions Summary Table
| Condition Name | Evaluation and Collection Frequency | Upload Frequency | Operator | Default Warning Threshold | Default Critical Threshold | Consecutive Number of Occurrences Preceding Notification | Alert Text |
|---|---|---|---|---|---|---|---|
|
CANCEL_MAX_LATENCY |
5 minutes |
5 minutes |
GT |
10000000 ns |
12500000 ns |
1 |
Bytes sent by the server are %value% |
Using Blackouts
Blackouts let you suspend data collection for targets. You can use blackouts for targets during scheduled maintenance or downtime, or predictable peak usage time to keep your monitoring data consistent and prevent Enterprise Manager Cloud Control from generating alerts during known periods of abnormal system activity.
You can define blackouts for individual targets, groups of targets on different hosts, and all targets on the same host. You can schedule on-demand blackouts, one-time blackouts, and recurring blackouts. You can schedule blackouts with definite and indefinite duration, and change the duration of blackouts currently in effect.
See the chapter about using blackouts in Oracle Enterprise Manager Cloud Control Administrator's Guide for more information.
Monitoring Groups of Targets
You can use Enterprise Manager Cloud Control systems and groups for monitoring groups of targets in the administration console.
Application Management Pack for Oracle Communications creates system targets when you discover the following applications:
-
ASAP (Comms Suite target)
-
BRM (Billing and Revenue Management target)
-
ECE (Oracle ECE Cluster target)
-
OSM (Comms Suite target)
-
UIM (Comms Suite target)
Enterprise Manager Cloud Control also creates infrastructure system targets, such as Oracle WebLogic Domain and SOA Infrastructure targets.
In addition to the ready-to-use systems, you can create generic systems and dynamic groups. See "About Generic Systems" and "About Dynamic Groups".
Each generic or read-to-use system has a home page from which you can monitor metrics related to the system members. See "Viewing System Home Pages".
About Generic Systems
Generic systems are groups of managed targets. Only targets that you specify as members of a generic system are added to the system.
You can use generic systems to group:
-
Targets that comprise a collection of integrated products, as in an Oracle Rapid Service Design and Order Deliver (RSDOD) or Rapid Offer Design and Order Delivery (RODOD) solution
-
Targets in a highly-available BRM environment with services across hosts used for different deployment model
You create a new generic system and add members to it with the following methods:
-
By selecting the Enable Logical Grouping option and creating a new system or adding targets to an existing system when discovering and promoting targets as described in "Discovering and Rediscovering Targets Using Guided Discovery" and "Promoting Discovered Targets".
-
By creating the system and then adding already discovered targets to it. See the overview of relationships in Oracle Enterprise Manager Lifecycle Management Administrator's Guide.
Viewing System Home Pages
You can monitor the overall health of your system and access more details about incidents, jobs, and unavailable or incompliant targets. You can also access the topology view to see the system topology and relationships between targets in the system.
To monitor the default BRM and Comms Suite systems, or generic systems you have created:
-
Log in to the Enterprise Manager Cloud Control administration console.
-
From the Targets menu, select Systems.
-
In the Search list, select Billing and Revenue Management, Comms Suite, or Generic System.
-
Do one of the following:
-
For 12c, click the right arrow icon.
-
For 13c, click the magnifying glass icon.
-
-
Select a system from the list.
The home page for that system appears.
The home page for generic system targets organizes metrics into the regions described in Table 4-10.
Table 4-10 Regions on the Generic System Home Page
| Region | Description |
|---|---|
|
General |
Lists the user who created the system and whether privilege propagation is enabled in Enterprise Manager Cloud Control. |
|
Overview of Incidents and Problems |
Summarizes incidents and problems over the last 24 hours and the last 7 days. |
|
Jobs Activity |
Summarizes jobs started in the last 7 days. |
|
Status |
Summarizes the availability of the system overall and of the targets in the system. Lists the targets that have been down the most in the last 24 hours. |
|
Compliance Summary |
Summarizes any compliance evaluations, violations, and scores for the targets in the system. |
|
Dependent Targets |
Lists any targets dependent on the targets in the system. |
You can see a full list of metrics collected for a system target and you can monitor the data that an individual metric collects for the target. See "Viewing Target Metrics" for information about accessing the list of metrics.
About Dynamic Groups
Dynamic groups are groups to which targets are added automatically based on membership criteria. You define the membership criteria and, when new targets that meet the criteria are discovered, they are automatically added to the dynamic group.
You can create a hierarchy of dynamic groups by assigning a parent dynamic group. See "Creating Hierarchical Dynamic Groups". By using hierarchical dynamic groups, you can automatically group functionally distinct target types, such as BSS and OSS targets, into one solution, such as RODOD.
Each dynamic group that you create has its own monitoring home page, which you can use to monitor all members of the group in one place. You can customize the group home page to include additional relevant monitoring metrics. See "Viewing Group Home Pages".
The Oracle Communications Applications landing page in Enterprise Manager Cloud Control also shows Communications targets organized in dynamic groups.
Application Management Pack for Oracle Communications includes target properties that you can use as membership criteria for dynamic groups. These properties let you group targets in a variety of ways, for example, by target lifecycle status (development or production system), or line of business (BSS or OSS).
You can enter values for these properties during target discovery and promotion, or from the home page of a target that has already been discovered. See "Adding Targets to Dynamic Groups".
See the discussion of dynamic groups in Oracle Enterprise Manager Cloud Control Administrator's Guide for more information about using dynamic groups.
Creating Hierarchical Dynamic Groups
This section describes how to create a hierarchy of dynamic groups. The procedure includes examples that create a parent dynamic group for RODOD applications and subgroups for OSS and BSS development and production systems.
To create a hierarchy of dynamic groups:
-
Log in to the Enterprise Manager Cloud Control administration console.
-
From the Targets menu, select Groups.
-
(Optional) Create a parent group. See the discussion of managing groups in Oracle Enterprise Manager Cloud Control Administrator's Guide. The parent group can be a regular or dynamic group.
-
From the Create menu above the list of groups, select Dynamic Group.
The Create Dynamic Group page appears.
-
In the Name field, enter a name for the group.
For example:
-
BSS Production
-
BSS Development
-
OSS Production
-
OSS Development
-
-
(Optional) If you are using hierarchical groups:
-
Next to the Parent Groups field, click Add.
The Search and Select: Targets dialog box appears.
-
Select a parent group, for example RODOD Parent, and click Select.
The group is added to the Parent Groups field.
-
-
Click Define Membership Criteria.
The Define Membership Criteria page appears.
-
Next to any applicable the fields, click the magnifying glass icon. For example:
-
To create groups for BSS or OSS systems, select the icon next to the Line of Business field.
-
To create groups for production or development systems, select the icon next to the Lifecycle Status field.
-
-
Move elements from the list of available values to the list of selected values. For example:
-
For BSS groups, move the BSS element from the list of available values to the list of selected values.
-
For OSS groups, move the OSS element from the list of available values to the list of selected values.
-
For development groups, move the Development element from the list of available values to the list of selected values.
-
For production groups, move the Production element from the list of available values to the list of selected values.
-
-
Click Select.
The values are added to the fields.
-
Click OK.
The membership criteria are added.
-
Click OK.
The group is created and a success message appears. Any targets that meet the membership criteria are automatically added to the group.
-
Click OK.
Adding Targets to Dynamic Groups
You can provide values for the target properties used to define dynamic group membership, such as Line of Business and Lifecycle Status, during discovery or promotion. You can also edit target properties after discovering and promoting targets to add them to dynamic groups.
To edit target properties after discovery and promotion:
-
Log in to the Enterprise Manager Cloud Control administration console.
-
Navigate to the home page for the target that you want to add to a dynamic group, as described in "Viewing Home Pages".
-
From the target type menu, select Target Setup and then Properties.
The Target Properties page appears.
-
Click Edit.
-
Edit the target properties as relevant. For example:
-
In the Line of Business field, enter BSS or OSS.
-
From the Lifecycle Status menu, select Development or Production.
-
-
Click OK.
The properties are saved and the target is added to any dynamic groups for which it meets the membership criteria.
Viewing Group Home Pages
Group home pages display information about all targets that are members of the group. To view a group's home page:
-
Log in to the Enterprise Manager Cloud Control administration console.
-
From the Targets menu, select Groups.
The Groups page appears.
-
Click the name of the group for which you want to view the home page.
The group's home page appears.
By default, a group home page includes regions that give general information about the group members. You can customize group home pages by adding new regions for the specific target types within the group.
For example, for a RODOD group you can add regions for monitoring metrics for the following elements:
-
Incoming orders, order and task throughput, order lifecycle times, and order fallout
-
Error backlog trends and fault summaries
-
Database usage and alerts
-
Status of all group members
-
Versioning and patching information
See the discussion of personalizing Cloud Control in Oracle Enterprise Manager Cloud Control Administrator's Guide for more information about customizing pages.
Monitoring Host and Foundational Software Targets
Oracle Communications applications rely on host health and performance. Enterprise Manager Cloud Control provides the following functions used in monitoring hosts and foundational software:
See "Monitoring Oracle Communications Application Targets" for information about monitoring supported Oracle Communications application targets.
Monitoring Basic Target Collection Items and Metrics
Enterprise Manager Cloud Control monitors basic collection item (non-metric) and metrics for all managed host targets. The Management Agent installed on a managed host provides system information including software and hardware configuration, status, health, performance, and storage.
See the chapter on enterprise monitoring in Oracle Enterprise Manager Cloud Control Administrator's Guide for more information on monitoring, managing incidents, and notifications.
Monitoring Oracle Fusion Middleware Targets
Enterprise Manager Cloud Control provides comprehensive monitoring of Fusion Middleware, Oracle Service-Oriented Architecture (SOA), and Coherence cluster targets. You use the monitoring capabilities to monitor the domains and clusters on which some Oracle Communications applications run.
See the chapters about managing Fusion Middleware, SOA, and Coherence in Oracle Enterprise Manager Cloud Control Oracle Fusion Middleware Management Guide for more information about discovering and monitoring these targets.
You must discover and promote SOA targets before discovering Oracle AIA targets. Discovering the SOA targets lets you resolve system faults in bulk for the AIA targets that you are monitoring. See "Viewing and Recovering from Faults" for more information.
Monitoring Oracle Enterprise Database Targets
Enterprise Manager Cloud Control monitors and manages Oracle Enterprise and Exadata Databases used by Oracle Communications applications. For more information on monitoring databases, see the Enterprise Manager Cloud Control Documentation database management and Exadata Database Machine documents available at:
Starting and Stopping Application Processes
You can start and stop supported Oracle Communications application processes managed as targets using the Enterprise Manager Cloud Control administration console. See the following sections for information on controlling application processes:
Starting and Stopping BSS Processes
You can start, stop, and restart application processes for BSS targets in the Enterprise Manager Cloud Control administration console. See one of the following sections, depending on the application:
-
See "Starting and Stopping BRM, ECE, NCC, and Offline Mediation Controller Processes" for:
-
BRM systems and components, including custom components.
-
ECE nodes.
-
NCC components.
-
Offline Mediation Controller administration server and nodes.
-
-
See "Starting and Stopping PDC Processes" for PDC targets.
Starting and Stopping BRM, ECE, NCC, and Offline Mediation Controller Processes
You start, stop, and restart processes for BRM, ECE, NCC, and Offline Mediation Controller from the home page of the target in the Enterprise Manager Cloud Control administration console.
When starting or stopping all BRM processes, only the BRM components included in the pin_ctl.conf file will be started or stopped. You cannot start or stop all processes for BRM pipeline components.
If you have custom BRM components, such as cloned data managers, start and stop scripts for these must exist and they must be included in the pin_ctl.conf file. See Oracle Communications Billing and Revenue Management Developer's Guide for more information about custom components.
See the discussion of customizing the pin_ctl utility environment variables in Oracle Communications Billing and Revenue Management System Administrator's Guide for more information about specifying components in the pin_ctl.conf file.
To start and stop processes:
-
Log in to the Enterprise Manager Cloud Control administration console.
-
Navigate to the home page of the target for which you want to start or stop processes as decribed in "Viewing Home Pages".
-
To stop or start all BRM processes from the home page for the BRM system target:
-
Click either STOP ALL or START ALL.
-
(Optional) Monitor the status of the processes under Status.
-
-
To start or stop and restart an individual BRM component or other BSS target from the home page for the target:
-
In the Summary area, click Start, Stop, or Restart. You may need to scroll down to see the buttons.
-
(Optional) Monitor the status of the process under Status.
-
Starting and Stopping PDC Processes
You start and stop PDC processes from the home page of the administration server target to which PDC is deployed.
To start or stop PDC processes:
-
Log in to the Enterprise Manager Cloud Control administration console.
-
Navigate to the PDC target's home page as described in "Viewing Home Pages".
-
In the Quick Links region, select Process Management.
The home page for the PDC administration server within the WebLogic Server domain appears.
-
Click Start Up or Shut Down.
The Start Up or Shut Down page appears.
-
Provide details as needed for your environment and click OK.
See the discussion of shutting down, starting up, or restarting a Middleware target in Oracle Enterprise Manager Cloud Control Oracle Fusion Middleware Management Guide for information about the details you can provide on the Start Up or Shut Down page.
Starting and Stopping Domains Hosting Oracle Communications Applications
You can use Enterprise Manager Cloud Control to start and shutdown managed Oracle WebLogic Server domains hosting Oracle Communications applications. For example, you can start a WebLogic Server domain hosting OSM or PDC.
To start and stop WebLogic Server domains:
-
Log in to the Enterprise Manager Cloud Control administration console.
-
From the Targets menu, select Middleware.
The managed Middleware targets list appears.
-
Click the name of the domain to be controlled.
The selected middleware target's home page appears.
-
Under the target's name, from the system type menu, select Control.
-
Click Start Up or Shutdown for the desired operation.
The Credentials page appears.
-
Specify the required credential parameters.
-
Click OK.
-
Go to the middleware target's home page and confirm that the domain has either started up or shutdown.
Managing Configuration
You can view and compare configurations for managed targets, including systems and individual components. You can also edit configuration for BRM targets. See the following sections for information about performing configuration tasks:
-
Viewing Configurations: Applies to BRM, ECE, NCC, Offline Mediation Controller, OSM, PDC, and UIM.
-
Editing BRM Configurations: Applies to BRM system and component targets.
-
Comparing Configurations: Applies to BRM, ECE, NCC, Offline Mediation Controller, OSM, PDC, and UIM.
You can view, edit, and compare configuration of custom BRM components, such as cloned data managers, in the same way as for ready-to-use components. Configuration management for custom components requires that a pin.conf file exists in the BRM_home/sys/custom_component directory, where custom_component is the name of the custom component.
Enterprise Manager Cloud Control retains configuration changes and history as part of Configuration Management. See the chapter about managing configuration information in Oracle Enterprise Manager Lifecycle Management Administrator's Guide for more information at:
http://docs.oracle.com/cd/E24628_01/em.121/e27046/config_mgmt.htm#EMLCM11614
Viewing Configurations
You view system and component configurations using the Enterprise Manager Cloud Control administration console.
To view configurations:
-
Log in to the Enterprise Manager Cloud Control administration console.
-
Navigate to the home page for the target for which you want to view configurations, as described in "Viewing Home Pages".
-
Under the target's name, from the target type menu, select Configuration and then one of the following:
-
For 12c, Last Collected.
-
For 13c, Latest.
The configuration viewer for the selected target appears.
-
Table 4-11 describes the configuration viewer tabs.
Table 4-11 Configuration Viewer Tabs
| Tab | Description |
|---|---|
|
Configuration Properties |
Displays general configurations for the target, including host information, configuration parameters, and important directories. Selecting elements or system members in tree table displays the configurations related to those elements. |
|
System Structure |
Shown for system targets, contains an expandable and selectable listing of the system's installed and managed targets. |
|
Immediate Relationship |
Displays the immediate relationships of the target to other selectable targets. |
|
Member Of |
Lists selectable target component's membership in system targets. |
|
Uses |
Lists selectable targets used by the target. |
|
Used By |
Lists selectable targets using the target. |
Editing BRM Configurations
You can edit configuration files for BRM targets by using Enterprise Manager Cloud Control.
Use the Edit Configurations for BRM Targets procedure for changing the configuration of a managed BRM component target. You can edit multiple BRM component configurations at a time.
To run the procedure:
-
Log in to the Enterprise Manager Cloud Control administration console.
-
Navigate to the home page for the BRM target for which you want to edit configurations, as described in "Viewing Home Pages".
-
In the Components Installed region, click the link to the component you want to configure.
The home page for the BRM component appears.
-
In the Quick Links region, click Edit Configurations.
The Edit Configurations for BRM Targets procedure is launched.
-
Under Choose BRM Targets, click Add.
The Search and Select: Targets window containing a list of managed BRM component targets appears.
-
Select the managed BRM targets to edit.
-
Click Select.
The selected components are added to the Choose BRM Targets table, which displays the component as a row.
-
Select the row for the added component.
The component's Configuration parameter in the Configurations - Name Value Mode appears. You edit in a text editor by setting the Config Mode value in the target row to File.
-
In Component Configurations - mode, provide the updated configuration parameters.
Note:
if you are editing the configuration of a Connection Manager Proxy, DM-EMAIL, or DM-FUSA target to which a patch has been applied, the value in the target_type.qm_port field will contain a dash (-). For example:dm_email.qm_port -1234Do not remove this dash when updating the port number.
-
Click Next.
The Credentials page appears.
-
Provide the preferred credentials for the target host. See "About Host Preferred Credentials" for more information.
-
Click Next.
-
Under Schedule, specify when the procedure should run.
-
Click Next.
-
Under Review, verify your new configuration by checking the summary, and then click Finish.
-
Rediscover the BRM target as described in "Rediscovering BRM Targets Using Guided Discovery".
Tip:
You can view the status of the configuration process in the Procedure Activity tab. Click the procedure name in the Run column to view the procedure's status. To update the status, click Refresh. The Status Detail displays all of the configuration procedure steps and corresponding status. View any step's status by clicking on the link in the Status column.See the chapter about using configuration files to connect and configure components in Oracle Communications Billing and Revenue Management System Administrator's Guide for information about BRM configuration files and parameters.
Comparing Configurations
You can compare two or more target configurations of the same type, as well as historical configurations for a single target, using the Enterprise Manager Cloud Control administration console. You can compare configurations of a single component type running on multiple systems for compliance or troubleshooting reasons.
When comparing target configurations, you can use comparison templates. Comparison templates let you control which configuration parameters to compare. Application Management Pack for Oracle Communications provides a set of templates that you can use and extend.
If you are using Enterprise Manager Cloud Control 13c, you apply comparison templates dynamically to thousands of targets and review overall results in the Drift dashboard.
For more information about configuration comparisons, including instructions for using the Comparison Wizard and drift management, see the overview of comparisons and templates in Oracle Enterprise Manager Lifecycle Management Administrator's Guide.
Viewing Topology
Application Management Pack for Oracle Communications provides topology views of Oracle Communications applications and components managed as systems in Enterprise Manager Cloud Control. The views supplement existing Enterprise Manager Cloud Control configuration and routing topology views for Oracle Fusion Middleware and Oracle Enterprise Database, providing graphical and relational diagrams of managed targets. The views are displayed in the Configuration Topology Viewer in Oracle Enterprise Manager Cloud Control.
The Configuration Topology Viewer shows you the relationships between different elements in the target's topology. Different elements appear for different target types. For example:
-
The topology for an OSM node target shows relationships between elements for the node, the WebLogic Server domain (including servers, hosts, homes, and clusters), and the database elements, while the topology for an OSM system also shows relationships between the members of the system.
-
The topology for an Oracle Communications Integration target shows relationships between elements for Oracle AIA, SOA, WebLogic Server, the Oracle AIA and SOA databases, and integrated applications such as OSM and BRM.
-
The topology for a Comms Suite target shows relationships between elements for the OSM nodes, OSM systems, ASAP, UIM, and the suite.
Note:
Database elements appear in a target's topology only if a Management Agent is installed on the database host.For BRM and OSM targets deployed on Oracle RAC databases, you must manually associate the database with the target from the BRM or OSM target's home page. See "Associating Oracle RAC Database Targets with BRM and OSM Targets" for more information.
You can filter the elements that appear in the topology using the sidebar and the View list. The View list includes the following views:
-
Uses: Shows the targets that the selected target depends on. If a target is having problems, this view can help you determine whether its problems have been caused by another target it depends on.
-
Used By: Shows the targets that depend on the selected target. This view can help you determine how shutting down the selected target might affect other targets.
-
System Members: Shows the members of the system (available only for targets that are systems, such as generic systems or OSM system targets).
The Configuration Topology Viewer also lets you view more information about the elements in the topology, including properties, metrics, and incidents.
Using the Configuration Topology Viewer
You can use the Configuration Topology Viewer to view topology for systems, such as Comms Suite targets or generic systems that you have created, and individual applications, such as OSM node targets.
To view topology for systems or applications:
-
Log in to the Enterprise Manager Cloud Control administration console.
-
Do one of the following:
-
Access the Configuration Topology Viewer from the list of targets:
-
From the Targets menu, select All Targets.
-
From the Target Type tree, select the type of target for which you want to view the topology.
-
From the list of targets, right click the target for which you want to view the topology.
-
From the menu, select Configuration, and then Topology.
-
-
Access the Configuration Topology Viewer from the target home page:
-
Navigate to the home page for the target for which you want to view topology, as described in "Viewing Home Pages".
-
Under the target's name, from the target type menu, select Configuration, and then Topology.
-
The Configuration Topology Viewer appears for the selected target, displaying the target's relationships to other targets and components.
-
-
(Optional) To view summary information about a component in the target's topology, including the target type, host, and number of incidents:
-
Hover your cursor over a component.
A pop-up caption containing the target name appears.
-
Hover your cursor over the arrows beside the target name.
The pop-up caption expands with summary information about the target.
-
(Optional) In the summary information pop-up caption, click any link to go to the related page. For example, click the target name to go to the target's home page, or click an incident icon to go to the Incident Manager.
-
-
(Optional) To view more detailed information about a component in the target's topology:
-
Click the component.
-
From the sidebar:
-
To view a summary of metrics for the component, expand Metric History.
-
To view information about the target, the host, incidents, jobs, and configuration compliance or changes, expand Properties and click any of the tabs.
-
-
(Optional) Click any link to go to the related page. For example, click the target name to go to the target's home page or click an incident name to go to the Incident Manager.
-
See the overview of Configuration Topology Viewer in Oracle Enterprise Manager Lifecycle Management Administrator's Guide for more information about using and interpreting topology.
See the chapters about managing Enterprise Database and Fusion Middleware in the Oracle Enterprise Manager Cloud Control Administrator's Guide for information about viewing topologies for these applications.
Managing Compliance
Oracle Enterprise Manager Cloud Control provides a framework and features for evaluating how well your targets comply with default standards that Oracle provides or custom standards that you create.
Application Management Pack for Oracle Communications provides the following ready-to-use compliance frameworks which you can use to evaluate whether your configurations conform to Oracle's recommendations:
-
OSS Compliance Framework: For OSM and UIM deployments on Fusion Middleware 11g and 12c.
-
Communications Integration Compliance Framework: For Oracle AIA deployments on Fusion Middleware 11g and 12c.
The OSS and integrations compliance frameworks let you ensure that the targets and in your production systems are configured consistently across multiple systems and environments. You can use the provided frameworks to create similar frameworks if, for example, the configuration of your production system differs from that of your development system.
Monitoring compliance helps you prevent problems or identify their source. When problems occur, you can determine if your configuration is the cause by verifying whether your configuration conforms to Oracle's recommendations, identifying recent changes to configurations, and comparing the configuration of different environments.
The OSS and integrations frameworks are extensions of the compliance frameworks and features of Oracle Enterprise Manager Cloud Control. For detailed information about managing compliance in Enterprise Manager Cloud Control, including information about creating and applying custom compliance standards, suppressing violations, and to see examples, see the chapter about managing compliance in Oracle Enterprise Manager Lifecycle Management Administrator's Guide.
About the Compliance Frameworks
The OSS and integrations compliance frameworks consists of the following compliance standards:
-
OSS Compliance Framework:
-
OSM Compliance Standard: Defines compliance rules applicable to OSM node targets.
-
OSM Compliance Standard - WebLogic Patches: Defines compliance rules applicable to WebLogic Server domain targets. The rules evaluate whether the appropriate patches for OSM have been applied to the WebLogic Server domains.
-
UIM Compliance Standard: Defines compliance rules applicable to UIM targets.
-
UIM Compliance Standard - WebLogic Patches: Defines compliance rules applicable to WebLogic Server domain targets. The rules evaluate whether the appropriate patches for UIM have been applied to the WebLogic Server domains.
-
-
Communications Integration Compliance Framework:
-
Communications Integration Compliance Standard: Defines compliance rules applicable to Oracle AIA targets.
-
The compliance rules that make up these standards are based on Oracle product documentation, product uses, best practices, and guidelines. Because this framework and its associated standards and rules are system-defined, you cannot edit or delete them.
The compliance frameworks are intended for production systems. If your configuration differs for development or test systems, you can copy the system-defined frameworks and use them as the basis for your own framework. See the discussion of creating like a compliance framework in Oracle Enterprise Manager Lifecycle Management Administrator's Guide for more information about creating a copy of a system-defined framework.
About Monitoring Compliance
Enterprise Manager Cloud Control evaluates targets against compliance rules and provides a compliance score, describes any violations, and recommends corrective actions.
This section provides an overview of the Enterprise Manager Cloud Control pages used to monitor compliance. Accessing and using these pages is described in "Monitoring Compliance".
For an overall view of the compliance for all the targets associated with the standards within a compliance framework, you use the Compliance Dashboard. Figure 4-1 shows the Compliance Dashboard for the OSS compliance framework.
You can use the Compliance Dashboard to:
-
Determine the overall compliance of all targets by reviewing the compliance score for an entire framework.
-
Identify which standard contains the most violations by reviewing the compliance summary for both standards.
-
Compare the compliance scores, evaluations, and violations of different systems.
-
Identify the targets that need the most attention by reviewing the list of least compliant targets.
For details about the results of the compliance evaluations, you use the Compliance Results pages. You can use these pages to:
-
Review results for an entire framework, for an individual standard, and an individual target.
-
See a full list of compliance rules included in a framework or standard, with icons indicating any violations.
-
Get details about violations and see tips for how to resolve them.
-
Monitor compliance trends over time.
See Oracle Enterprise Manager Lifecycle Management Administrator's Guide for detailed information about accessing compliance features and using the compliance dashboard and results pages effectively.
About Monitoring OSM Compliance
In addition to monitoring the compliance of individual OSM nodes, you can use a generic system to monitor the compliance of an entire OSM system. The generic system should include the OSM nodes and WebLogic Server domain that are in that system. You can then monitor the compliance of the OSM system from the generic system's home page. See "Creating Generic Systems for Monitoring OSM System Compliance".
The Compliance Summary region, shown in Figure 4-2, provides an overall compliance score for the entire generic system, and an individual score for each member of the system.
Figure 4-2 Compliance Summary Region for a Generic System
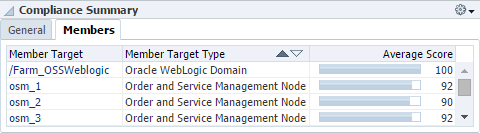
Description of ''Figure 4-2 Compliance Summary Region for a Generic System''
For a finer view of the compliance of an individual OSM node, you can use the OSM node target's home page. The Compliance Summary region, shown in Figure 4-3, provides a summary of compliance evaluations, violations, and scores for the selected OSM node.
Figure 4-3 Compliance Summary Region for an OSM Node
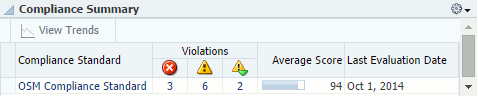
Description of ''Figure 4-3 Compliance Summary Region for an OSM Node''
From the OSM node target's home page, you can also access more details about the violations and standards, or access the compliance evaluation results for that target.
For information about OSM compliance rules, see Oracle Communications Order and Service Management System Administrator's Guide.
Monitoring Compliance
Monitoring compliance includes the following tasks:
-
(Optional) Viewing Compliance Standards and Rules
-
(Optional) Creating Generic Systems for Monitoring OSM System Compliance
Viewing Compliance Standards and Rules
You can view compliance standards and the rules that they include at any time, whether or not you have associated them with targets.
To view compliance standards and the rules that they include:
-
Log in to the Enterprise Manager Cloud Control administration console.
-
From the Enterprise menu, select Compliance and then Library.
-
Do any of the following:
-
To view the list of rules within a compliance standard, and view details about individual rules:
-
Click the Compliance Standards tab.
-
In the Search region, in the Compliance Standard field, enter OSM Compliance Standard, UIM Compliance Standard, or Communications Integration Compliance Standard and click Search.
A list of compliance standards appears.
-
Select the link for the compliance standard for which you want to view rules.
The list of rules within the selected compliance standard appears.
-
Select a rule from the list and review information about it, including a description of the rule and its definition.
-
-
To view details for all rules that apply to OSM, UIM, or Oracle AIA targets:
-
Click the Compliance Standard Rules tab.
-
In the Search region, from the Applicable To list, select Order and Service Management Node, Unified Inventory Management, or Oracle Communications Integration.
-
From the System-Defined menu, select Yes.
-
Click Search.
All system-defined rules that can apply to the selected target type appear. Review the details for the rules. The descriptions of all the rules are displayed on one page.
-
To view more details about a rule, including the rule's definition and rationale, click its name.
-
-
To view details for all rules that apply to WebLogic Server domains:
-
Click the Compliance Standard Rules tab.
-
In the Search region, from the System-Defined menu, select Yes.
-
From the Applicable To list, select Oracle WebLogic Domain.
-
In the Keywords field, enter Patch.
-
Click Search.
All system-defined rules with the Patch keyword that can apply to WebLogic Server domain targets appear. Review the details for the rules. The descriptions of all the rules are displayed on one page.
Note:
The list may include some rules that are not part of the OSM or UIM WebLogic patches standards. To determine which rules are part of the OSM and UIM WebLogic patches standards, review the list of rules accessible from the Compliance Standards tab. -
To view more details about a rule, including the rule's definition and rationale, click its name.
-
-
Creating Generic Systems for Monitoring OSM System Compliance
Because the OSM Compliance Standard is evaluated against OSM node targets rather than OSM system targets, you must create generic systems to be able to monitor the compliance of OSM systems as a whole.
You must create the generic systems before associating the compliance standards with the node targets.
To create a generic system for monitoring OSM system compliance, perform the following steps for each OSM system for which you want to monitor compliance:
-
Log in to the Enterprise Manager Cloud Control administration console as a privileged user.
-
From the Setup menu, select Add Target, and then Generic System.
The Add Target page for creating a generic system appears.
-
In the Name field, enter a unique name identifying the generic system as a compliance monitoring system. For example, OSM Compliance System.
-
In the Members region, click Add.
The Select Targets dialog box appears.
-
From the Target Type menu, select the Order and Service Management Node and Oracle WebLogic Domain options.
-
From the list of targets, select all of the OSM nodes that belong to a single system, and select the domain on which that system is deployed. Hold down the CTRL key while clicking to select multiple targets.
-
Click Select.
-
Click Next.
The Define Associations page appears.
-
Click Next without defining any associations.
The Availability Criteria page appears.
-
In the Key Members region, click the double arrow icon to move all of the node targets from the Members list to the Key Members list.
-
Click Next.
The Charts page appears.
-
(Optional) Add, edit, or remove charts. The charts specified here appear on the Charts page for the generic system, which you can access from the target type menu on the generic system's home page. You can use the charts to monitor performance data for the system.
-
(Optional) To review your generic system configuration, click Next.
The Review page appears.
-
Click Finish.
The generic system is created and the Systems page appears, showing the list of generic systems.
Associating Compliance Standards with Targets
If you want to monitor compliance for OSM at the system level, you must create generic systems as described in "Creating Generic Systems for Monitoring OSM System Compliance" before completing this procedure.
To associate compliance standards with targets:
-
Log in to the Enterprise Manager Cloud Control administration console.
-
From the Enterprise menu, select Compliance, and then Library.
-
Click the Compliance Standards tab.
-
In the Search area, enter OSM Compliance Standard, UIM Compliance Standard, or Communications Integration Compliance Standard and click Search.
A list of compliance standards appears.
-
From the list of compliance standards, highlight the relevant compliance standard and click the Associate Targets button.
The Target Association for Compliance Standard page appears.
-
Click the Add button.
-
Select the targets for which you want to evaluate compliance and click Select.
-
Click OK.
The compliance standard is associated with the targets.
-
For OSM and UIM targets only:
-
From the list of compliance standards, highlight OSM Compliance Standard - WebLogic Patches or UIM Compliance Standard - WebLogic Patches and click the Associate Targets button.
-
Click the Add button.
-
Select the WebLogic Server domain target on which the OSM or UIM targets are deployed and click Select.
-
Click OK.
The compliance standard is associated with the WebLogic Server domain targets.
-
Monitoring Compliance Summary and Results
To monitor compliance results:
-
Log in to the Enterprise Manager Cloud Control administration console.
-
View the compliance summary for all targets associated with compliance standards:
-
From the Enterprise menu, select Compliance, and then Dashboard.
The Compliance Dashboard page appears.
-
From the Framework menu, select OSS Compliance Framework or Communications Integration Compliance Framework.
The overall score for the compliance framework appears.
-
In the Least Compliant Targets region, from the Target Type menu, select any of the following options, then click anywhere outside the menu:
-
Oracle Communications Integration
-
Order and Service Management Node
-
Oracle WebLogic Domain
-
Unified Inventory Managemen
The table shows only the selected target type.
Note:
When you select Oracle WebLogic Domain, some domains that appear may not be domains on which OSM or UIM is deployed. -
-
Review the regions for summary information about the generic systems, targets, and standards.
-
-
View the results of evaluating targets against the rules of the compliance frameworks:
-
From the Enterprise menu, select Compliance, and then Results.
The Compliance Results page appears.
-
Do one of the following:
-
On the Compliance Standards tab, click an OSM, UIM, or integration compliance standard.
-
Click the Compliance Frameworks tab, and then click OSS Compliance Framework or Communications Integration Compliance Framework.
The results for the compliance or standard appear.
-
-
Review the Summary, Trend Overview, and Violations tabs for information about targets associated with the standard.
-
To view information about an individual rule, navigate to the rule in the tree at the left of the Compliance Result Page.
-
-
If you created generic systems to monitor compliance for OSM systems, view the compliance summary and results for a generic system that includes OSM node targets:
-
From the Targets menu, select Systems.
-
From the list of systems, select a generic system that you created for monitoring OSM system compliance.
The home page for the generic system appears.
-
Review the information in the Compliance Summary region.
-
From the target type menu under the target's name, select Compliance, and then Results.
The Compliance Results page for the generic system appears, showing the results of evaluating the targets that are members of the system against the rules in the standards to which the members are associated.
-
Review the results on the Compliance Frameworks, Compliance Standards, and Target Compliance tabs.
-
-
View the compliance summary and results for a single OSM node target:
-
From the Targets menu, select All Targets.
-
In the Target Type tree, select Order and Service Management Node.
-
In the list of targets, click the name of the target for which you want to view the compliance summary.
The target's home page appears.
-
Review the information in the Compliance Summary region.
-
From the target type menu, select Compliance, and then Results.
The Compliance Results page for the target appears, showing the results of evaluating the target against the rules in the standards to which the target is associated.
-
Review the results on the Compliance Frameworks, Compliance Standards, and Target Compliance tabs.
-
See Oracle Enterprise Manager Lifecycle Management Administrator's Guide for detailed information about accessing compliance features and using the compliance dashboard and results pages effectively.
Identifying Discrepancies in Shared Data
The applications integrated by Oracle AIA share account, product, and asset data, and Oracle AIA maintains cross-references for the shared data. Over time, inconsistencies can develop in the shared data, and entities that exist in one application may be inaccurately referenced or entirely missing in another. Data inconsistency problems can be difficult to diagnose and resolve, resulting in failed orders and increased operational expense.
Application Management Pack for Oracle Communications helps you locate inconsistent data by using the Enterprise Manager Cloud Control administration console.
You can generate data discrepancy reports to locate inconsistency in shared data, including missing or invalid references in Oracle AIA and the integrated applications. You can schedule jobs to run regular data discrepancy reports, configure email notifications, review reports in HTML format, and purge reports when they are no longer needed.
After reviewing the reports to locate data inconsistency, you resolve the inconsistency manually.
Data discrepancy reports are not supported if you are using split cross-reference tables.
Configuring Environments for Data Discrepancy Reports
Configuring environments involves the following tasks:
Adding Environments
To add an Oracle AIA environment for data DISCREPANCY reports:
-
Log in to the Enterprise Manager Cloud Control administration console.
-
From the Targets menu, select Communications Applications.
The Communications Applications landing page appears.
-
Under the availability chart, click Data Discrepancy.
The Oracle Communications Data Discrepancy page appears.
-
In the Environments region, click Add.
-
In the Environment Details region, enter information about the environment in the following fields:
-
Environment Name: Enter three letters to represent a name for the environment. Use a distinct name from any other environments you have added to the region.
-
Description: Enter a description for the environment.
-
-
In the Data Sources region, enter information about the databases in the following rows:
-
Cross Ref. DB: Enter the host name, port, and system ID for the Oracle AIA cross-reference database. Enter the user name and password for the database user.
-
Siebel DB: Enter the host name, port, and system ID for the Siebel customer relationship management (Siebel CRM) database. Enter the user name and password for the database user.
-
BRM DB: Enter the host name, port, and system ID for the BRM database. Enter the user name and password for the database user.
-
-
In the Output Folder region, enter information about where to store the reports in the following fields:
-
(Optional) If you want to store data discrepancy reports on a remote host, enter the details in the following fields:
-
Host-Name: Enter the URL of the remote host.
-
Login User-Name: Enter the user name for the remote host.
-
Login Password: Enter the password of the user name for the remote host.
-
-
Location to store the report: Enter the complete path to the directory where you want to store data discrepancy reports.
The reports will be stored in the specified location and on the Enterprise Manager Cloud Control server.
-
-
Click Save Environment.
The environment details are saved in the table and reports for account, asset, and product data discrepancy are added to the Available Reports region.
Modifying Environments
To modify an existing environment:
-
Log in to the Enterprise Manager Cloud Control administration console.
-
From the Targets menu, select Communications Applications.
The Communications Applications landing page appears.
-
Under the availability chart, click Data Discrepancy.
The Oracle Communications Data Discrepancy page appears.
-
In the Environments region, do one of the following:
-
Modify an individual value:
-
Select the value that you want to modify.
-
Enter a new value.
-
Press Enter.
-
-
Modify multiple values for a single environment:
-
Highlight an existing environment and click Modify.
The Modify an Environment dialog box appears.
-
Enter new values for any fields you want to modify and click Save Environment.
The environment details are saved.
-
-
Disabling and Enabling Environments
You can temporarily disable all data discrepancy reports for an environment by disabling the environment and enabling it again later.
To disable or enable an environment:
-
Log in to the Enterprise Manager Cloud Control administration console.
-
From the Targets menu, select Communications Applications.
The Communications Applications landing page appears.
-
Under the availability chart, click Data Discrepancy.
The Oracle Communications Data Discrepancy page appears.
-
In the Environments region, highlight the environments that you want to disable or enable and click Enable/Disable.
The environments are disabled or enabled.
When you disable an environment in this way, it is disabled only in the context of data discrepancy reports. Metric collection, monitoring, and other Enterprise Manager Cloud Control functionality is not disabled.
Deleting Environments
To delete an Oracle AIA environment from the data discrepancy page:
-
Log in to the Enterprise Manager Cloud Control administration console.
-
From the Targets menu, select Communications Applications.
The Communications Applications landing page appears.
-
Under the availability chart, click Data Discrepancy.
The Oracle Communications Data Discrepancy page appears.
-
In the Environments region, highlight the environments that you want to delete and click Delete.
The environment details are deleted and the environment is removed from the table.
When you delete an environment in this way, it is deleted only in the context of data discrepancy reports. The Oracle AIA target and application targets are not deleted from Enterprise Manager Cloud Control.
Configuring Data Discrepancy Reports
By default reports to identify discrepancies in account, asset, and product data are scheduled to run for each enabled environment every 24 hours. To avoid overloading the databases, the time that each report runs is offset by one hour for each data type. The default reports compare data from the last 7 days.
You can perform the following tasks to configure data discrepancy reports:
You can also view the percentage of successful and failed reports by viewing the Report Statistics region of the Oracle Communications Data Discrepancy page.
Changing Report Schedules
To change a data discrepancy report schedule:
-
Log in to the Enterprise Manager Cloud Control administration console.
-
From the Targets menu, select Communications Applications.
The Communications Applications landing page appears.
-
Under the availability chart, click Data Discrepancy.
The Oracle Communications Data Discrepancy page appears.
-
In the Available Reports region, highlight a report and click Schedule.
-
From the Schedule Time menu, select the frequency with which to generate reports. The default is 24 hours.
-
From the Fetch menu, select the duration of time during which to collect data for the reports. The default is the last 7 days.
-
For Accounts reports only, from the Account Type menu, select the account type for which to generate reports.
-
Click Save.
The scheduling details are saved.
Running On-Demand Reports
To run a data discrepancy report on-demand:
-
Log in to the Enterprise Manager Cloud Control administration console.
-
From the Targets menu, select Communications Applications.
The Communications Applications landing page appears.
-
Under the availability chart, click Data Discrepancy.
The Oracle Communications Data Discrepancy page appears.
-
In the Available Reports region, highlight the reports that you want to run and click Run Now.
The reports are run.
-
Review the report status in the Report Activity region.
Disabling and Enabling Reports
You can temporarily disable individual data discrepancy reports for an environment and enable them again later.
To disable or enable an environment:
-
Log in to the Enterprise Manager Cloud Control administration console.
-
From the Targets menu, select Communications Applications.
The Communications Applications landing page appears.
-
Under the availability chart, click Data Discrepancy.
The Oracle Communications Data Discrepancy page appears.
-
In the Available Reports region, highlight the reports that you want to disable or enable and click Enable/Disable.
The reports are disabled or enabled.
Viewing Data Discrepancy Reports
To view data discrepancy reports:
-
Log in to the Enterprise Manager Cloud Control administration console.
-
From the Targets menu, select Communications Applications.
The Communications Applications landing page appears.
-
Under the availability chart, click Data Discrepancy.
The Oracle Communications Data Discrepancy page appears.
-
In the Report Activities region, select the link for the report you want to view in the Report/Error Location column.
The report is downloaded to your local machine.