Oracle Enterprise Performance Reporting Cloud Service comes with a sample application that consists of a model containing seven dimensions. You create the sample application with a click of a button in the Oracle Enterprise Performance Reporting Cloud Service web interface.
When connected to the sample model in Smart View, you can perform ad hoc queries that allow you to create data reports containing the information that you want to see. You can copy and paste data from the reports into doclets in Oracle Enterprise Performance Reporting Cloud Service report packages. You can copy and paste grids or individual data points into doclets.
The scenario in this topic shows you how to create an ad hoc grid and paste individual data points and an entire grid into a doclet, in preparation for the doclet being included in a report package in Oracle Enterprise Performance Reporting Cloud Service.
 To create an ad hoc grid from an Oracle Enterprise Performance Reporting Cloud Service data source:
If you have not already done so, launch Excel, and set up a data source connection as described in Creating Data Source Connections to Enterprise Performance Reporting.
In Excel, connect to the Oracle Enterprise Performance Reporting Cloud Service data source.
See Connecting to Enterprise Performance Reporting in Smart View.
In the Smart View Panel, expand Reporting Applications, then Sample Application, and then right-click Sample Model and select Ad hoc analysis.
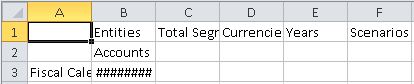
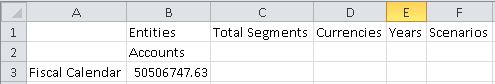
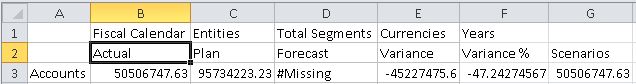
The initial dimensions and data are placed on the sheet. The Accounts dimension and Fiscal Calendar dimension are the active dimensions.
Note:
The dimensions , Entities, Total Segments, Currencies, Years, and Scenarios are in the POV and are not in the body of the grid. They can be used to change the data perspective of the grid; however, we are not showing that functionality in this scenario.
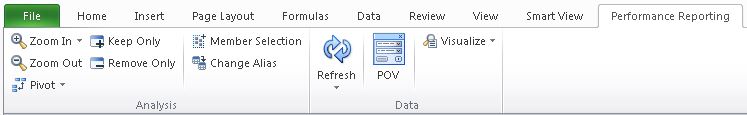
And the Performance Reporting ribbon for ad hoc functionality is displayed:
Before proceeding, in the Smart View ribbon, click Options, select the Formatting tab, and ensure that these options are selected:
Use Excel Formatting
Adjust Column width
Click OK.
Click the Refresh button in either the Smart View ribbon or the Performance Reporting ribbon to see the effect of the formatting changes on the current grid:
The goal for our layout is to show the Accounts members in rows, and Scenarios members in columns, to create a simple operating expenses report.
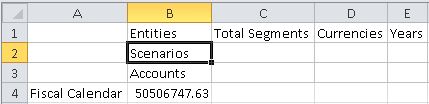
To move the Scenarios dimension to the column, right-click and drag the Scenarios dimension cell, and then drop it on the Accounts dimension cell.
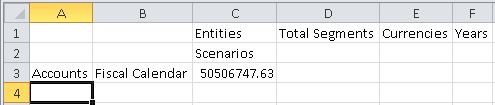
To move the Accounts dimension to the row, right-click and drag the Accounts dimension cell, and then drop it on the Fiscal Calendar dimension cell.
Right-click and then drag the Fiscal Calendar dimension to the POV row, and then drop it on the Entities dimension.
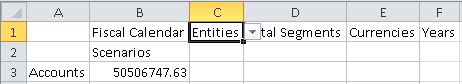
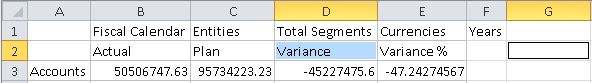
In the previous grid, the Scenarios and Accounts dimensions are the active dimensions. The dimensions Fiscal Calendar, Entities , Total Segments, Currencies, and Years are in the POV. This is the desired dimension layout.
Now let's zoom into row and column members and use the Keep Only and Remove Only buttons on the Performance Reporting ribbon to create the row and column layout that we want to see.
Select the Scenarios dimension, and then either double-click or click Zoom In on the Performance Reporting ribbon.
Press the Ctrl key, select the Forecast and Scenarios members, and then click the Remove Only button in the Performance Reporting ribbon.
The grid should look like this:
Now let's zoom in to the Operating Expenses member.
Select Accounts, and then either double-click or click Zoom In from the Performance Reporting ribbon.
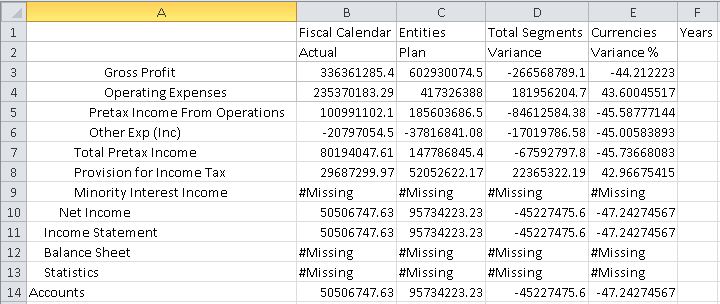
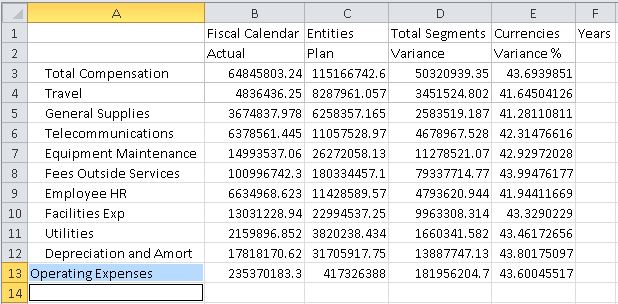
The result of the first zoom in:
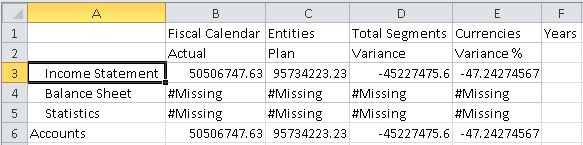
The grid should look like this:
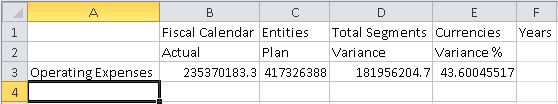
To keep only the Operating Expenses member, we'll select the Operating Expenses cell and click Keep Only from the Performance Reporting ribbon.
The grid should look like this:
Double-click or zoom in on the Operating Expenses member cell.
In the expanded grid, select members with #Missing in their rows, Operating Expense Synergies and Allocations, and click Remove Only from the Performance Reporting ribbon.
The grid should look like this:
Now let's format the left column.
For a left-aligned list, in the Smart View ribbon, click Options, and then click the Member Options tab.
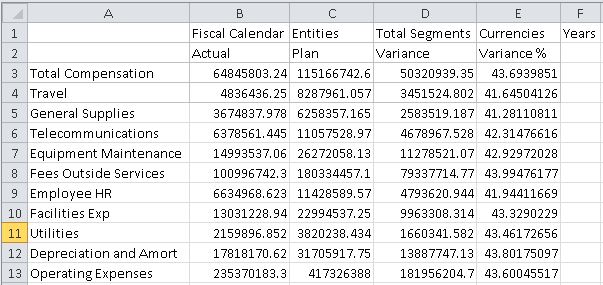
In the Smart View ribbon or Performance Reporting ribbon, click Refresh.
The grid should look like this:
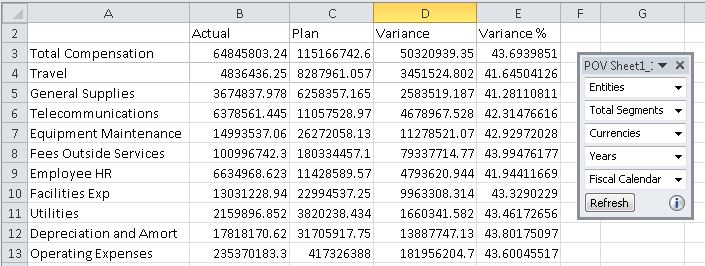
Next, we want to remove the POV members from the first row of the report.
In the Performance Reporting ribbon, click the POV button.

Clicking the POV button causes the POV members move to the POV toolbar, which floats on the grid, as shown in Figure 107, POV Toolbar.
Note:
The POV toolbar can be moved around on the grid or docked by dragging the POV toolbar to the top, bottom, left, or right of the Excel window. You can prevent the POV toolbar from docking by holding the Ctrl key as you drag the toolbar.
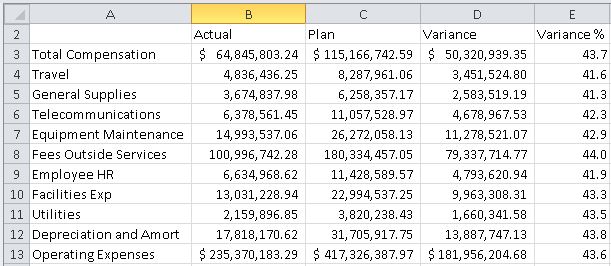
Now let's apply formatting to the numbers in the grid. Number formatting will carry over when we copy the grid and paste it into Word.
Press and hold down the Ctrl key, and then select the dollar amounts in the first and last rows of the report, cells B3, C3, D3, B13, C13, and D13.
With cells B3, C3, D3, B13, C13, and D13 selected, in the Excel Home ribbon, in the Number group, click the Accounting Number Format button,
 .
.If you are working in a non-American English environment, choose the default currency symbol for your locale.
In the Excel Home ribbon, make the following changes to the currency and variance percentage figures:
Select only the figures in columns B, C, and D, and then, in the Number group, click the Comma Style button,
 .
.Select only the figures in column E, Variance %, and then, in the Number group, click the Decrease Decimal button,
 , until only one decimal place remains.
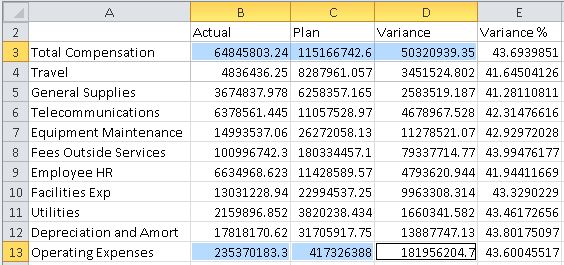
You should now have a report similar to the one shown in Figure 108, Ad Hoc Report from Performance Reporting Data Source.
This formatting will carry over to the report package doclet in Word. You'll add more formatting when you're authoring the doclet in Word (as described in Copying and Pasting Enterprise Performance Reporting Data into Doclets).
Save the report and continue with Copying and Pasting Enterprise Performance Reporting Data into Doclets.
We'll show you how to copy and paste the dynamic data points from this report in to a doclet in an Oracle Enterprise Performance Reporting Cloud Service report package. This is a typical task that a doclet author performs during the authoring phase of the report package lifecycle.