For this demonstration, we'll work with an example Word-based report package called Department Reports. We'll use the data that we created in Performing Ad Hoc Analysis with Enterprise Performance Reporting Data to create refreshable data points in a doclet called “Operating Expenses.” The doclet will contain text interspersed with data points, and the full grid.
Note: | The procedure in this topic could also be performed in a PowerPoint-based report package. |
 To copy and paste Oracle Enterprise Performance Reporting Cloud Service data into doclets:
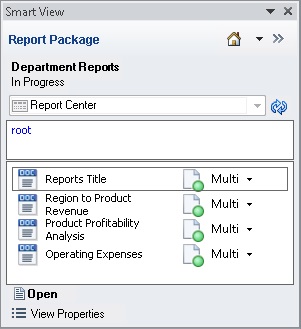
In Word, connect to the Oracle Enterprise Performance Reporting Cloud Service data source, and then open a report package, as described in Connecting to Enterprise Performance Reporting in Smart View.
In the Performance Reporting ribbon, click Check Out.

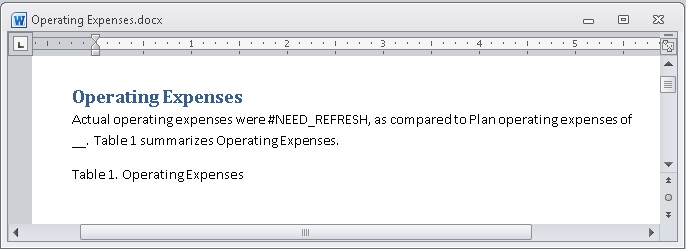
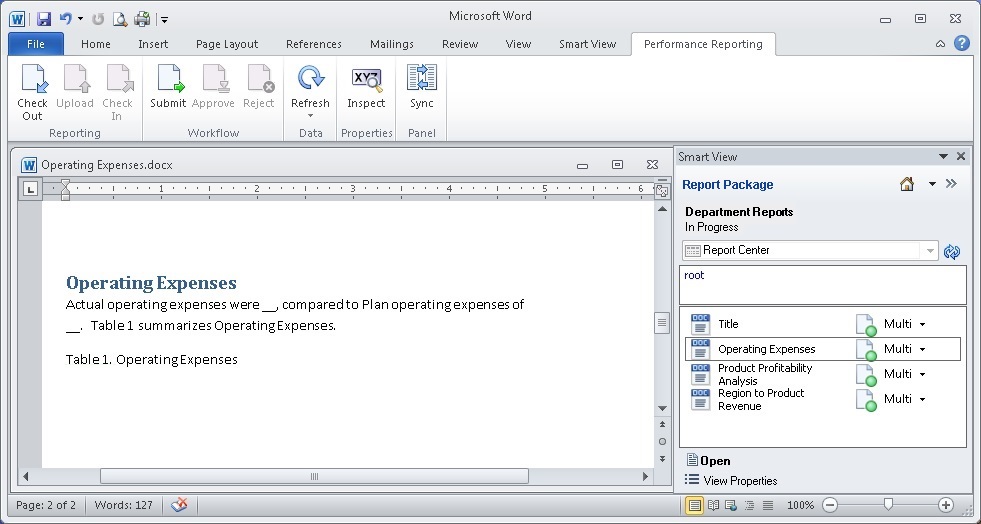
You can now author in the doclet. The example doclet in Figure 110 has placeholders within the paragraph for pasting data points. You can paste the entire grid below the table caption.
To copy and paste a data point:
Open and connect to the ad hoc grid that you created in Performing Ad Hoc Analysis with Enterprise Performance Reporting Data.
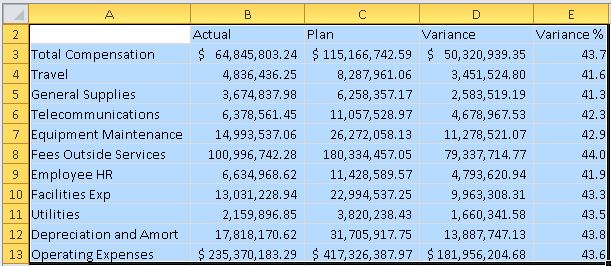
Select the Actual total operating expenses figure in cell B13, and then click
 from the Smart View ribbon.
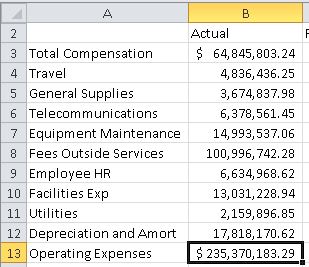
Tip:
You must be connected to the ad hoc grid, and you must use the Copy and Paste buttons on the Smart View ribbon so that the data you copy and paste remains dynamic between Office applications.
In Word, position the cursor in the paragraph at the required location, and then, in the Smart View ribbon, click Paste.
The paste operation results in a placeholder, “#NEED_REFRESH”.
In this scenario, a second data point for plan operating expenses is pasted into the paragraph.
Go to the ad hoc grid that you created in Performing Ad Hoc Analysis with Enterprise Performance Reporting Data.
Select the entire grid, including all members, and then click
; in the example in Figure 111, Entire Ad Hoc Report Selected for Copying, you would select cells A2 through E13.Remember that in Performing Ad Hoc Analysis with Enterprise Performance Reporting Data, step 19, we moved the POV dimensions from row 1 to the POV toolbar. That's why the grid that we're copying from begins on row 2.
In Word, position the cursor at the location that you require, and in the Smart View ribbon, click Paste.
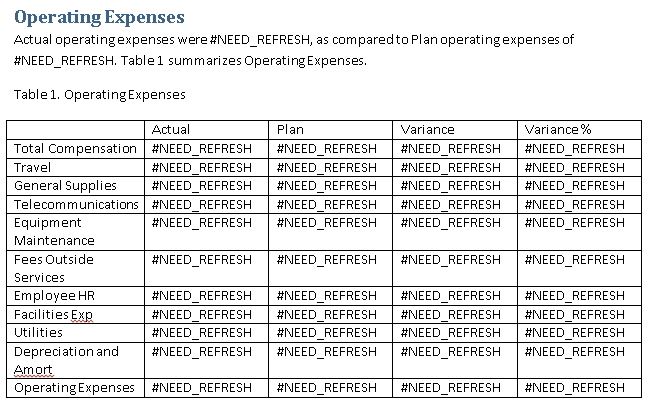
The paste operation results in a table in which every cell is populated with the placeholder, “#NEED_REFRESH”, as shown in Figure 112, Ad Hoc Grid Range Pasted Below Table Caption.
The data points and range are ready to be refreshed.
Click Refresh, either in the Smart View ribbon or the Performance Reporting ribbon.
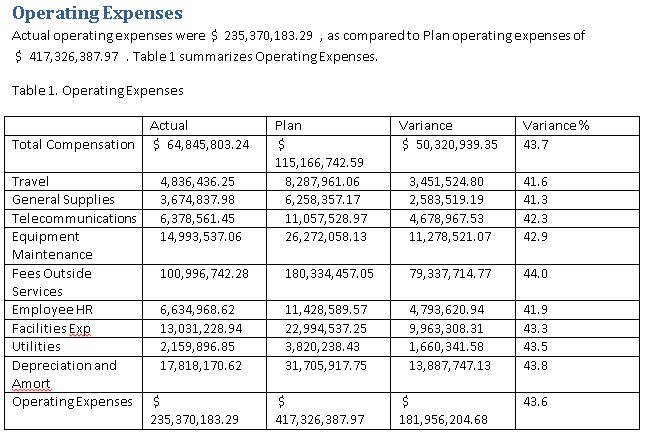
The resulting doclet page should look like this:
Use the tools in Word to format the table in the doclet.
Select the entire table and from the Layout ribbon in Word, select AutoFit, and then AutoFit Contents.
Right-align all the data values in the Actual, Plan, and Variance columns.
Add a single underline under the column headings and under the Actual, Plan, Variance, and Variance % columns in the “Depreciation and Amort” row.
Add double underlines under the Actual, Plan, Variance, and Variance % columns in the “Operating Expenses” row.
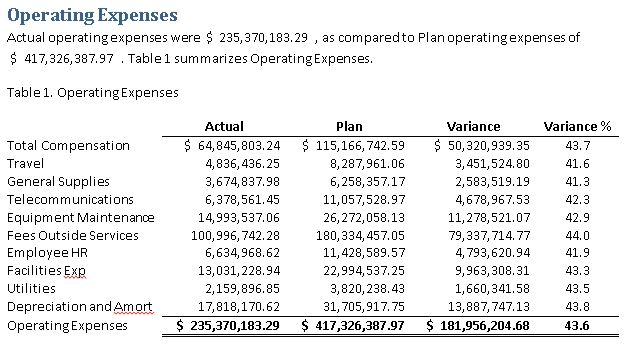
After you've applied the Word formatting, the table should resemble the table in Figure 113, Doclet Example Containing Formatted Word Table.
Now that you've completed your authoring tasks in the doclet, you can upload it and check it in to make it available to other doclet authors.
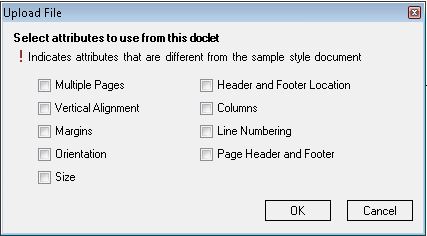
In the Performance Reporting ribbon, click Upload.

In the Upload File dialog box, select the check box next to any style attributes that you want to override, and then click OK.
Style attributes in the doclet that differ from the style sample for the report package are noted with an exclamation point. In this case, there are no style attributes to override.
From the Performance Reporting ribbon, click Check In.

The lock icon is removed from the doclet in the doclet responsibilities list, indicating that the doclet is no longer checked out.
This completes the example scenario. In summary, we showed you how to accomplish these tasks:
Create an ad hoc report while connected to an Oracle Enterprise Performance Reporting Cloud Service data source.
Format the figure and percentage data in Excel.
Open a report package and check out a doclet for authoring.
Copy and paste data points and ranges from the ad hoc grid in Excel to the doclet, creating a Word table.
Format the table using Word formatting.
Upload the doclet and check it in.
In a production environment, the next steps that you take depend on the requirements of the report package. You may need to submit the doclet for approval. You might need to author other doclets. Later, you may be asked to review portions or all of the report package. You can do all of these tasks in Smart View.