Command Log
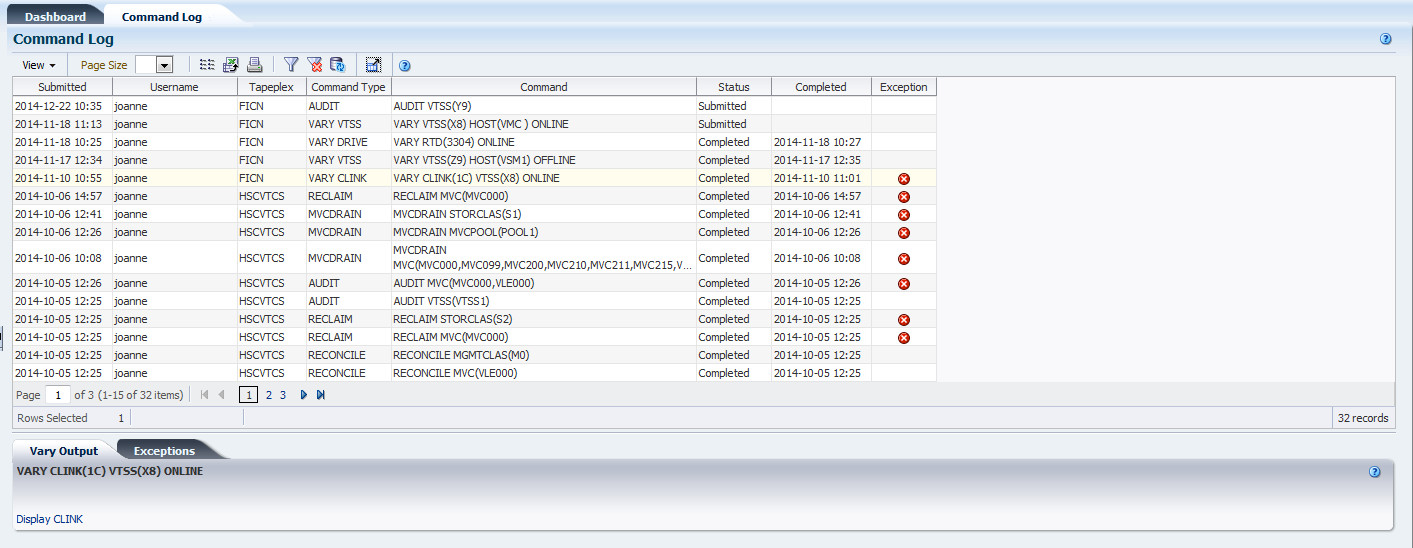
The Command Log lists all the commands that a user has submitted. If the user is also the administrator, all commands submitted by all users are displayed.
When a command is selected from the list, the command output details are displayed in the Detail tabs beneath the list.
To display the Command Log, select Management and Command Log on the navigation tree.
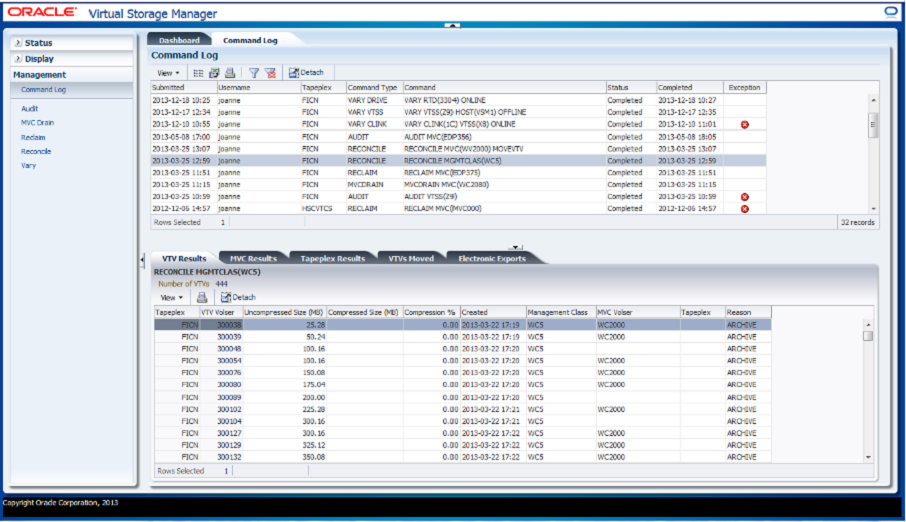
Click a row to display the output for that command in the Detail tabs. Depending on the selected command, these tabs may include:
Click the arrows in any column header to sort the data table by that column in ascending or descending order.
Exceptions are denoted in the Exceptions column with an icon:
| Icon | Name | Description |
|---|---|---|
| Critical | Indicates exceptions occurred during the running of a command. |
Click the icon to display the "Exceptions" tab.
Table columns and descriptions include:
| Column | Description |
|---|---|
| Submitted | The time the command was submitted. |
| User Name | The user name that submitted the command. |
| Tapeplex | The tapeplex the command was run on. |
| Command Type | The type of command issued:
AUDIT MVC DRAIN RECLAIM RECONCILE VARY CLINK VARY DRIVE VARY VTSS |
| Command | The actual command that was sent to ELS. |
| Status | The current status of the command:SubmittedCompleted |
| Completed | The date and time ELS completed running the command. |
| Exception | Any exceptions that occurred during the running of a command. |
Audit Output
The Audit Output detail tab lists Audit events resulting from the command that is currently selected in the Command Log.
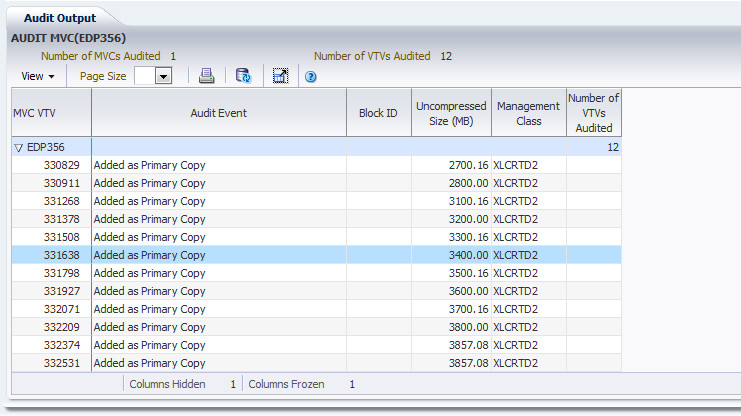
Table columns and descriptions include:
| Column | Description |
|---|---|
| MVC VTV | The MVC volser (collapsed) and its VTV volsers (expanded) |
| Audit Event | A VSM audit action |
| Block ID | The Block ID of the audited VTV |
| Uncompressed Size (MB) | The uncompressed size of the VTV in megabytes |
| Management Class | The management class assigned to the VTV |
| Number of VTVs Audited | The number of VTVs in the MVC that were audited |
| Process ID | The process ID, which is a unique number in the range 0 - 65536 |
Columns Hidden indicates the number of columns in the table that are not being displayed. These are displayed using the View menu.
Columns Frozen is the number of left-hand columns that remain static when the horizontal scroll bar is moved. A blue vertical line separates these columns from the others.
Use the View menu to perform the following operations:
| View Option | Description |
|---|---|
| Scroll Table | Enable or disable scrolling |
| Columns | Show all or selected columns and manage hidden/visible status |
| Detach | Display the table in a separate window |
| Sort | Sort the column in ascending or descending order |
| Reorder Columns | Select the column sequence for Visible columns |
Use the Page Size menu to specify the number of rows to include on a data table page.
If there are multiple pages, use the Page feature at the bottom of the table to navigate among them. Enter or select a page number or use the arrow buttons to move forward or backward in the list of pages.
Click the icons above the table to perform the following operations:
| Icon | Name | Description |
|---|---|---|
| Display as a printable page | ||
| Refresh | Refresh with data from the VSM GUI database | |
| Detach | Display in a separate window | |
| Help | Display VSM GUI Help | |
| Close All Tabs | Close all tabs and display just the Dashboard |
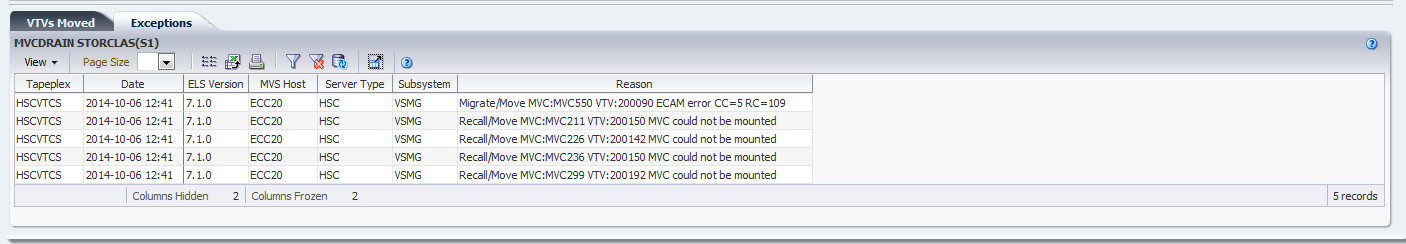
Exceptions
The Exceptions detail tab lists by tapeplex exceptions resulting from the command that is currently selected in the Command Log.
Click the arrows in any column header to sort the data table by that column in ascending or descending order.
You can also filter data for individual data columns to further isolate specific information. See "Using Filters" for information about this feature.
Table columns and descriptions include:
| Column | Description |
|---|---|
| Tapeplex | The name of the tapeplex where the exception occurred |
| ELS Version | The ELS version running on the host |
| MVS Host | The name of the host |
| Server Type | The host server software type |
| Subsystem | The name of the VTSS |
| Reason | The reason for the exception |
| Configuration Token | The configuration token is updated when a significant change has been made to the configuration, signaling a need to possibly retrieve the updated configuration |
| Process ID | The process ID, which is a unique number in the range 0 - 65536 |
Columns Hidden indicates the number of columns in the table that are not being displayed. These are displayed using the View menu.
Columns Frozen is the number of left-hand columns that remain static when the horizontal scroll bar is moved. A blue vertical line separates these columns from the others.
Use the View menu to perform the following operations:
| View Option | Description |
|---|---|
| Scroll Table | Enable or disable scrolling |
| Columns | Show all or selected columns and manage hidden/visible status |
| Detach | Display the table in a separate window |
| Sort | Sort the column in ascending or descending order |
| Reorder Columns | Select the column sequence for Visible columns |
Use the Page Size menu to specify the number of rows to include on a data table page.
If there are multiple pages, use the Page feature at the bottom of the table to navigate among them. Enter or select a page number or use the arrow buttons to move forward or backward in the list of pages.
Click the icons above the table to perform the following operations:
| Icon | Name | Description |
|---|---|---|
| Selected Row Data | Show data for selected rows | |
| Export to Excel | Export all rows to an Excel spreadsheet | |
| Display as a printable page | ||
| Filter | See "Using Filters" | |
| Reset Filter | Reset the data filter | |
| Refresh | Refresh with data from the VSM GUI database | |
| Detach | Display in a separate window | |
| Help | Display VSM GUI Help | |
| Close All Tabs | Close all tabs and display just the Dashboard |
MVC Results
The MVC Results detail tab lists by MVC the results of the command that is currently selected in the Command Log.
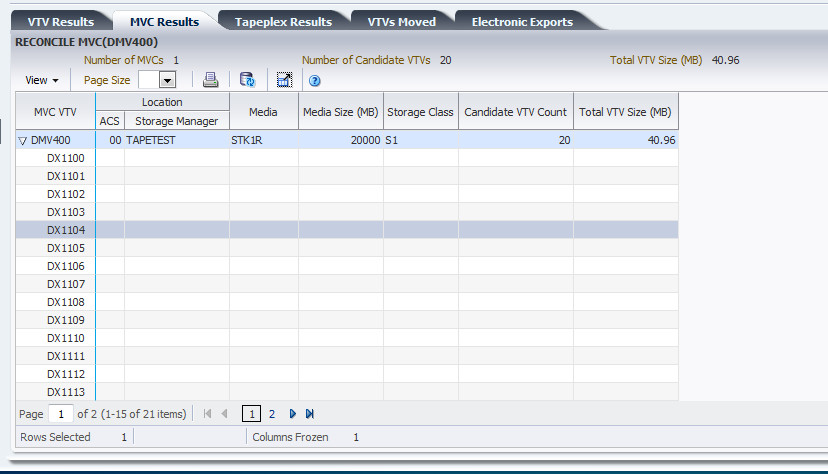
Table columns and descriptions include:
| Column | Description |
|---|---|
| MVC VTV | The MVC volser (collapsed) and its VTV volsers (expanded) |
| ACS Location | The name of the ACS where the MVC is located |
| Storage Manager Location | The Storage Manager assigned to the MVC |
| Media | The media type of the MVC |
| Media Size (MB) | The media size of the MVC in megabytes |
| Storage Class | The Storage Class assigned to the MVC |
| Candidate VTV Count | The number of VTVs in the MVC |
| Total VTV Size (MB) | The total size of the MVC in megabytes |
Columns Hidden indicates the number of columns in the table that are not being displayed. These are displayed using the View menu.
Columns Frozen is the number of left-hand columns that remain static when the horizontal scroll bar is moved. A blue vertical line separates these columns from the others.
Use the View menu to perform the following operations:
| View Option | Description |
|---|---|
| Scroll Table | Enable or disable scrolling |
| Columns | Show all or selected columns and manage hidden/visible status |
| Detach | Display the table in a separate window |
| Sort | Sort the column in ascending or descending order |
| Reorder Columns | Select the column sequence for Visible columns |
Use the Page Size menu to specify the number of rows to include on a data table page.
If there are multiple pages, use the Page feature at the bottom of the table to navigate among them. Enter or select a page number or use the arrow buttons to move forward or backward in the list of pages.
Click the icons above the table to perform the following operations:
| Icon | Name | Description |
|---|---|---|
| Display as a printable page | ||
| Refresh | Refresh with data from the VSM GUI database | |
| Detach | Display in a separate window | |
| Help | Display VSM GUI Help | |
| Close All Tabs | Close all tabs and display just the Dashboard |
Tapeplex Results
The Tapeplex Results detail tab lists by tapeplex the results of the command that is currently selected in the Command Log.
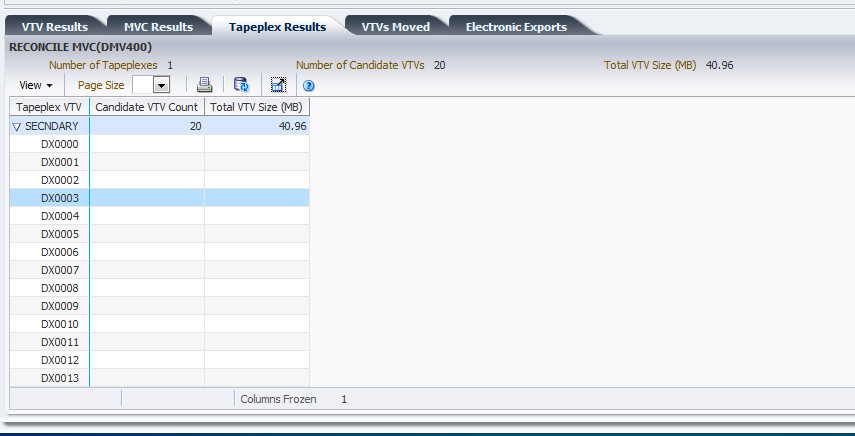
Table columns and descriptions include:
| Column | Description |
|---|---|
| Tapeplex VTV | The name of the tapeplex (collapsed) and its VTV volsers (expanded) |
| Candidate VTV Count | The total number of VTVs |
| Total VTV Size (MB) | The total size of the VTVs in megabytes |
Columns Hidden indicates the number of columns in the table that are not being displayed. These are displayed using the View menu.
Columns Frozen is the number of left-hand columns that remain static when the horizontal scroll bar is moved. A blue vertical line separates these columns from the others.
Use the View menu to perform the following operations:
| View Option | Description |
|---|---|
| Scroll Table | Enable or disable scrolling |
| Columns | Show all or selected columns and manage hidden/visible status |
| Detach | Display the table in a separate window |
| Sort | Sort the column in ascending or descending order |
| Reorder Columns | Select the column sequence for Visible columns |
Use the Page Size menu to specify the number of rows to include on a data table page.
If there are multiple pages, use the Page feature at the bottom of the table to navigate among them. Enter or select a page number or use the arrow buttons to move forward or backward in the list of pages.
Click the icons above the table to perform the following operations:
| Icon | Name | Description |
|---|---|---|
| Display as a printable page | ||
| Refresh | Refresh with data from the VSM GUI database | |
| Detach | Display in a separate window | |
| Help | Display VSM GUI Help | |
| Close All Tabs | Close all tabs and display just the Dashboard |
VTVs Moved
The VTVs Moved detail tab lists by moved VTV the results of the command that is currently selected in the Command Log.
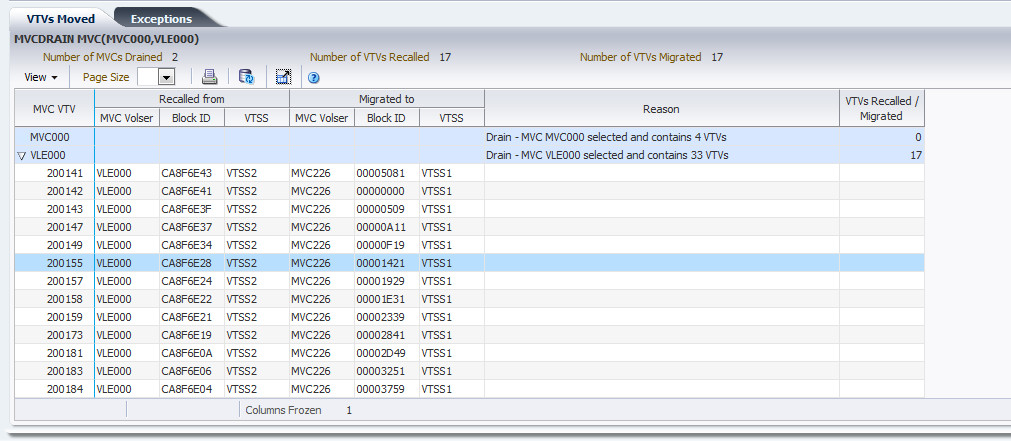
Table columns and descriptions include:
| Column | Description |
|---|---|
| MVC VTV | The MVC volser (collapsed) and its VTV volsers (expanded) |
| MVC Volser Recalled From | The MVC volser the VTV was recalled from |
| Block ID Recalled From | The Block ID the VTV was recalled from |
| VTSS Recalled From | The VTSS the VTV was recalled from |
| MVC Volser Migrated To | The MVC volser the VTV was migrated to |
| Block ID Migrated To | The Block ID the VTV was migrated to |
| VTSS Migrated To | The VTSS the VTV was migrated to |
| Reason | The reason the MVC was recalled or migrated |
| VTVs Recalled /Migrated | The number of VTVs in the MVC that were recalled or migrated |
Columns Hidden indicates the number of columns in the table that are not being displayed. These are displayed using the View menu.
Columns Frozen is the number of left-hand columns that remain static when the horizontal scroll bar is moved. A blue vertical line separates these columns from the others.
Use the View menu to perform the following operations:
| View Option | Description |
|---|---|
| Scroll Table | Enable or disable scrolling |
| Columns | Show all or selected columns and manage hidden/visible status |
| Detach | Display the table in a separate window |
| Sort | Sort the column in ascending or descending order |
| Reorder Columns | Select the column sequence for Visible columns |
Use the Page Size menu to specify the number of rows to include on a data table page.
If there are multiple pages, use the Page feature at the bottom of the table to navigate among them. Enter or select a page number or use the arrow buttons to move forward or backward in the list of pages.
Click the icons above the table to perform the following operations:
| Icon | Name | Description |
|---|---|---|
| Display as a printable page | ||
| Refresh | Refresh with data from the VSM GUI database | |
| Detach | Display in a separate window | |
| Help | Display VSM GUI Help | |
| Close All Tabs | Close all tabs and display just the Dashboard |
VTV Results
The VTV Results detail tab lists by VTV the results of the command that is currently selected in the Command Log.
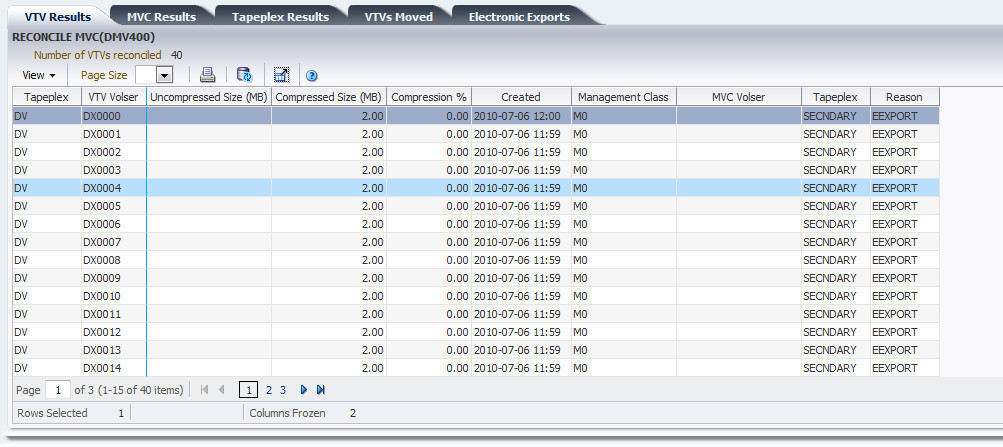
Table columns and descriptions include:
| Column | Description |
|---|---|
| Tapeplex | The name of the tapeplex where the VTV is located |
| VTV Volser | The volser of the VTV |
| Uncompressed Size (MB) | The uncompressed VTV size in megabytes |
| Compressed Size (MB) | The compressed VTV size in megabytes |
| Compression Percentage | The VTV compression percentage |
| Created | The VTV creation date and time |
| Management Class | The management class assigned to the VTV |
| MVC Volser | The name of the MVC volser for the reconciled VTV |
| Tapeplex | The name of the new tapeplex for the reconciled VTV |
| Reason | The reason the VTV was reconciled |
Columns Hidden indicates the number of columns in the table that are not being displayed. These are displayed using the View menu.
Columns Frozen is the number of left-hand columns that remain static when the horizontal scroll bar is moved. A blue vertical line separates these columns from the others.
Use the View menu to perform the following operations:
| View Option | Description |
|---|---|
| Scroll Table | Enable or disable scrolling |
| Columns | Show all or selected columns and manage hidden/visible status |
| Detach | Display the table in a separate window |
| Sort | Sort the column in ascending or descending order |
| Reorder Columns | Select the column sequence for Visible columns |
Use the Page Size menu to specify the number of rows to include on a data table page.
If there are multiple pages, use the Page feature at the bottom of the table to navigate among them. Enter or select a page number or use the arrow buttons to move forward or backward in the list of pages.
Click the icons above the table to perform the following operations:
| Icon | Name | Description |
|---|---|---|
| Selected Row Data | Show data for selected rows | |
| Export to Excel | Export all rows to an Excel spreadsheet | |
| Display as a printable page | ||
| Filter | See "Using Filters" | |
| Reset Filter | Reset the data filter | |
| Refresh | Refresh with data from the VSM GUI database | |
| Detach | Display in a separate window | |
| Help | Display VSM GUI Help | |
| Run ELS | Refresh data by running the necessary ELS commands to update all of the database tables that are referenced on the page | |
| Close All Tabs | Close all tabs and display just the Dashboard |
Electronic Exports
The Electronic Exports detail tab lists VTVs that were electronically exported by the command that is currently selected in the Command Log.
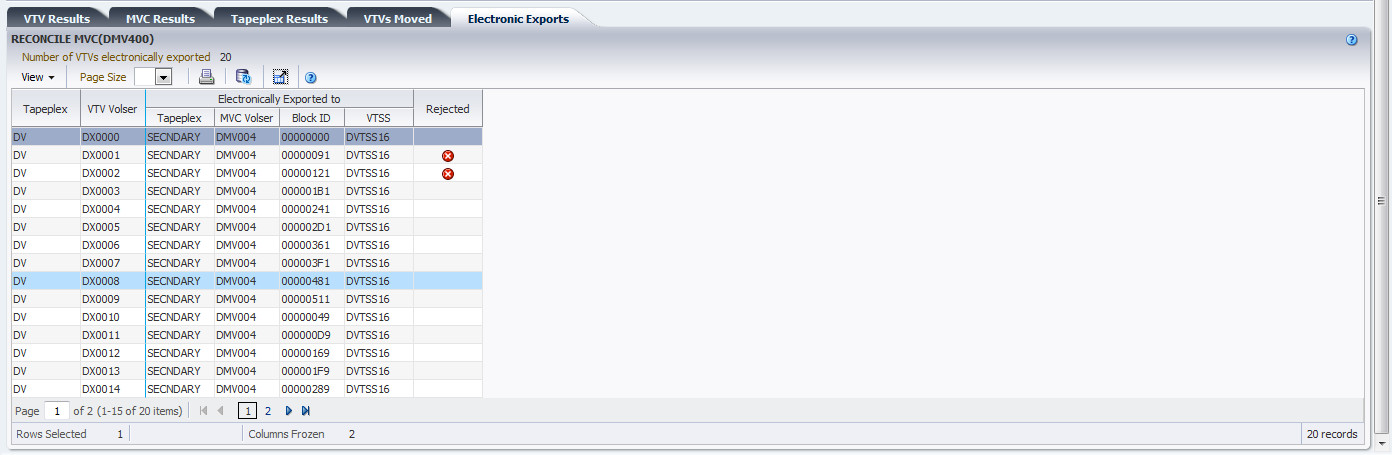
Electronic Exports that were rejected are denoted in the Rejected column with an icon:
| Icon | Name | Description |
|---|---|---|
| Critical | Indicates exceptions occurred during the running of a command. |
Click the icon to display the "Exceptions" tab.
Table columns and descriptions include:
| Column | Description |
|---|---|
| Tapeplex | The name of the tapeplex where the VTV resides |
| Tapeplex Exported To | The name of the tapeplex the VTV is electronically exported to |
| MVC Volser Exported To | The MVC the VTV is electronically exported to |
| Block ID Exported To | The Block ID the VTV is electronically exported to |
| VTSS Exported To | The name of the VTSS the VTV is electronically exported to |
| Rejected | Indicates if the electronic export has been rejected |
Columns Hidden indicates the number of columns in the table that are not being displayed. These are displayed using the View menu.
Columns Frozen is the number of left-hand columns that remain static when the horizontal scroll bar is moved. A blue vertical line separates these columns from the others.
Use the View menu to perform the following operations:
| View Option | Description |
|---|---|
| Scroll Table | Enable or disable scrolling |
| Columns | Show all or selected columns and manage hidden/visible status |
| Detach | Display the table in a separate window |
| Sort | Sort the column in ascending or descending order |
| Reorder Columns | Select the column sequence for Visible columns |
Use the Page Size menu to specify the number of rows to include on a data table page.
If there are multiple pages, use the Page feature at the bottom of the table to navigate among them. Enter or select a page number or use the arrow buttons to move forward or backward in the list of pages.
Click the icons above the table to perform the following operations:
| Icon | Name | Description |
|---|---|---|
| Display as a printable page | ||
| Refresh | Refresh with data from the VSM GUI database | |
| Detach | Display in a separate window | |
| Help | Display VSM GUI Help | |
| Close All Tabs | Close all tabs and display just the Dashboard |
Vary Output
The Vary Output detail tab shows the result of the Vary command that is selected in the Command Log, with a link to the appropriate Display page (Display CLINK, Display Drive, or Display VTSS) where you can see the results of the command.
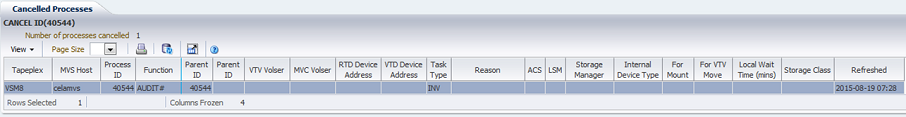
Cancelled Processes
The Cancelled Processes detail tab lists Queued and Active processes that were manually cancelled using the "Cancel a Process" function on the "Active Processes" or "Queued Processes" tabs.
Click the arrows in any column header to sort the data table by that column in ascending or descending order.
Table columns and descriptions include:
| Column | Description |
|---|---|
| Tapeplex | The tapeplex name. |
| MVS Host | The MVS host running the process. |
| Process ID | The Process ID for the function, which is a unique number in the range 0 - 65536. When the process ID reaches 65536 it wraps back to zero. |
| Function | The type of request:
AllocSCR: Job allocation request for a scratch VTV. AllocVTV: Job allocation request for a specific VTV. Audit#: Audit utility request. Cancel@: Cancel command. Consold#: Consolidate or export utility task. Consolid: Recall VTVs for remigration to a consolidation MVC. This appears as a child request to an Int_cons or Consold# request. Dismount: Dismount a VTV from a VTD. Display@: Display or query command. Drain: Recall VTVs from MVC for remigration during drain or reclaim processing. This is a child of a VtvMover request. Drain@: Drain command or utility. DrainMVC: There is one DrainMVC request per MVC being drained. DrainMVC, which is a child request of a Drain@ request, is responsible for managing the entire drain process for a single MVC. The VTV column indicates the status of the processing against the MVC. DELETSCR: Delete scratch utility. Getmgpol: Obtain current management and storage class definitions. Getconfig: Get configuration information HSCChnge: Notification of parameter files being changed. Import#: Importing of VTV or MVC by a utility. Int_cons: PGMI initiated consolidate request MEDVERfy: Media Verify parent task Migrate: General request to perform the migrations of VTVs to a MVC. This may appear as a child to other request types. Migrate@: Migrate command or utility. This includes migrates to threshold and auto migrates. Mount: Mount a VTV upon a VTD. Depending upon circumstances, this may be subsequently seen as a VTV transfer or recall request. Move MVC: There is one Move MVC request per MVC being processed by reconcile or archive. Move MVC, which is a child request of a MoveVTV# request, is responsible for managing the entire VTV movement process for a single MVC. The VTV column indicates the status of the processing against the MVC. |
| MoveVTV#: This is a request from the ARCHIVE or RECONCILE utility commands to move copies of VTVs between MVCs. The value -TIME- in the VTV column indicates that the ELAPSED parameter was specified.
MvcMaint: MVCMAINT utility request. MVC_chek: Check status of MVC. MVC_eot: Reset the end of tape position of a MVC after completing a drain or reclaim. This is a child of either a DrainMVC, ReclmMVC or Move MVC request. MVC_inv: Audit of an MVC. This appears as a child request to an Audit# request.MVCpool#: Obtain details and status of MVC pools for a utility.PGMI_req: A request received through the PGMI interface that has yet to be decoded.Query@l: Query or Display command. MVC_upd: Reset or update MVC status. Recall: General request to perform the recall of VTVs from a MVC. This may include a Cross TapePlex Autorecall (CTA) request from the mounting system. Recall may appear as a child to other request types. Recall@: Recall command or utility. Reclaim@: Auto reclaim request or a Reclaim command or utility. The value -TIME- in the VTV column indicates that the ELAPSED parameter was specified. ReclmMVC: There is one ReclmMVC request per MVC being reclaimed. ReclmMVC, which is a child request of a Reclaim@ request, is responsible for managing the entire reclaim process for a single MVC. The VTV column indicates the status of the processing against the MVC. Reconcil: Perform a crosscheck between the contents of the two VTSSs in a cluster. Replicat: Perform the replication of VTVs between VTSSs in a cluster. Scratch: Scratch a VTV request from HSC. Sel_scr: PGMI select scratch Set@: Set command. Transfer: Mount a VTV upon a VTD by transferring the VTV between two VTSSs. Unload: Unload MVC from RTD. Uscratch: Unscratch a VTV request from HSC. Vary_dev: Perform very processing against an individual RTD or CLINK. This appears as a child request to an VARY@ request. Vary@: Vary command. VtvMaint: VTVMAINT utility request. |
|
| VTVMover: There is one VTVMover request per MVC being drained or reclaimed. This is a child of either a DrainMVC, ReclmMVC or Move MVC request. This request is responsible for the movement of VTVs from one MVC to another.
VTSS_inv: Audit of a VTSS. This appears as a child request to an Audit# request. VTSS_list: Obtain a list of VTV resident within a VTSS. This appears as a child request to a Reconcil or auto migration request. VTV_upd: Resynchronize VTV status in the VTSS with the CDS. |
|
| Parent ID | The ID of the parent process associated with the request. |
| VTSS | The VTSS name or the VTSS list name associated with the request. |
| VTV Volser | The volser of the VTV currently being used in the process. |
| MVC Volser | The volser of the MVC currently being used in the process. |
| RTD Device Address | The unit address of the RTD currently being used in the process. |
| VTD Device Address | The device address of the VTD currently being used in the process |
| Task Type | The task that is processing the queue or the task to which the request is queued. |
| Reason | The reason why the process is active. |
| ACS | The ACS the process is using. |
| LSM | The LSM the process is using. |
| Storage Manager | The Storage manager the process is using. |
| Internal Device Type | The Internal device type the process is using. |
| For Mount | Indicates if the process is for a mount. |
| For VTV Move | Indicates if the process is for VTV moves. |
| Local Wait Time (mins) | The local wait time in minutes. |
| Storage Class | The storage class for migration targets. |
| Refreshed | The date and UTC time the data was stored or updated. |
Columns Hidden indicates the number of columns in the table that are not being displayed. These are displayed using the View menu.
Columns Frozen is the number of left-hand columns that remain static when the horizontal scroll bar is moved. A blue vertical line separates these columns from the others.
Use the View menu to perform the following operations:
| View Option | Description |
|---|---|
| Scroll Table | Enable or disable scrolling |
| Columns | Show all or selected columns and manage hidden/visible status |
| Detach | Display the table in a separate window |
| Sort | Sort the column in ascending or descending order |
| Reorder Columns | Select the column sequence for Visible columns |
Use the Page Size menu to specify the number of rows to include on a data table page.
If there are multiple pages, use the Page feature at the bottom of the table to navigate among them. Enter or select a page number or use the arrow buttons to move forward or backward in the list of pages.
Click the icons above the table to perform the following operations:
| Icon | Name | Description |
|---|---|---|
| Display as a printable page | ||
| Refresh | Refresh with data from the VSM GUI database | |
| Detach | Display in a separate window | |
| Help | Display VSM GUI Help | |
| Run ELS | Refresh data by running the necessary ELS commands to update all of the database tables that are referenced on the page | |
| Close All Tabs | Close all tabs and display just the Dashboard |