Database Update Log
The database update log details the state and status of processes that are run to update the VSM GUI database and displays any error messages that were generated for each process.
Select Administration and Database Update Logs on the navigation tree.
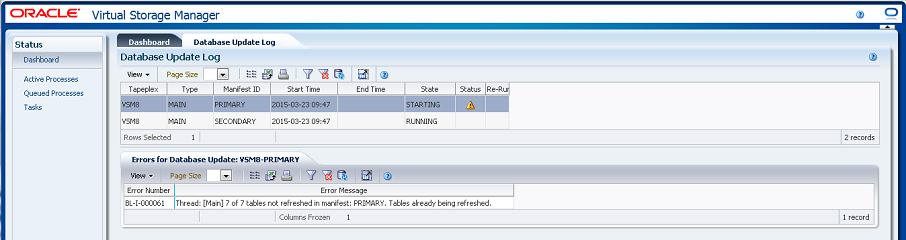
Database Update Log Data Table
This data table shows VSM GUI database update process status.
If errors have occurred, the Status field will contain a status indicator.
If a status indicator is displayed, select that row to display error information about that database update process in the "Errors for Database Update" data table.
| Icon | Name | Description |
|---|---|---|
| Warning | Indicates an error may have occurred | |
| Critical | Indicates a critical error has occurred | |
| Unknown | Indicates status could not be detected |
Click the arrows in any column header to sort the data table by that column in ascending or descending order.
Fields with a context menu indicator can initiate Management commands on specific data items. Right click a field to display the context menu and select the desired menu item.
You can also filter data for individual data columns to further isolate specific information. See "Using Filters" for information about this feature.
Table columns and descriptions include:
| Column | Description |
|---|---|
| Tapeplex | The tapeplex the database update process was run on |
| Type | The database update type |
| Manifest ID | The manifest ID of the database update process |
| Start Time | The date and time the database update process started |
| End Time | The date and time the database update process ended |
| State | The state of the database update process |
| Status | The status indicator for the database update process |
| Re-Run | Enables the corresponding Command Refresh update to be re-launched. This is not available for PRIMARY and SECONDARY manifests as these updates are run automatically. |
Columns Hidden indicates the number of columns in the table that are not being displayed. These are displayed using the View menu.
Columns Frozen is the number of left-hand columns that remain static when the horizontal scroll bar is moved. A blue vertical line separates these columns from the others.
Use the View menu to perform the following operations:
| View Option | Description |
|---|---|
| Scroll Table | Enable or disable scrolling |
| Columns | Show all or selected columns and manage hidden/visible status |
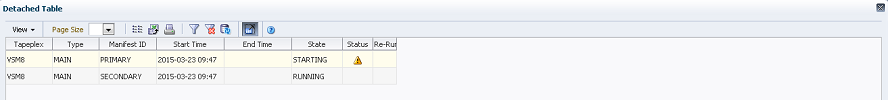
| Detach | Display the table in a separate window |
| Sort | Sort the column in ascending or descending order |
| Reorder Columns | Select the column sequence for Visible columns |
Use the Page Size menu to specify the number of rows to include on a data table page.
If there are multiple pages, use the Page feature at the bottom of the table to navigate among them. Enter or select a page number or use the arrow buttons to move forward or backward in the list of pages.
Click the icons above the table to perform the following operations:
| Icon | Name | Description |
|---|---|---|
| Selected Row Data | Show data for selected rows | |
| Export to Excel | Export all rows to an Excel spreadsheet | |
| Display as a printable page | ||
| Filter | See "Using Filters" | |
| Reset Filter | Reset the data filter | |
| Refresh | Refresh with data from the VSM GUI database | |
| Detach | Display in a separate window | |
| Help | Display VSM GUI Help | |
| Close All Tabs | Close all tabs and display just the Dashboard |
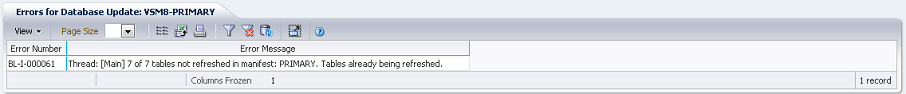
Errors for Database Update
This data table shows the error number and error message for the selected database update process with errors.
Click the arrows in any column header to sort the data table by that column in ascending or descending order.
You can also filter data for individual data columns to further isolate specific information. See "Using Filters" for information about this feature.
Table columns and descriptions include:
| Column | Description |
|---|---|
| Error Number | The error number with the selected database update process |
| Error Message | The error message with the selected database update process |
Columns Hidden indicates the number of columns in the table that are not being displayed. These are displayed using the View menu.
Columns Frozen is the number of left-hand columns that remain static when the horizontal scroll bar is moved. A blue vertical line separates these columns from the others.
Use the View menu to perform the following operations:
| View Option | Description |
|---|---|
| Scroll Table | Enable or disable scrolling |
| Columns | Show all or selected columns and manage hidden/visible status |
| Detach | Display the table in a separate window |
| Sort | Sort the column in ascending or descending order |
| Reorder Columns | Select the column sequence for Visible columns |
Use the Page Size menu to specify the number of rows to include on a data table page.
If there are multiple pages, use the Page feature at the bottom of the table to navigate among them. Enter or select a page number or use the arrow buttons to move forward or backward in the list of pages.
Click the icons above the table to perform the following operations:
| Icon | Name | Description |
|---|---|---|
| Selected Row Data | Show data for selected rows | |
| Export to Excel | Export all rows to an Excel spreadsheet | |
| Display as a printable page | ||
| Filter | See "Using Filters" | |
| Reset Filter | Reset the data filter | |
| Refresh | Refresh with data from the VSM GUI database | |
| Detach | Display in a separate window | |
| Help | Display VSM GUI Help | |
| Close All Tabs | Close all tabs and display just the Dashboard |