Display Drive
This pane displays Real Tape Drive and virtual Real Tape Drive information.
To display, select Display and Drive on the navigation tree.
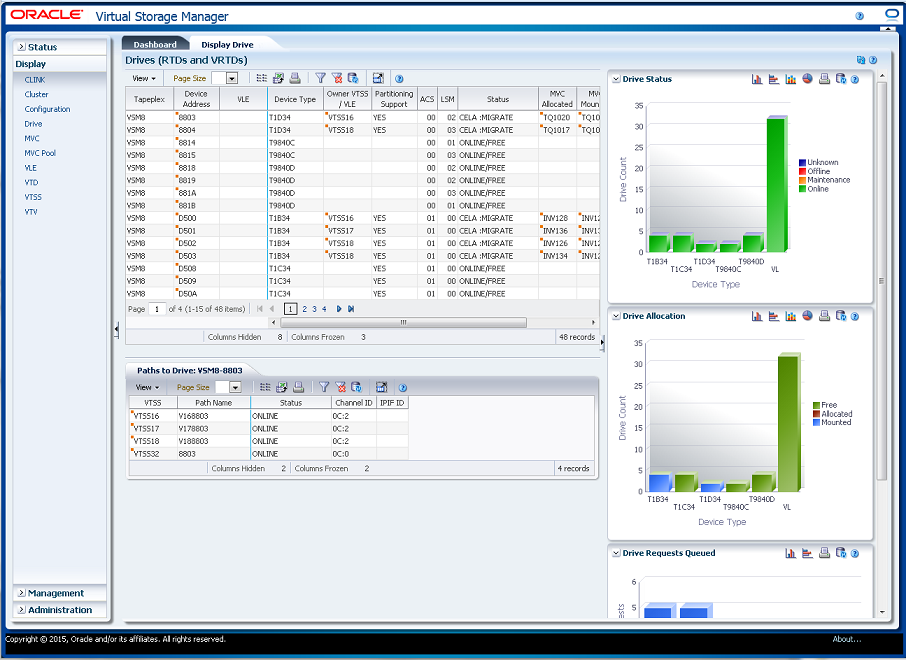
Drives (RTDs and vRTDs)
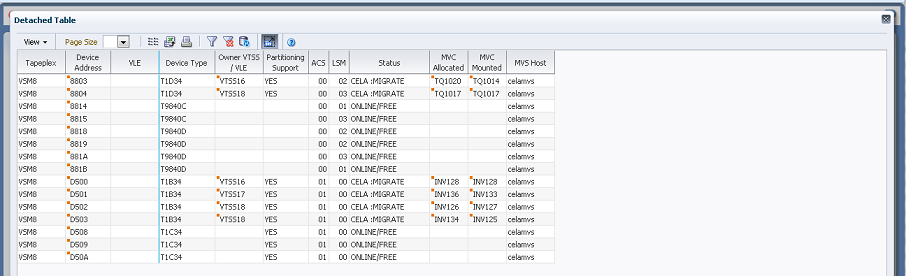
This data table displays RTD and vRTD drive information.
You may need to scroll horizontally or detach the table to view all columns.
Click the arrows in any column header to sort the data table by that column in ascending or descending order.
Click a row to display paths to that drive in the "Paths to Drive" data table.
Fields with a context menu indicator can initiate Management commands on specific data items. Right click a field to display the context menu and select the desired menu item.
You can also filter data for individual data columns to further isolate specific information. See "Using Filters" for information about this feature.
Table columns and descriptions include:
| Column | Description |
|---|---|
| Tapeplex | The name of the tapeplex. |
| Device Address | The RTD Address.
Context menu: Vary Drive. |
| VLE | The VLE that the vRTD is on. |
| Owner VTSS | The VTSS that is currently connected to the RTD. |
| Device Type | The device type (RTD Type) of the RTD. |
| Partitioning Support | The partitioning support setting, Yes, No, or Unknown. |
| ACS | The ACS the RTD is attached to. |
| LSM | The LSM the RTD is attached to. |
| Status | One of the following RTD statuses:
RECOVER RTD: The RTD is being reset after a problem, a vary, or an initialization. MIGRATE VTV: The RTD is migrating a VTV. RECALL VTV: The RTD is recalling a VTV. UNLOAD MVC: A forced unload of the RTD is occurring. VTV TRANSFER: The RTD is migrating a VTV before recalling it on another VTSS. AUDIT MVC: An MVC is being audited. BUSY: The RTD is busy (non-specific task). IDLE: An MVC is allocated to the RTD but the MVC is not being used. ONLINE/FREE: The RTD is online and available. MAINTENANCE: The RTD is in maintenance mode. OFFLINE: The RTD is offline and unavailable to all hosts and VTSSs RECOVERY: The RTD is being reset after an error or a vary online. INITIALIZE: The host is verifying RTD status and availability. SUSPEND: The RTD operations are suspended. This occurs when one or more RTDs and a CLINK are configured on the same port. The RTDs remain in SUSPEND mode while the CLINK is online. PATH OFFLINE: The RTD status is unknown because the VTSS cannot contact the RTD or if the paths were not correctly configured. PATH SUSPEND: The RTD is globally online but the path from the VTSS is suspended due to the RTD being paired with a Clink. FAIL/OFFLINE: The RTD was placed offline due to a failure. TOP ID: The process Id of the request that is top of the queue for next using this RTD from this host. TOP HOST: The host which has the request that is top of the queue for next using this RTD. |
| MVC Allocated | The volser of the MVC allocated for mounting on the RTD. |
| MVC Mounted | The MVC that is currently mounted on the RTD. |
| MVS Host | The host that currently owns the RTD. |
| MVC Volser | The volser of the MVC currently mounted on the RTD or allocated to the RTD for mounting. |
| Requests Queued | The number of requests that are currently queued. |
| Allocation Time Remaining (mins) | The allocation time remaining, in minutes. |
| Local Wait Time (mins) | The local wait time, in minutes. |
| Global Wait Time (mins) | The global wait time, in minutes. |
| Internal Device Type | The internal coding of the device type. |
| Serial Number | The serial number of the RTD. |
| Refreshed | The date and UTC time the data was stored or last updated. |
Columns Hidden indicates the number of columns in the table that are not being displayed. These are displayed using the View menu.
Columns Frozen is the number of left-hand columns that remain static when the horizontal scroll bar is moved. A blue vertical line separates these columns from the others.
Use the View menu to perform the following operations:
| View Option | Description |
|---|---|
| Scroll Table | Enable or disable scrolling |
| Columns | Show all or selected columns and manage hidden/visible status |
| Detach | Display the table in a separate window |
| Sort | Sort the column in ascending or descending order |
| Reorder Columns | Select the column sequence for Visible columns |
Use the Page Size menu to specify the number of rows to include on a data table page.
If there are multiple pages, use the Page feature at the bottom of the table to navigate among them. Enter or select a page number or use the arrow buttons to move forward or backward in the list of pages.
Click the icons above the table to perform the following operations:
| Icon | Name | Description |
|---|---|---|
| Selected Row Data | Show data for selected rows | |
| Export to Excel | Export all rows to an Excel spreadsheet | |
| Display as a printable page | ||
| Filter | See "Using Filters" | |
| Reset Filter | Reset the data filter | |
| Refresh | Refresh with data from the VSM GUI database | |
| Detach | Display in a separate window | |
| Help | Display VSM GUI Help | |
| Run ELS | Refresh data by running the necessary ELS commands to update all of the database tables that are referenced on the page | |
| Close All Tabs | Close all tabs and display just the Dashboard |
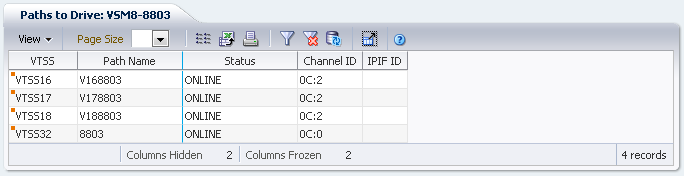
Paths to Drive
This data table displays path information about the selected drive.
You may need to scroll horizontally or detach the table to view all columns.
Click the arrows in any column header to sort the data table by that column in ascending or descending order.
You can also filter data for individual data columns to further isolate specific information. See "Using Filters" for information about this feature.
Table columns and descriptions include:
| Column | Description |
|---|---|
| VTSS | The VTSS name. |
| Path Name | The drive path name. |
| Status | The drive's current status.
RECOVER RTD: The RTD is being reset after a problem, a vary, or an initialization. MIGRATE VTV: The RTD is migrating a VTV. RECALL VTV: The RTD is recalling a VTV. UNLOAD MVC: A forced unload of the RTD is occurring. VTV TRANSFER: The RTD is migrating a VTV before recalling it on another VTSS. AUDIT MVC: An MVC is being audited. BUSY: The RTD is busy (non-specific task). IDLE: An MVC is allocated to the RTD but the MVC is not being used. ONLINE/FREE: The RTD is online and available. MAINTENANCE: The RTD is in maintenance mode. OFFLINE: The RTD is offline and unavailable to all hosts and VTSSs RECOVERY: The RTD is being reset after an error or a vary online. INITIALIZE: The host is verifying RTD status and availability. SUSPEND: The RTD operations are suspended. This occurs when one or more RTDs and a CLINK are configured on the same port. The RTDs remain in SUSPEND mode while the CLINK is online. PATH OFFLINE: The RTD status is unknown because the VTSS cannot contact the RTD or if the paths were not correctly configured. PATH SUSPEND: The RTD is globally online but the path from the VTSS is suspended due to the RTD being paired with a Clink. FAIL/OFFLINE: The RTD was placed offline due to a failure. TOP ID: The process Id of the request that is top of the queue for next using this RTD from this host. TOP HOST: The host which has the request that is top of the queue for next using this RTD. |
| Channel ID | The channel ID of the drive path. |
| IPIF ID | The IPIF value that was specified for the path. |
| Logical Device ID | The logical device ID assigned to the path. |
| Refreshed | The date and UTC time the data was stored or last updated. |
Columns Hidden indicates the number of columns in the table that are not being displayed. These are displayed using the View menu.
Columns Frozen is the number of left-hand columns that remain static when the horizontal scroll bar is moved. A blue vertical line separates these columns from the others.
Use the View menu to perform the following operations:
| View Option | Description |
|---|---|
| Scroll Table | Enable or disable scrolling |
| Columns | Show all or selected columns and manage hidden/visible status |
| Detach | Display the table in a separate window |
| Sort | Sort the column in ascending or descending order |
| Reorder Columns | Select the column sequence for Visible columns |
Use the Page Size menu to specify the number of rows to include on a data table page.
If there are multiple pages, use the Page feature at the bottom of the table to navigate among them. Enter or select a page number or use the arrow buttons to move forward or backward in the list of pages.
Click the icons above the table to perform the following operations:
| Icon | Name | Description |
|---|---|---|
| Selected Row Data | Show data for selected rows | |
| Export to Excel | Export all rows to an Excel spreadsheet | |
| Display as a printable page | ||
| Filter | See "Using Filters" | |
| Reset Filter | Reset the data filter | |
| Refresh | Refresh with data from the VSM GUI database | |
| Detach | Display in a separate window | |
| Help | Display VSM GUI Help | |
| Run ELS | Refresh data by running the necessary ELS commands to update all of the database tables that are referenced on the page | |
| Close All Tabs | Close all tabs and display just the Dashboard |
Drive Status
This graph shows the current drive count by device type, sorted by drive status.
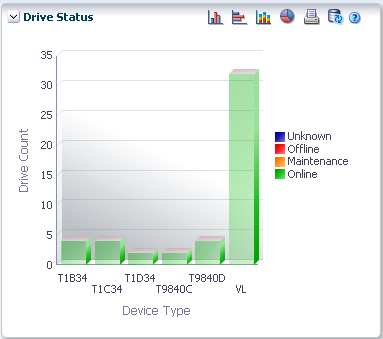
Hover on an object to display summary data for the object.
Hover on a label to highlight related objects in the graph.
Click an object to filter the data table by that object.
Click the icons above the graph to perform the following operations:
| Icon | Name | Description |
|---|---|---|
| Vertical bar graph | Display the graph as a vertical bar chart | |
| Horizontal bar graph | Display the graph as a horizontal bar chart | |
| Stacked bar graph | Display the graph as a stacked bar chart | |
| Pie chart | Display the graph as a pie chart | |
| Display as a printable page | ||
| Refresh | Refresh with data from the VSM GUI database | |
| Help | Display VSM GUI Help | |
| Run ELS | Refresh data by running the necessary ELS commands to update all of the database tables that are referenced on the page | |
| Close All Tabs | Close all tabs and display just the Dashboard |
Drive Allocation
This graph shows the current drive count by device type, sorted by allocation state.
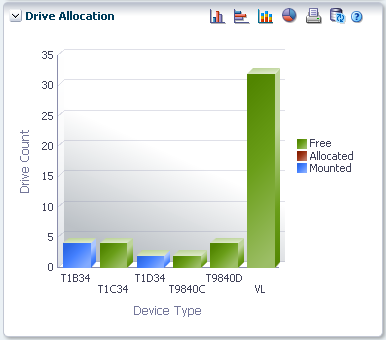
Hover on an object to display summary data for the object.
Hover on a label to highlight related objects on the graph.
Click an object to filter the data table by that object.
Click the icons above the graph to perform the following operations:
| Icon | Name | Description |
|---|---|---|
| Vertical bar graph | Display the graph as a vertical bar chart | |
| Horizontal bar graph | Display the graph as a horizontal bar chart | |
| Stacked bar graph | Display the graph as a stacked bar chart | |
| Pie chart | Display the graph as a pie chart | |
| Display as a printable page | ||
| Refresh | Refresh with data from the VSM GUI database | |
| Help | Display VSM GUI Help | |
| Run ELS | Refresh data by running the necessary ELS commands to update all of the database tables that are referenced on the page | |
| Close All Tabs | Close all tabs and display just the Dashboard |
Drive Requests Queued
This graph shows the current number of requests queued at each device address.
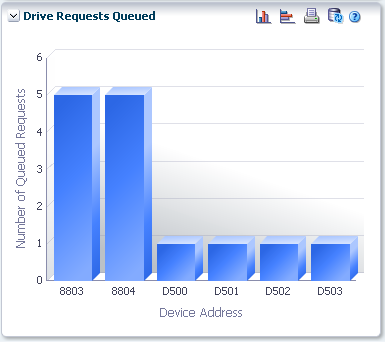
Hover on an object to display summary data for the object.
Click an object to filter the data table by that object.
Click the icons above the graph to perform the following operations:
| Icon | Name | Description |
|---|---|---|
| Vertical bar graph | Display the graph as a vertical bar chart | |
| Horizontal bar graph | Display the graph as a horizontal bar chart | |
| Stacked bar graph | Display the graph as a stacked bar chart | |
| Pie chart | Display the graph as a pie chart | |
| Display as a printable page | ||
| Refresh | Refresh with data from the VSM GUI database | |
| Help | Display VSM GUI Help | |
| Run ELS | Refresh data by running the necessary ELS commands to update all of the database tables that are referenced on the page | |
| Close All Tabs | Close all tabs and display just the Dashboard |