Display MVC Pool
This pane displays Multi-Volume Cartridge Pool information.
To display, select Display and MVC Pool on the navigation tree.
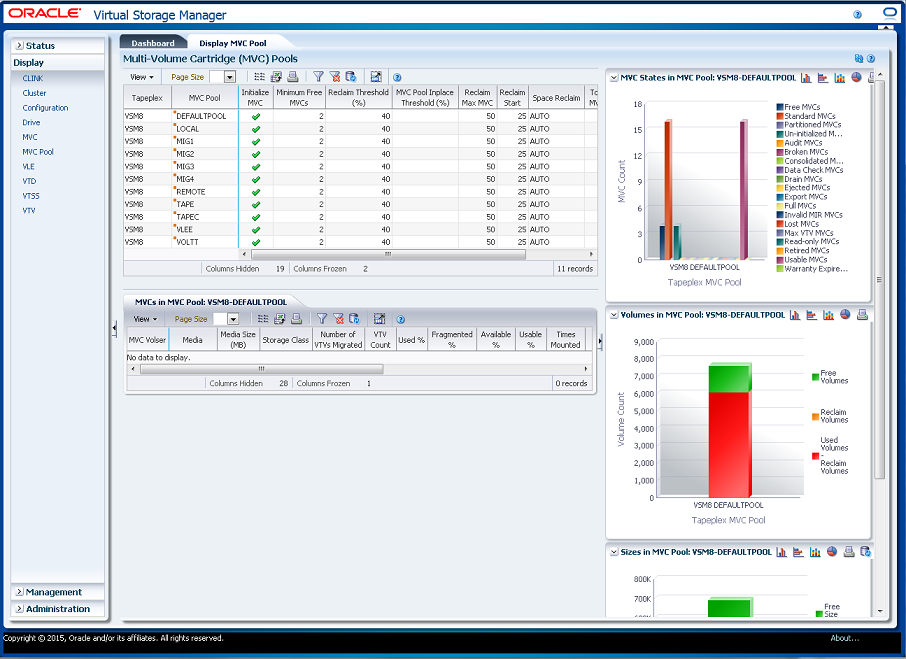
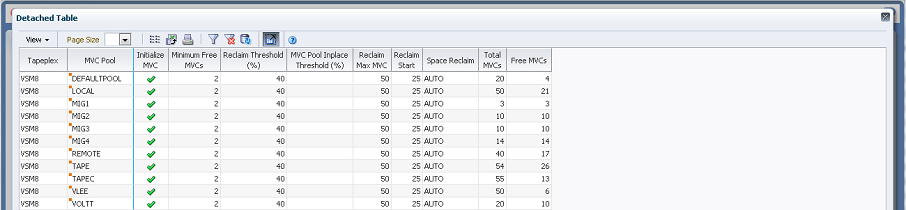
Multi-Volume Cartridge (MVC) Pools
This data table shows MVC Pool information.
You may need to scroll horizontally or detach the table to view all columns.
Click a row to display MVCs for that MVC Pool in the "MVCs in MVC Pool"data table.
Click the arrows in any column header to sort the data table by that column in ascending or descending order.
Fields with a context menu indicator can initiate Management commands on specific data items. Right click a field to display the context menu and select the desired menu item.
You can also filter data for individual data columns to further isolate specific information. See "Using Filters" for information about this feature.
Table columns and descriptions include:
| Column | Description |
|---|---|
| Tapeplex | The tapeplex the MVC Pool belongs to. |
| MVC Pool | The MVC Pool name.
Context menu: MVC Drain, Reclaim. |
| Initialize MVC | Indicates if un-initialized MVCs are to be initialized when first mounted. |
| Minimum Free MVCs | The minimum number of free MVCs. |
| Reclaim Threshold Percentage | The fragmented space threshold (as a percentage) that determines when an MVC is eligible for demand or automatic reclamation. |
| MVC Pool Inplace Threshold Percentage | The fragmented space threshold (as a percentage) that determines when an MVC in partitioned format is eligible for dynamic reclaim processing. |
| Reclaim Max MVC | The MVC limit for a single reclaim. |
| Reclaim Start | The percentage of reclaim candidates to total MVCs that trigger automatic reclaim. |
| Space Reclaim | The space reclamation setting. |
| Total MVCs | The number of MVCs in the MVC Pool. |
| Free MVCs | The total number of free MVCs in the MVS Pool. |
| Standard MVCs | The number of initialized standard MVCs. in the MVC Pool. |
| Partitioned MVCs | The number of initialized partitioned MVCs in the MVC Pool. |
| Un-initiated MVCs | The number of un-initialized MVCs in the MVC Pool. |
| Audit MVCs | The number of MVCs with status AUDIT. |
| Broken MVCs | The number of MVCs with status BROKE. |
| Consolidated MVCs | The number of MVCs with status CONSOLIDATE. |
| Data Check MVCs | The number of MVCs with data checks. |
| Drain MVCs | The number of MVCs with status DRAIN. |
| Ejected MVCs | The number of MVCs with status EJECTED. |
| Export MVCs | The number of MVCs with status EXPORT |
| Full MVCs | The number of MVCs marked FULL. |
| Invalid MIR MVCs | The number of MVCs with Invalid MIRs |
| Lost MVCs | The number of MVCs with status LOST. |
| Max VTV MVCs | The number of MVCs with maximum VTVs. |
| Read-only MVCs | The number of MVCs marked Read-Only. |
| Retired MVCs | The number of MVCs marked RETIRED. |
| Usable MVCs | The number of usable MVCs. |
| Warranty Expired MVCs | The number of MVCs with expired warranty. |
| Refreshed | The date and UTC time the data was stored or last updated. |
Columns Hidden indicates the number of columns in the table that are not being displayed. These are displayed using the View menu.
Columns Frozen is the number of left-hand columns that remain static when the horizontal scroll bar is moved. A blue vertical line separates these columns from the others.
Use the View menu to perform the following operations:
| View Option | Description |
|---|---|
| Scroll Table | Enable or disable scrolling |
| Columns | Show all or selected columns and manage hidden/visible status |
| Detach | Display the table in a separate window |
| Sort | Sort the column in ascending or descending order |
| Reorder Columns | Select the column sequence for Visible columns |
Use the Page Size menu to specify the number of rows to include on a data table page.
If there are multiple pages, use the Page feature at the bottom of the table to navigate among them. Enter or select a page number or use the arrow buttons to move forward or backward in the list of pages.
Click the icons above the table to perform the following operations:
| Icon | Name | Description |
|---|---|---|
| Selected Row Data | Show data for selected rows | |
| Export to Excel | Export all rows to an Excel spreadsheet | |
| Display as a printable page | ||
| Filter | See "Using Filters" | |
| Reset Filter | Reset the data filter | |
| Refresh | Refresh with data from the VSM GUI database | |
| Detach | Display in a separate window | |
| Help | Display VSM GUI Help | |
| Run ELS | Refresh data by running the necessary ELS commands to update all of the database tables that are referenced on the page | |
| Close All Tabs | Close all tabs and display just the Dashboard |
MVCs in MVC Pool
This data table displays a list of all MVCs in the MVC Pool that was selected in the "Multi-Volume Cartridge (MVC) Pools" data table.
You may need to scroll horizontally or detach the table to view all columns.
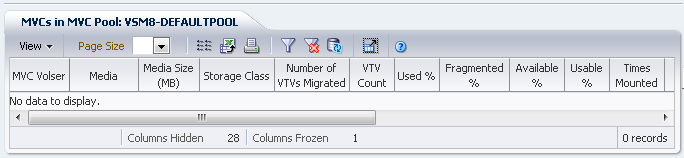
Click a row to display VTVs for that MVC in the "VTVs on MVC" data table.
The status for some fields is summarized with a status indicator:
| Icon | Name | Description |
|---|---|---|
| Good | Indicates no threshold violations are detected | |
| Caution | Indicates warning thresholds have been exceeded | |
| Critical | Indicates critical thresholds have been exceeded | |
| Unknown | Indicates status could not be detected |
Click a status indicator to display its details.
Click the arrows in any column header to sort the data table by that column in ascending or descending order.
Fields with a context menu indicator can initiate Management commands on specific data items. Right click a field to display the context menu and select the desired menu item.
You can also filter data for individual data columns to further isolate specific information. See "Using Filters" for information about this feature.
Table columns and descriptions include:
| Column | Description |
|---|---|
| Tapeplex | The tapeplex the MVC belongs to. |
| MVC Volser | The volser of the MVC.
Context menu: Audit MVC Volser, MVC Drain, Reclaim, Reconcile. |
| Media | The volume media type or recording technique.
If Need PTF is displayed, then this host lacks support for this media type, but another host does have support for this media type. |
| Media Size (MB) | The size of the MVC in megabytes. |
| Storage Class | The Storage Class that owns the MVC. MVCs only become a member of a storage class when they contain migrated VTVs.
Context menu: MVC Drain, Reclaim, Reconcile |
| MVC Pool | The name of the MVC Pool the MVC is in.
Context menu: MVC Drain, Reclaim. |
| Number of VTVs Migrated | The number of current VTVs migrated to this MVC. |
| VTV Count | The number of active VTVs on the MVC. |
| Used Percentage | The percentage of the MVC used by current VTVs. |
| Fragmented Percentage | The percentage of the MVC that contains noncurrent VTVs. This space is not available for use until it is reclaimed or the MVC is drained. |
| Available Percentage | The percentage of the MVC that is physically available for use. |
| Usable Percentage | The percentage of space on the MVC that can be used by VTCS. This may be zero even if there is still space physically available. For instance, if the VTV per MVC limit is reached then the usable percentage is reported as zero. Similarly, if an error has been reported against an MVC, VTCS does not use this MVC for output and the usable percentage is reported as zero. |
| Times Mounted | The number of times the MVC has been mounted for writing or reading since it was added to the MVC inventory. |
| Last Mounted | The date and time at which the MVC was mounted or attempted to be mounted on a RTD. |
| Last Migration | The date and time at which the last VTV migration was performed to the MVC. |
| Last Drain/Reclaim | The date and time at which the MVC was last processed by Drain or Reclaim processing and its end-of-tape pointer was reset. |
| VTSS Last Mounted | The name of the last VTSS that performed a migration to the MVC.
Context menu: Audit VTSS, Vary VTSS. |
| Initialized | Indicates the MVC's initialization status, either standard, partitioned, or not initialized. |
| Audit | Indicates if the MVC is either currently being audited or has been the subject of a failed audit. While in this state the MVC is not used for migration but can be used for recalls. Due to the inherent state, recalls may fail because the CDS is not yet up-to-date with the MVC contents. To clear this condition, rerun the audit against this MVC. |
| Broken | Indicates if the MVC, drive, or combination of the two has a problem. VTCS attempts to depreference MVCs with this state. If the MVC caused the problem, use a DRAIN(EJECT) command to remove the MVC from service. If the RTD caused the problem, use the MVCMAINT utility to reset the MVC state. |
| Consolidation | Indicates if the MVC is consolidation MVC. |
| Data Check | A data check condition has been reported against this MVC. VTCS attempts to depreference the usage of MVCs with this state. To get into this state, a data transfer must have failed upon two different RTDs.
To clear this state: If all VTVs on the MVC are duplexed, use MVC Drain on the MVC without the Eject option. This recovers all VTVs and removes the MVC from service. If all VTVs on the MVC are not duplexed, VTCS AUDIT the MVC. The audit may fail. After the audit, do an MVCDRAIN (no eject). This recalls the VTVs before the data-check area in ascending block-id order and the VTVs after the data-check area in a descending block-id order. Processing the VTVs in this sequence ensures that VTCS recovers as many VTVs as possible from the media. You then need to recreate the data for any VTVs still on the MVC. Although this indicates that a specific failure has occurred when performing data transfers, this may not be a fault in the media. It could be that a RTD is writing data to the media out of specification. Patterns of failures are therefore important. As an example, lots of DATA CHECK conditions suddenly occurring lots of drives and volumes. |
| Deduplication | Indicates if the MVC is deduplicated. |
| Drain | Indicates if the MVC is currently the subject of drain or reclaim processing. Should the processing fail, the MVC may be left in this state as a safeguard. To clear this condition, perform a MVCDRain against the MVC. |
| Eject | Indicates if the MVC has been ejected. |
| Export | Indicates if the MVC is an export MVC. |
| Full | Indicates if there is no space available on the MVC. |
| Invalid MIR | Indicates if VTCS has received status from an RTD to indicate the MIR (media information record) for a 9x40 media is invalid. An invalid MIR does not prevent access to data but may cause significant performance problems while accessing records on the tape. The MVC is not capable of high-speed searches on areas of the tape that do not have a valid MIR entry.
VTCS attempts to depreference MVCs with this condition. For recalls, if the VTV resides on multiple MVCs, VTCS selects MVCs with valid MIRs ahead of MVCs with invalid MIRs. VTCS avoids using MVCs with invalid MIRs for migration, unless the migration is at the beginning of the tape. Migrating from the beginning of tape corrects the MIR. VTCS detects the invalid MIR condition at either mount time or dismount time. If detected at mount time and the operation can be completed with another MVC, VTCS dismounts the first MVC and selects the alternate MVC. VTCS has only a limited ability to switch to an alternate MVC. That is, it is mainly used for migrate and virtual mount. For MVCs with invalid MIRs, determine the cause of the error, which may be caused by media or drive problems, and fix the error. To recover an MVC with an invalid MIR, read the MVC to the end of the tape, with a VTCS audit. If the media is the problem, run an MVCDRAIN EJECT to recall the VTVs and cause the MVC to be removed from the MVC pool. |
| Lost | Indicates if VTCS attempted to mount an MVC and the mount did not complete within a 15-minute time out period. VTCS has had no specific error report although there could be combination of hardware problems, HSC problems, or by the MVC being removed from the ACS. VTCS attempts to depreference the usage of MVCs with this state. Determine the cause of the error and fix it.
You can also use the VTCS MVCMAINT utility to set LOST(OFF) for the following events: LOST(ON) was set due to LSM failures or drive errors that have been resolved. LOST(ON) was set because the MVC was outside the ACS and has been reentered. This condition is automatically cleared by VTCS if it subsequently requests a mount of the MVC and this is successful. |
| Maximum VTV | Indicates if the MVC has reached the maximum number of VTVs. |
| Mounted | Indicates if the MVC is mounted on an RTD. |
| Protected | Indicates if the MVC is protected. |
| Read-only | Indicates if the MVC has been marked read-only:
If this is due to the MVC being the target of an export or consolidation process, the read-only state protects the MVC from further updates. If the MVC media is set to file protect, correct the error and use the MVCMAINT utility to set READONLY(OFF).If the MVC does not have the appropriate SAF rules set to enable VTCS to update the MVC, correct the error and use the MVCMAINT utility to set READONLY(OFF). |
| Retired | Indicates if the MVC is retired and is considered by VTCS as having reached the end of its useful life. VTCS recalls from, but does not migrate to, the MVC. Replace the MVC as soon as possible. Once this has been done, use the MVCMAINT utility to set RETIRED(OFF). |
| Usable | Indicates if the MVC can be used for migration. |
| Warranty Expired | Indicates if the MVC's warranty has expired. VTCS continues to use the MVC but you should start making plans to replace the MVC when it reaches Retired state. |
| Last Verified | The date and time the last VTV media verify was performed to the MVC. This date reflects the last time that VTCS knew the MVC contents were valid. |
| ACS | The ACD ID where the MVC resides. |
| VLE | The VLE where the MVC resides. |
| Consolidated Date | For a consolidation MVC, the date and time of the consolidation. |
| EOT Block ID | The end-of-tape block ID. |
| EOT Partition ID | The end-of-tape partition ID. |
| Block ID First Space | The block ID of the first space on the MVC. |
| Refreshed | The date and UTC time the data was stored or last updated. |
Columns Hidden indicates the number of columns in the table that are not being displayed. These are displayed using the View menu.
Columns Frozen is the number of left-hand columns that remain static when the horizontal scroll bar is moved. A blue vertical line separates these columns from the others.
Use the View menu to perform the following operations:
| View Option | Description |
|---|---|
| Scroll Table | Enable or disable scrolling |
| Columns | Show all or selected columns and manage hidden/visible status |
| Detach | Display the table in a separate window |
| Sort | Sort the column in ascending or descending order |
| Reorder Columns | Select the column sequence for Visible columns |
Use the Page Size menu to specify the number of rows to include on a data table page.
If there are multiple pages, use the Page feature at the bottom of the table to navigate among them. Enter or select a page number or use the arrow buttons to move forward or backward in the list of pages.
Click the icons above the table to perform the following operations:
| Icon | Name | Description |
|---|---|---|
| Selected Row Data | Show data for selected rows | |
| Export to Excel | Export all rows to an Excel spreadsheet | |
| Display as a printable page | ||
| Filter | See "Using Filters" | |
| Reset Filter | Reset the data filter | |
| Refresh | Refresh with data from the VSM GUI database | |
| Detach | Display in a separate window | |
| Help | Display VSM GUI Help | |
| Run ELS | Refresh data by running the necessary ELS commands to update all of the database tables that are referenced on the page | |
| Close All Tabs | Close all tabs and display just the Dashboard |
MVC States in MVC Pool
This graph shows the number of MVCs in the selected MVC Pool, sorted by current MVC state.
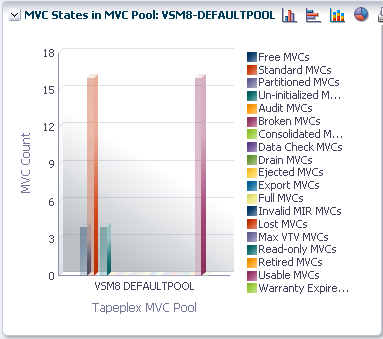
Hover on an object to display summary data for the object.
Hover on a label to highlight related objects on the graph.
Click an object to filter the data table by that object.
Click the icons above the graph to perform the following operations:
| Icon | Name | Description |
|---|---|---|
| Vertical bar graph | Display the graph as a vertical bar chart | |
| Horizontal bar graph | Display the graph as a horizontal bar chart | |
| Stacked bar graph | Display the graph as a stacked bar chart | |
| Pie chart | Display the graph as a pie chart | |
| Display as a printable page | ||
| Refresh | Refresh with data from the VSM GUI database | |
| Help | Display VSM GUI Help | |
| Run ELS | Refresh data by running the necessary ELS commands to update all of the database tables that are referenced on the page | |
| Close All Tabs | Close all tabs and display just the Dashboard |
Volumes in MVC Pool
This graph shows the number of MVCs in the selected MVC Pool, sorted by current usage state.
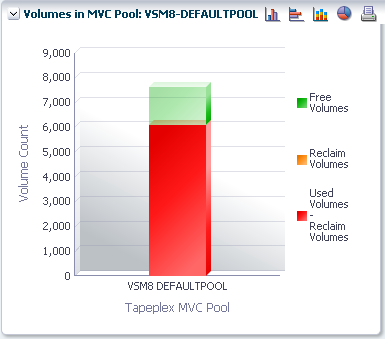
Hover on an object to display summary data for the object.
Hover on a label to highlight related objects on the graph.
Click a graph icon to change the graph display type.
Click the icons above the graph to perform the following operations:
| Icon | Name | Description |
|---|---|---|
| Vertical bar graph | Display the graph as a vertical bar chart | |
| Horizontal bar graph | Display the graph as a horizontal bar chart | |
| Stacked bar graph | Display the graph as a stacked bar chart | |
| Pie chart | Display the graph as a pie chart | |
| Display as a printable page | ||
| Refresh | Refresh with data from the VSM GUI database | |
| Help | Display VSM GUI Help | |
| Run ELS | Refresh data by running the necessary ELS commands to update all of the database tables that are referenced on the page | |
| Close All Tabs | Close all tabs and display just the Dashboard |
Sizes in MVC Pool
This graph shows the size of MVCs in the selected MVC Pool, sorted by current usage state.
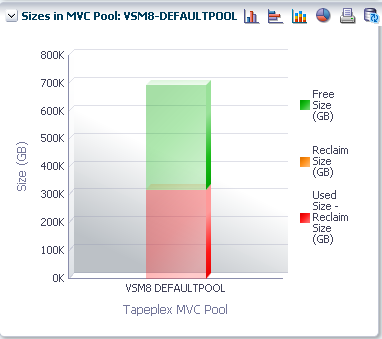
Hover on an object to display summary data for the object.
Hover on a label to highlight related objects on the graph.
Click an object to filter the data table by that object.
Click the icons above the graph to perform the following operations:
| Icon | Name | Description |
|---|---|---|
| Vertical bar graph | Display the graph as a vertical bar chart | |
| Horizontal bar graph | Display the graph as a horizontal bar chart | |
| Stacked bar graph | Display the graph as a stacked bar chart | |
| Pie chart | Display the graph as a pie chart | |
| Display as a printable page | ||
| Refresh | Refresh with data from the VSM GUI database | |
| Help | Display VSM GUI Help | |
| Run ELS | Refresh data by running the necessary ELS commands to update all of the database tables that are referenced on the page | |
| Close All Tabs | Close all tabs and display just the Dashboard |