Display VTSS
This pane displays Virtual Tape Storage Subsystem (VTSS) information.
To display, select Display and VTSS on the navigation tree.
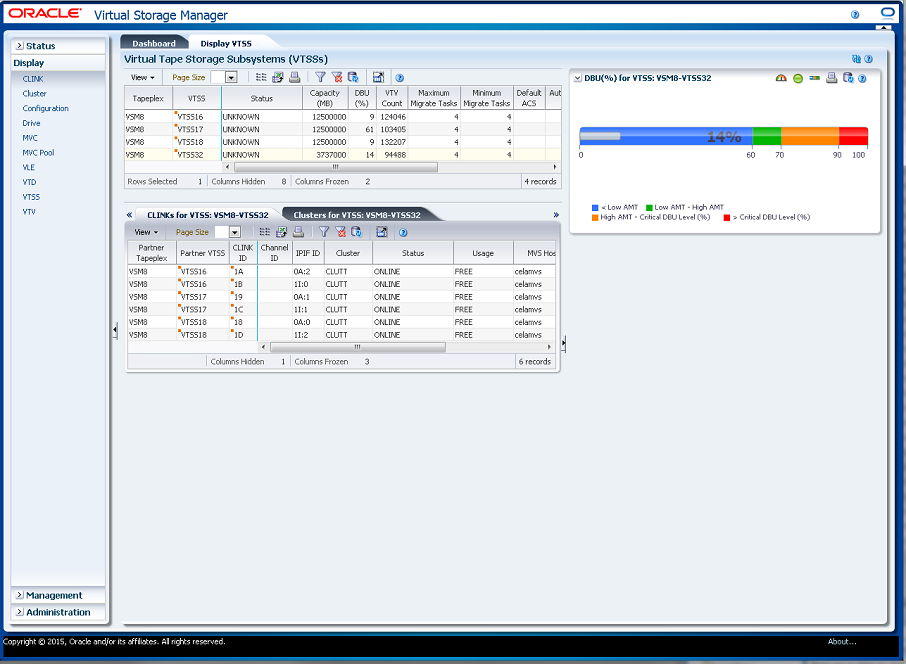
Virtual Tape Storage Subsystem (VTSS)
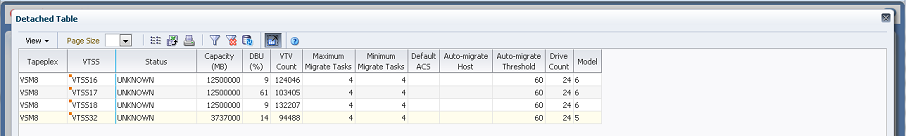
This data table shows VTSS information.
You may need to scroll horizontally or detach the table to view all columns.
Click the arrows in any column header to sort the data table by that column in ascending or descending order.
Fields with a context menu indicator can initiate Management commands on specific data items. Right click a field to display the context menu and select the desired menu item.
You can also filter data for individual data columns to further isolate specific information. See "Using Filters" for information about this feature.
Table columns and descriptions include:
| Column | Description |
|---|---|
| Tapeplex | The tapeplex the VTSS belongs to. |
| VTSS | The name of the VTSS.
Context menu: Audit VTSS, Vary VTSS. |
| Status | One of the following global VTSS states for all hosts:
QUIESCING: Quiescing state. QUIESCED: Quiesced state. OFFLINE: Offline state. OFFLINE-P: Offline pending state. ONLINE: Online state. ONLINE-P: Online pending state. STARTED: The VTSS is initialized and in process of going to the requested state (online, offline, or quiesced). |
| Capacity (MB) | The capacity of the VTSS in megabytes. |
| DBU Percentage | The percentage of disk buffer used of the total disk buffer capacity. |
| High AMT | The high auto-migrate threshold. |
| Low AMT | The low auto-migrate threshold. |
| VTV Count | The number of VTVs resident in the VTSS. |
| Maximum Migrate Tasks | The maximum number of auto-migrate tasks for the VTSS. |
| Minimum Migrate Tasks | The minimum number of auto-migrate tasks for the VTSS. |
| Default ACS | The configured default ACS ID for the VTSS. |
| Auto-Host | The host system performing the auto-migration. |
| Auto-migrate Threshold | The current auto-migration threshold for the VTSS. |
| RTD Count | The number of RTDs attached to the VTSS. |
| Model | The VTSS model (VSM2, VSM3, VSM4, VSM5, VSM 6, or unknown). |
| Maximum VTV Size (MB) | The maximum size of VTVs in megabytes. |
| VTV Page Size | The VTV page size, either Standard or Large. |
| RTC Data Verify | Indicates if RTC data is verified. |
| Connectivity | The Connectivity type, either CHANNEL or ECAM-T protocol. |
| Serial Number | The serial number of the VTSS. |
| Refreshed | The date and UTC time the data was stored or last updated. |
Click a row in the data table to display, for that VTSS, the following data tables:
Columns Hidden indicates the number of columns in the table that are not being displayed. These are displayed using the View menu.
Columns Frozen is the number of left-hand columns that remain static when the horizontal scroll bar is moved. A blue vertical line separates these columns from the others.
Use the View menu to perform the following operations:
| View Option | Description |
|---|---|
| Scroll Table | Enable or disable scrolling |
| Columns | Show all or selected columns and manage hidden/visible status |
| Detach | Display the table in a separate window |
| Sort | Sort the column in ascending or descending order |
| Reorder Columns | Select the column sequence for Visible columns |
Use the Page Size menu to specify the number of rows to include on a data table page.
If there are multiple pages, use the Page feature at the bottom of the table to navigate among them. Enter or select a page number or use the arrow buttons to move forward or backward in the list of pages.
Click the icons above the table to perform the following operations:
| Icon | Name | Description |
|---|---|---|
| Selected Row Data | Show data for selected rows | |
| Export to Excel | Export all rows to an Excel spreadsheet | |
| Display as a printable page | ||
| Filter | See "Using Filters" | |
| Reset Filter | Reset the data filter | |
| Refresh | Refresh with data from the VSM GUI database | |
| Detach | Display in a separate window | |
| Help | Display VSM GUI Help | |
| Run ELS | Refresh data by running the necessary ELS commands to update all of the database tables that are referenced on the page | |
| Close All Tabs | Close all tabs and display just the Dashboard |
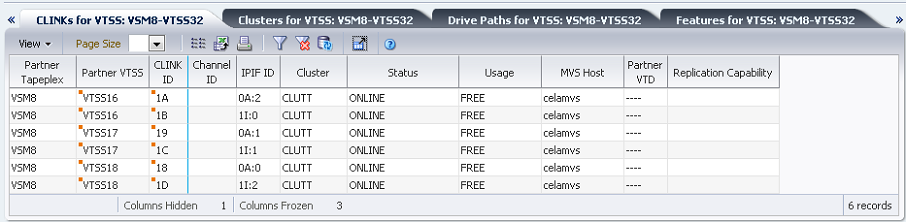
CLINKs for VTSS
This data table displays a list of all CLINKs for the VTSS that was selected in the Virtual Tape Storage Subsystem (VTSS) data table.
If the table is not visible, click the arrows left or right of the displayed tabs and select the table.
You may need to scroll horizontally or detach the table to view all columns.
Click the arrows in any column header to sort the data table by that column in ascending or descending order.
Fields with a context menu indicator can initiate Management commands on specific data items. Right click a field to display the context menu and select the desired menu item.
You can also filter data for individual data columns to further isolate specific information. See "Using Filters" for information about this feature.
Table columns and descriptions include:
| Column | Description |
|---|---|
| Partner Tapeplex | The partner tapeplex in the cluster. |
| Partner VTSS | The secondary or receiving VTSS in the cluster. |
| CLINK ID | The CLINK ID that has been assigned to the CLINK within the VTSS |
| Channel ID | The back-end channel interface to which the CLINK is connected. |
| IPIF ID | The IPIF ID of the CLINK |
| Cluster | The cluster name if the CLINK is used for replication of VTVs within the tapeplex and is part of a cluster. The VTSS name in the Partner VTSS column indicates the other VTSS that operates in the cluster. |
| Status | One of the following:
Maint: The link has failed or it has been varied into maintenance mode. Offline: The link is offline and unavailable to all hosts and VTSSs. ONLINE: The link is online and available to all hosts and VTSSs. ON-SYNC: Available for synchronous replication. ON-ASYNC: Available for asynchronous replication. P_OFFLINE: The link is pending offline. P_ONLINE: The link is pending online. RECOVERY: The link is being reset following an error or a vary online operation. UNUSABLE: Not available for replication due to hardware errors or assigned-elsewhere conditions. UUI ERR: This is a CLINK defined for electronic export and it has been unable to contact the remote VTCS. There should be messages in the HSC JOBLOG that indicate the reason for the problem. This could include problems with the definitions, the local SMC, or the remote HTTP server on the remote VTCS. |
| Usage | One of the following:
ASSIGNED: Link is assigned to the host in the HOST field but is not currently replicating. This usage occurs when VTCS is starting or terminating link use or is attempting error recovery on the link after a replication failure. FREE: Link is idle (not doing replications). REPLICATING: Link is actively doing replications. |
| MVS Host | The host that the link is assigned to |
| Partner VTD | The address of the VTD on the partner VTSS that forms the other end point to the connection. For a cluster link, the MVS address of the VTD is reported. For an electronic export link, this is not possible as there is no access to the other tapeplex configuration. In this case, only the ordinal number of the VTV is reported. |
| Replication Capability | Indicates the CLINK is available for synchronous or asynchronous replication. |
| Refreshed | The date and UTC time the data was stored or last updated. |
Columns Hidden indicates the number of columns in the table that are not being displayed. These are displayed using the View menu.
Columns Frozen is the number of left-hand columns that remain static when the horizontal scroll bar is moved. A blue vertical line separates these columns from the others.
Use the View menu to perform the following operations:
| View Option | Description |
|---|---|
| Scroll Table | Enable or disable scrolling |
| Columns | Show all or selected columns and manage hidden/visible status |
| Detach | Display the table in a separate window |
| Sort | Sort the column in ascending or descending order |
| Reorder Columns | Select the column sequence for Visible columns |
Use the Page Size menu to specify the number of rows to include on a data table page.
If there are multiple pages, use the Page feature at the bottom of the table to navigate among them. Enter or select a page number or use the arrow buttons to move forward or backward in the list of pages.
Click the icons above the table to perform the following operations:
| Icon | Name | Description |
|---|---|---|
| Selected Row Data | Show data for selected rows | |
| Export to Excel | Export all rows to an Excel spreadsheet | |
| Display as a printable page | ||
| Filter | See "Using Filters" | |
| Reset Filter | Reset the data filter | |
| Refresh | Refresh with data from the VSM GUI database | |
| Detach | Display in a separate window | |
| Help | Display VSM GUI Help | |
| Run ELS | Refresh data by running the necessary ELS commands to update all of the database tables that are referenced on the page | |
| Close All Tabs | Close all tabs and display just the Dashboard |
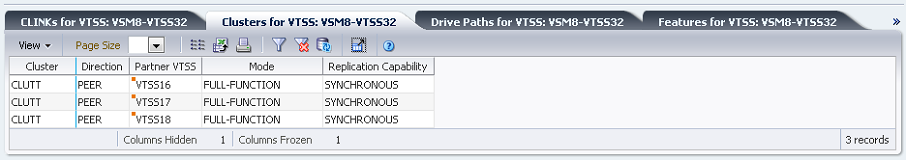
Clusters for VTSS
This data table displays a list of all Clusters for the VTSS that was selected in the "Virtual Tape Storage Subsystem (VTSS)" data table.
If the table is not visible, click the arrows left or right of the displayed tabs and select the table.
You may need to scroll horizontally or detach the table to view all columns.
Click the arrows in any column header to sort the data table by that column in ascending or descending order.
Fields with a context menu indicator can initiate Management commands on specific data items. Right click a field to display the context menu and select the desired menu item.
You can also filter data for individual data columns to further isolate specific information. See "Using Filters" for information about this feature.
Table columns and descriptions include:
| Column | Description |
|---|---|
| Cluster | The cluster name. |
| Direction | The direction of the link between the VTSSs, one of the following:
-----> or <----- indicates the direction of VTV replication in Uni-Directional Cluster. VTVs can only be replicated from the Sending to the Receiving VTSS. <----> indicates that the VTSSs are configured as a Bi-Directional (Peer-to-Peer) Cluster. VTVs can be replicated from either VTSS to the other. |
| Partner VTSS | The partner VTSS in the cluster. |
| Mode | One of the following cluster operating modes:
ASYNC-REPLICATE: Both VTSSs in the cluster are online to VTCS. Production workload can go to either VTSS, but for a unidirectional (primary/secondary) cluster, VTVs can only be replicated from the sending VTSS. Synchronous replication is not enabled across the cluster. SYNC-REPLICATE: Both VTSSs in the cluster are online to VTCS. Production workload can go to either VTSS, but for a unidirectional (primary/secondary) cluster, VTVs can only be replicated from the sending VTSS. Synchronous replication is enabled across the cluster. DEGRADED: One of the two VTSSs in a bidirectional peer-to-peer cluster is either offline or quiesced. Production workload can go the remaining online VTSS. VTVs requiring replication, however, are allocated to the remaining VTSS only if no other full-function clusters are available and suitable. In this case, replicate VTVs are migrated immediately with keep and queued for replication when the other VTSS comes online. When the other VTSS comes online, VTCS reconciles the contents of both VTSSs. DEGRADED SECONDARY: The primary is online to VTCS and the secondary is either offline or quiesced. Workload can run on the primary. VTVs requiring replication, however, are allocated to the primary only if no other full-function clusters are available. In this case, replicate VTVs are migrated immediately with keep and are queued for replication, which occurs when the secondary comes online. DEGRADED PRIMARY: The secondary is online to VTCS and the primary is either offline or quiesced. Workload can run on the secondary. VTVs requiring replication, however, are allocated to the secondary only if no other full-function clusters are available. When the primary comes back online, VTCS reconciles the contents of the primary and secondary. NON-OPERATIONAL: No workload is possible on this cluster. CLINKS OFFLINE: All defined CLINKs are offline. No workload is possible on this Cluster. ONLY SECONDARY: The Secondary is online to VTCS and the Primary has no CLINKs online. Workload can run on the Secondary. VTVs requiring replication, however, are allocated to the Secondary only if no other Full Function Clusters are available. ONLY PRIMARY: The Primary is online to VTCS and the Secondary has no CLINKs online. Workload can run on the Primary. VTVs requiring replication, however, are allocated to the Primary only if no other Full Function Clusters are available. In this case, Replicate VTVs are migrated immediately with keep and are queued for replication. |
| Replication Capability | Indicates the cluster is available for synchronous or asynchronous replication. |
| Refreshed | The date and UTC time the data was stored or last updated. |
Columns Hidden indicates the number of columns in the table that are not being displayed. These are displayed using the View menu.
Columns Frozen is the number of left-hand columns that remain static when the horizontal scroll bar is moved. A blue vertical line separates these columns from the others.
Use the View menu to perform the following operations:
| View Option | Description |
|---|---|
| Scroll Table | Enable or disable scrolling |
| Columns | Show all or selected columns and manage hidden/visible status |
| Detach | Display the table in a separate window |
| Sort | Sort the column in ascending or descending order |
| Reorder Columns | Select the column sequence for Visible columns |
Use the Page Size menu to specify the number of rows to include on a data table page.
If there are multiple pages, use the Page feature at the bottom of the table to navigate among them. Enter or select a page number or use the arrow buttons to move forward or backward in the list of pages.
Click the icons above the table to perform the following operations:
| Icon | Name | Description |
|---|---|---|
| Selected Row Data | Show data for selected rows | |
| Export to Excel | Export all rows to an Excel spreadsheet | |
| Display as a printable page | ||
| Filter | See "Using Filters" | |
| Reset Filter | Reset the data filter | |
| Refresh | Refresh with data from the VSM GUI database | |
| Detach | Display in a separate window | |
| Help | Display VSM GUI Help | |
| Run ELS | Refresh data by running the necessary ELS commands to update all of the database tables that are referenced on the page | |
| Close All Tabs | Close all tabs and display just the Dashboard |
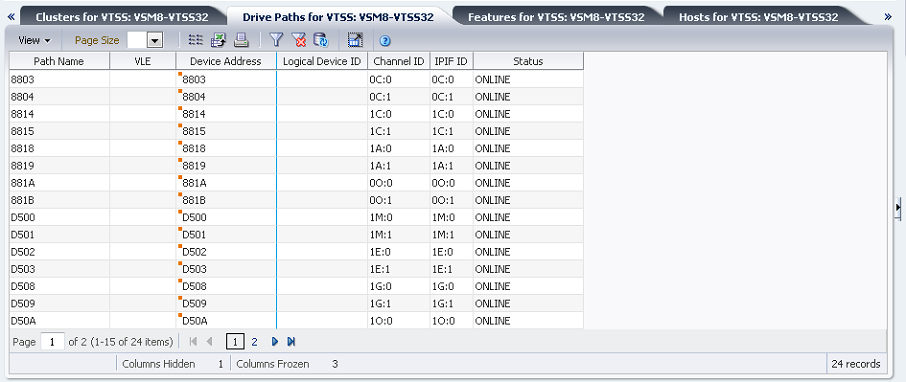
Drive Paths for VTSS
This data table displays a list of all drive paths for the VTSS that was selected in the "Virtual Tape Storage Subsystem (VTSS)" data table.
If the table is not visible, click the arrows left or right of the displayed tabs and select the table.
You may need to scroll horizontally or detach the table to view all columns.
Click the arrows in any column header to sort the data table by that column in ascending or descending order.
Fields with a context menu indicator can initiate Management commands on specific data items. Right click a field to display the context menu and select the desired menu item.
You can also filter data for individual data columns to further isolate specific information. See "Using Filters" for information about this feature.
Table columns and descriptions include:
| Column | Description |
|---|---|
| Path Name | The name allocated to the path. |
| VLE | The VLE name. |
| Device Address | The device address for the drive. |
| Logical Device ID | The logical device ID assigned to the path. |
| Channel ID | The CHANIF value that was specified for the path. |
| IPIF ID | The IPIF value that was specified for the path. |
| Status | One of the following:
ONLINE: The path is online and available for use. ON-ASYNC: The path is online and available for use for asynchronous replication of VTVs. ON-SYNC: The path is online and available for use for synchronous replication of VTVs. OFFLINE: The path or the device to which it connects has been varied offline. MAINT: The path or the device to which it connects has been varied into an offline maintenance mode. This could be a result of repeated failures. |
| Refreshed | The date and UTC time the data was stored or last updated. |
Columns Hidden indicates the number of columns in the table that are not being displayed. These are displayed using the View menu.
Columns Frozen is the number of left-hand columns that remain static when the horizontal scroll bar is moved. A blue vertical line separates these columns from the others.
Use the View menu to perform the following operations:
| View Option | Description |
|---|---|
| Scroll Table | Enable or disable scrolling |
| Columns | Show all or selected columns and manage hidden/visible status |
| Detach | Display the table in a separate window |
| Sort | Sort the column in ascending or descending order |
| Reorder Columns | Select the column sequence for Visible columns |
Use the Page Size menu to specify the number of rows to include on a data table page.
If there are multiple pages, use the Page feature at the bottom of the table to navigate among them. Enter or select a page number or use the arrow buttons to move forward or backward in the list of pages.
Click the icons above the table to perform the following operations:
| Icon | Name | Description |
|---|---|---|
| Selected Row Data | Show data for selected rows | |
| Export to Excel | Export all rows to an Excel spreadsheet | |
| Display as a printable page | ||
| Filter | See "Using Filters" | |
| Reset Filter | Reset the data filter | |
| Refresh | Refresh with data from the VSM GUI database | |
| Detach | Display in a separate window | |
| Help | Display VSM GUI Help | |
| Run ELS | Refresh data by running the necessary ELS commands to update all of the database tables that are referenced on the page | |
| Close All Tabs | Close all tabs and display just the Dashboard |
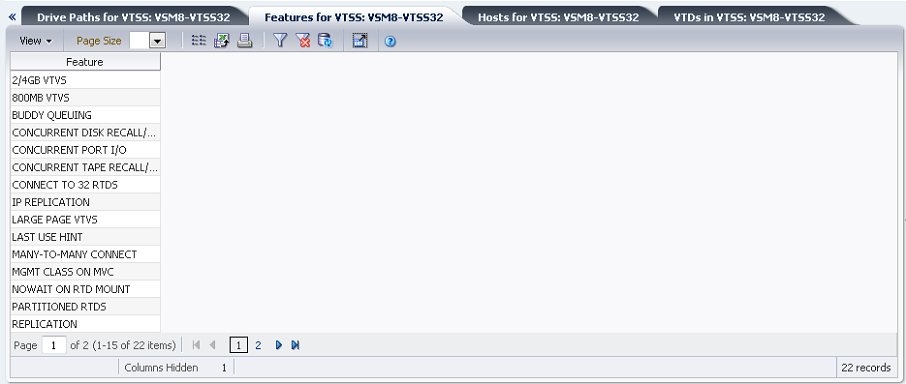
Features for VTSS
This data table displays a list of features for the VTSS that was selected in the "Virtual Tape Storage Subsystem (VTSS)" data table.
If the table is not visible, click the arrows left or right of the displayed tabs and select the table.
Click the arrows in any column header to sort the data table by that column in ascending or descending order.
You can also filter data for individual data columns to further isolate specific information. See "Using Filters" for information about this feature.
Table columns and descriptions include:
| Column | Description |
|---|---|
| Feature | The VTSS feature description. |
| Refreshed | The date and UTC time the data was stored or last updated. |
Columns Hidden indicates the number of columns in the table that are not being displayed. These are displayed using the View menu.
Columns Frozen is the number of left-hand columns that remain static when the horizontal scroll bar is moved. A blue vertical line separates these columns from the others.
Use the View menu to perform the following operations:
| View Option | Description |
|---|---|
| Scroll Table | Enable or disable scrolling |
| Columns | Show all or selected columns and manage hidden/visible status |
| Detach | Display the table in a separate window |
| Sort | Sort the column in ascending or descending order |
| Reorder Columns | Select the column sequence for Visible columns |
Use the Page Size menu to specify the number of rows to include on a data table page.
If there are multiple pages, use the Page feature at the bottom of the table to navigate among them. Enter or select a page number or use the arrow buttons to move forward or backward in the list of pages.
Click the icons above the table to perform the following operations:
| Icon | Name | Description |
|---|---|---|
| Selected Row Data | Show data for selected rows | |
| Export to Excel | Export all rows to an Excel spreadsheet | |
| Display as a printable page | ||
| Filter | See "Using Filters" | |
| Reset Filter | Reset the data filter | |
| Refresh | Refresh with data from the VSM GUI database | |
| Detach | Display in a separate window | |
| Help | Display VSM GUI Help | |
| Run ELS | Refresh data by running the necessary ELS commands to update all of the database tables that are referenced on the page | |
| Close All Tabs | Close all tabs and display just the Dashboard |
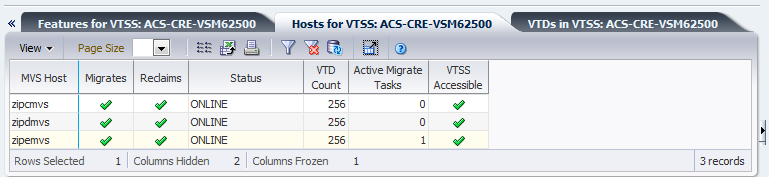
Hosts for VTSS
This data table displays a list of MVS hosts for the VTSS that was selected in the "Virtual Tape Storage Subsystem (VTSS)" data table.
If the table is not visible, click the arrows left or right of the displayed tabs and select the table.
You may need to scroll horizontally or detach the table to view all columns.
Click the arrows in any column header to sort the data table by that column in ascending or descending order.
You can also filter data for individual data columns to further isolate specific information. See "Using Filters" for information about this feature.
Table columns and descriptions include:
| Column | Description |
|---|---|
| MVS Host | The MVS host name. |
| Migrates | Indicates if the MVS host supports migrates on this VTSS. |
| Reclaims | Indicates if the MVS host supports reclaims on this VTSS. |
| Status | The VTSS status from the host: Online, Offline, or Quiesced. |
| VTD Count | The number of VTDs for the HOST-VTSS. |
| Active Migrate Tasks | The number of active migration tasks for the HOST-VTSS. |
| VTSS Accessible | Indicates if the VTSS is accessible from the host. |
| Immediate Migrate Wait Time (mins) | The migrate wait time fore the HOST-VTSS, in minutes. |
| Refreshed | The date and UTC time the data was stored or last updated. |
Columns Hidden indicates the number of columns in the table that are not being displayed. These are displayed using the View menu.
Columns Frozen is the number of left-hand columns that remain static when the horizontal scroll bar is moved. A blue vertical line separates these columns from the others.
Use the View menu to perform the following operations:
| View Option | Description |
|---|---|
| Scroll Table | Enable or disable scrolling |
| Columns | Show all or selected columns and manage hidden/visible status |
| Detach | Display the table in a separate window |
| Sort | Sort the column in ascending or descending order |
| Reorder Columns | Select the column sequence for Visible columns |
Use the Page Size menu to specify the number of rows to include on a data table page.
If there are multiple pages, use the Page feature at the bottom of the table to navigate among them. Enter or select a page number or use the arrow buttons to move forward or backward in the list of pages.
Click the icons above the table to perform the following operations:
| Icon | Name | Description |
|---|---|---|
| Selected Row Data | Show data for selected rows | |
| Export to Excel | Export all rows to an Excel spreadsheet | |
| Display as a printable page | ||
| Filter | See "Using Filters" | |
| Reset Filter | Reset the data filter | |
| Refresh | Refresh with data from the VSM GUI database | |
| Detach | Display in a separate window | |
| Help | Display VSM GUI Help | |
| Run ELS | Refresh data by running the necessary ELS commands to update all of the database tables that are referenced on the page | |
| Close All Tabs | Close all tabs and display just the Dashboard |
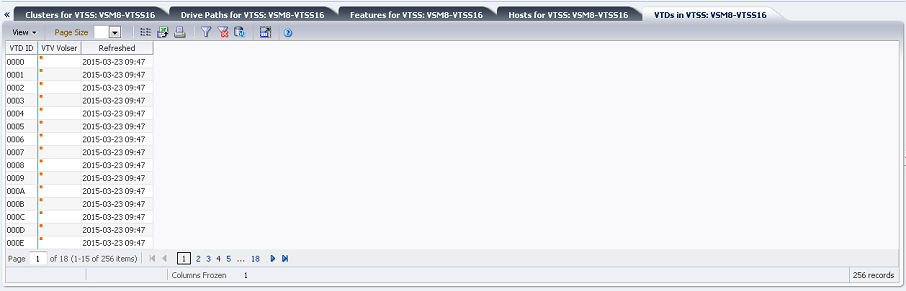
VTDs in VTSS
This data table displays a list of VTD IDs for the VTSS that was selected in the "Virtual Tape Storage Subsystem (VTSS)" data table.
If the table is not visible, click the arrows left or right of the displayed tabs and select the table.
You may need to scroll horizontally or detach the table to view all columns.
Click the arrows in any column header to sort the data table by that column in ascending or descending order.
Fields with a context menu indicator can initiate Management commands on specific data items. Right click a field to display the context menu and select the desired menu item.
You can also filter data for individual data columns to further isolate specific information. See "Using Filters" for information about this feature.
Table columns and descriptions include:
| Column | Description |
|---|---|
| VTD ID | The VTD ID. |
| VTV Volser | The Volser of the VTV on the VTD |
| Refreshed | The date and UTC time the data was stored or last updated. |
Columns Hidden indicates the number of columns in the table that are not being displayed. These are displayed using the View menu.
Columns Frozen is the number of left-hand columns that remain static when the horizontal scroll bar is moved. A blue vertical line separates these columns from the others.
Use the View menu to perform the following operations:
| View Option | Description |
|---|---|
| Scroll Table | Enable or disable scrolling |
| Columns | Show all or selected columns and manage hidden/visible status |
| Detach | Display the table in a separate window |
| Sort | Sort the column in ascending or descending order |
| Reorder Columns | Select the column sequence for Visible columns |
Use the Page Size menu to specify the number of rows to include on a data table page.
If there are multiple pages, use the Page feature at the bottom of the table to navigate among them. Enter or select a page number or use the arrow buttons to move forward or backward in the list of pages.
Click the icons above the table to perform the following operations:
| Icon | Name | Description |
|---|---|---|
| Selected Row Data | Show data for selected rows | |
| Export to Excel | Export all rows to an Excel spreadsheet | |
| Display as a printable page | ||
| Filter | See "Using Filters" | |
| Reset Filter | Reset the data filter | |
| Refresh | Refresh with data from the VSM GUI database | |
| Detach | Display in a separate window | |
| Help | Display VSM GUI Help | |
| Run ELS | Refresh data by running the necessary ELS commands to update all of the database tables that are referenced on the page | |
| Close All Tabs | Close all tabs and display just the Dashboard |
DBU Percentage for VTSS
This graph shows the disk buffer utilization (DBU) used percentage for the selected VTSS, with color coding in the background indicating the low and high auto-migration threshold (AMT) percentage settings and also the Critical DBU threshold percentage setting.
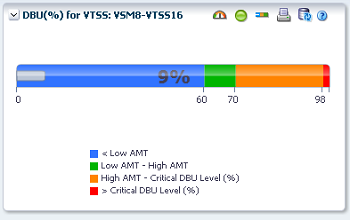
Hover on an object to display summary data for the object.
Click the icons above the graph to perform the following operations:
| Icon | Name | Description |
|---|---|---|
| Dial gauge | Display the gauge as a dial | |
| LED gauge | Display the gauge as an LED | |
| Meter gauge | Display the gauge as a status meter | |
| Display as a printable page | ||
| Refresh | Refresh with data from the VSM GUI database | |
| Help | Display VSM GUI Help | |
| Run ELS | Refresh data by running the necessary ELS commands to update all of the database tables that are referenced on the page | |
| Close All Tabs | Close all tabs and display just the Dashboard |