Display VTD
This pane displays Virtual Tape Drive (VTD) information.
To display, select Display and VTD on the navigation tree.
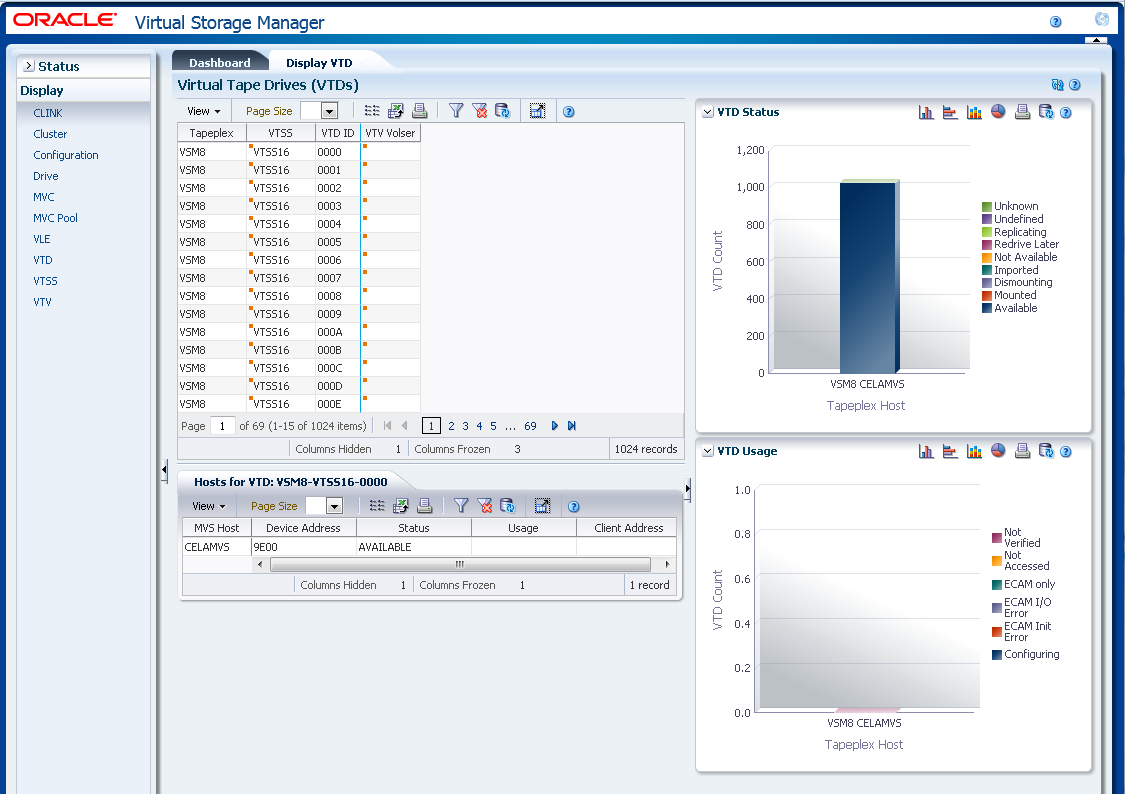
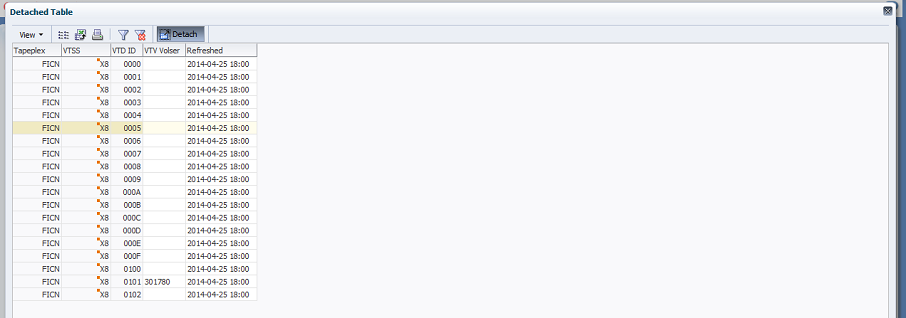
Virtual Tape Drives (VTDs)
This data table shows VTD information.
You may need to scroll horizontally or detach the table to view all columns.
Click the arrows in any column header to sort the data table by that column in ascending or descending order.
Fields with a context menu indicator can initiate Management commands on specific data items. Right click a field to display the context menu and select the desired menu item.
You can also filter data for individual data columns to further isolate specific information. See "Using Filters" for information about this feature.
Table columns and descriptions include:
| Column | Description |
|---|---|
| Tapeplex | The tapeplex the VTD is in. |
| VTSS | The VTSS the VTD is in.
Context menu: Audit VTSS, Vary VTSS. |
| VTD ID | The VTD ID. |
| VTV Volser | The volser of the VTD currently mounted on or allocated to the VTD. |
| Refreshed | The date and UTC time the data was stored or last updated. |
Columns Hidden indicates the number of columns in the table that are not being displayed. These are displayed using the View menu.
Columns Frozen is the number of left-hand columns that remain static when the horizontal scroll bar is moved. A blue vertical line separates these columns from the others.
Use the View menu to perform the following operations:
| View Option | Description |
|---|---|
| Scroll Table | Enable or disable scrolling |
| Columns | Show all or selected columns and manage hidden/visible status |
| Detach | Display the table in a separate window |
| Sort | Sort the column in ascending or descending order |
| Reorder Columns | Select the column sequence for Visible columns |
Use the Page Size menu to specify the number of rows to include on a data table page.
If there are multiple pages, use the Page feature at the bottom of the table to navigate among them. Enter or select a page number or use the arrow buttons to move forward or backward in the list of pages.
Click the icons above the table to perform the following operations:
| Icon | Name | Description |
|---|---|---|
| Selected Row Data | Show data for selected rows | |
| Export to Excel | Export all rows to an Excel spreadsheet | |
| Display as a printable page | ||
| Filter | See "Using Filters" | |
| Reset Filter | Reset the data filter | |
| Refresh | Refresh with data from the VSM GUI database | |
| Detach | Display in a separate window | |
| Help | Display VSM GUI Help | |
| Run ELS | Refresh data by running the necessary ELS commands to update all of the database tables that are referenced on the page | |
| Close All Tabs | Close all tabs and display just the Dashboard |
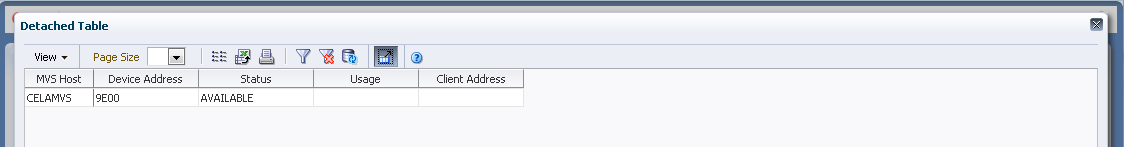
Hosts for VTD
This data table shows the selected VTD's host system, device address, status and usage.
You may need to scroll horizontally or detach the table to view all columns.
Click the arrows in any column header to sort the data table by that column in ascending or descending order.
Fields with a context menu indicator can initiate Management commands on specific data items. Right click a field to display the context menu and select the desired menu item.
You can also filter data for individual data columns to further isolate specific information. See "Using Filters" for information about this feature.
Table columns and descriptions include:
| Column | Description |
|---|---|
| MVS Host | The name of the MVS host that owns the DVD. |
| Device Address | The MVS device address of the VTD. If the device has not been defined to this host in the CONFIG, then this will contain physical address within the VTSS prefixed by '##'. |
| Status | One of the following:
Available: The VTD is available for work. Dismounting: The VTV volser shown in the VTV column is was mounted on the VTD and the VTD has been unloaded. VTCS either has not received the dismount request or is currently in the progress of synchronizing the VTV and CDS information. Imported: The VTV volser shown in the VTV column has been electronically imported with the VTD. It is awaiting the confirmation request from the host that performed the export. Importing: The VTV volser shown in the VTV column is being electronically imported with the VTD. Mounted: The VTV volser shown in the VTV column is mounted on the VTD. Mounting: The VTV volser shown in the VTV column is in the process of being mounted on the VTD. Typically, this indicates that an auto recall is in progress. Mount(other): The VTV volser shown in the VTV column is mounted on the VTD. The mount was not performed by the host on which the command was executed. Not Available: The VTD is not available for work. Redrive Later: A previous attempt to mount the VTV volser shown in the VTV column upon the VTD failed. It will be interpreted again within the next few minutes. Replicating: The VTV volser shown in the VTV column is in the process of being replicated. Undefined: The VTV volser shown in the VTV column is undefined. Unknown: The VTV volser shown in the VTV column is unknown. |
| Usage | One of the following:
Configuring: Configuration of the VTD is in progress. ECAM init error: Unable to initialise VTD through ECAM-t with VTSS. ECAM I/O error: ECAM-t I/O has failed on this VTD. ECAM only: The VTD is one of the VTDs connected to another VTSS for the process of replicating VTVs. Not accessed: The VTD is not found in the VTSS configuration. Not verified: The VTD is defined with NOVERIFY in the configuration. |
| Client Address | The address of the drive as reported by the client that last performed a mount on the VTD. |
Columns Hidden indicates the number of columns in the table that are not being displayed. These are displayed using the View menu.
Columns Frozen is the number of left-hand columns that remain static when the horizontal scroll bar is moved. A blue vertical line separates these columns from the others.
Use the View menu to perform the following operations:
| View Option | Description |
|---|---|
| Scroll Table | Enable or disable scrolling |
| Columns | Show all or selected columns and manage hidden/visible status |
| Detach | Display the table in a separate window |
| Sort | Sort the column in ascending or descending order |
| Reorder Columns | Select the column sequence for Visible columns |
Use the Page Size menu to specify the number of rows to include on a data table page.
If there are multiple pages, use the Page feature at the bottom of the table to navigate among them. Enter or select a page number or use the arrow buttons to move forward or backward in the list of pages.
Click the icons above the table to perform the following operations:
| Icon | Name | Description |
|---|---|---|
| Selected Row Data | Show data for selected rows | |
| Export to Excel | Export all rows to an Excel spreadsheet | |
| Display as a printable page | ||
| Filter | See "Using Filters" | |
| Reset Filter | Reset the data filter | |
| Refresh | Refresh with data from the VSM GUI database | |
| Detach | Display in a separate window | |
| Help | Display VSM GUI Help | |
| Run ELS | Refresh data by running the necessary ELS commands to update all of the database tables that are referenced on the page | |
| Close All Tabs | Close all tabs and display just the Dashboard |
VTD Status
This graph shows VTD status for the tapeplex and for the host. The graph is color-coded to indicate the number of VTDs that are unknown, unverified, replicating, redrive late, not available, imported, dismounting, mounted, and available.
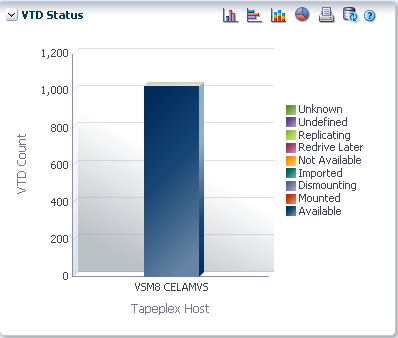
Hover on an object to display summary data for the object.
Hover on a label to highlight related objects on the graph.
Click an object to filter the data table by that object.
Click the icons above the graph to perform the following operations:
| Icon | Name | Description |
|---|---|---|
| Vertical bar graph | Display the graph as a vertical bar chart | |
| Horizontal bar graph | Display the graph as a horizontal bar chart | |
| Stacked bar graph | Display the graph as a stacked bar chart | |
| Pie chart | Display the graph as a pie chart | |
| Display as a printable page | ||
| Refresh | Refresh with data from the VSM GUI database | |
| Help | Display VSM GUI Help | |
| Run ELS | Refresh data by running the necessary ELS commands to update all of the database tables that are referenced on the page | |
| Close All Tabs | Close all tabs and display just the Dashboard |
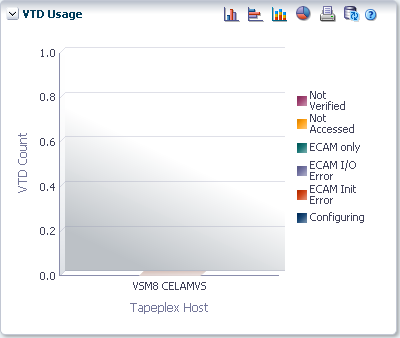
VTD Usage
This graph shows VTD usage for the tapeplex and for the host. The graph is color-coded to indicate the number of VTDs that are not verified, not accessed, ECAM only, ECAM I/O error, ECAM init error, and configuring.
Hover on an object to display summary data for the object.
Hover on a label to highlight related objects on the graph.
Click an object to filter the data table by that object.
Click the icons above the graph to perform the following operations:
| Icon | Name | Description |
|---|---|---|
| Vertical bar graph | Display the graph as a vertical bar chart | |
| Horizontal bar graph | Display the graph as a horizontal bar chart | |
| Stacked bar graph | Display the graph as a stacked bar chart | |
| Pie chart | Display the graph as a pie chart | |
| Display as a printable page | ||
| Refresh | Refresh with data from the VSM GUI database | |
| Help | Display VSM GUI Help | |
| Run ELS | Refresh data by running the necessary ELS commands to update all of the database tables that are referenced on the page | |
| Close All Tabs | Close all tabs and display just the Dashboard |