4.4 Custom Dashboards
You can track metrics, ratios, and trends on the console that are important to the business through custom dashboards. If a model has indicators, you can create custom dashboards to capture the data related to the indicators. As the milestones dashboards capture only data related to the milestones, a custom dashboard helps you to view indicator data along with the milestone data. You can visualize the indicators defined and extracted as the application runs.
You can add as many custom dashboards as you like. Each custom dashboard is represented by a title and an icon (chosen while creating the dashboard).
By default, the custom dashboards show data for instances created during the last five days. You can filter by a number of different criteria, including when an instance started or ended, how long the instance took to complete, and which milestones have most recently been passed.
Custom dashboards allow you to choose the indicators based on which you want to monitor the progress of a process.
To view data on Custom Dashboards:
Click the model for which you want to monitor the performance on the Consoles page.
Click My Custom Dashboards icon.
Expand the Filters area and select the required filters.
Click Apply to apply the filters or Clear All to clear all the selected filters.
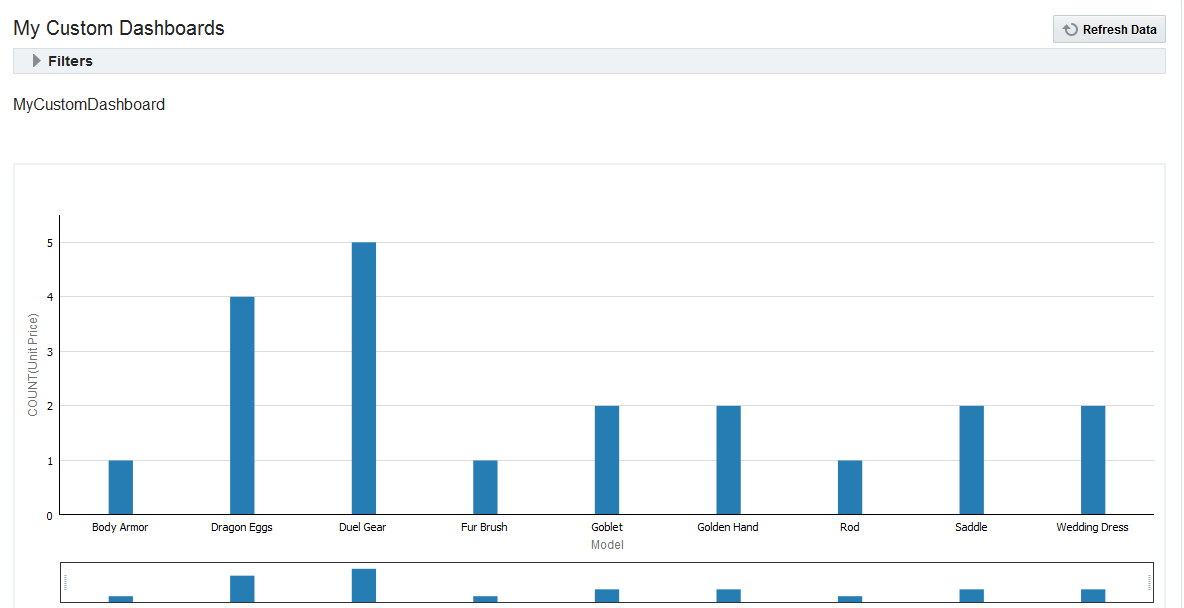
You can see the data visually in the form of a chart that was selected for the dashboard.
Click Refresh Data each time you change the filters to view the refreshed model data on the dashboard.
Figure 4-10 Custom Dashboard
You can drill across the dashboard to view specific instances. See Drilling Across Dashboards.