4.3 Milestone Dashboards
After a model is defined and activated, Insight collects metrics on running instances immediately. Within a few moments, you (a user with the role-permission of InsightExecutive) can evaluate the state of the integration application using the default dashboards. There are several major functional areas on the console.
The content of the console can be filtered using the Filters section. This area is collapsed by default. see Filtering Instances.
By default, the console shows activity for the last five days. You can filter by a number of different criteria, including when an instance started or ended, how long the instance took to complete, any milestones passed and which milestones have most recently been passed.
Insight provides default dashboards. The default dashboards are also known as Milestone Dashboards. Milestone dashboards on a console associated with a model give a business owner visibility into details on how a business is performing.
Note:
Only users with the role InsightModelCreator/InsightExecutive/InsightAdmin can view milestone dashboards.Viewing Dashboard
To view data on the milestone dashboards:
Click the model for which you want to see the dashboards (on the Consoles page).
Expand the Filters area and select the required filters. See Filtering Instances.
Click Apply to apply the filters or Clear All to clear all the selected filters.
Select the Format of the data to be displayed. This is applicable only for the Milestone dashboard.
Table: displays the data in a tabular format. This format is applicable only to the Milestone Timings Dashboard.
Diagram: displays the data in a graphical format. This format is applicable to all the milestone dashboards (includes Milestone Timings Dashboard, Passed Milestones Dashboard, Active Instances Dashboard, Instance Errors Dashboard, Avg Instance Completion Time Dashboard).
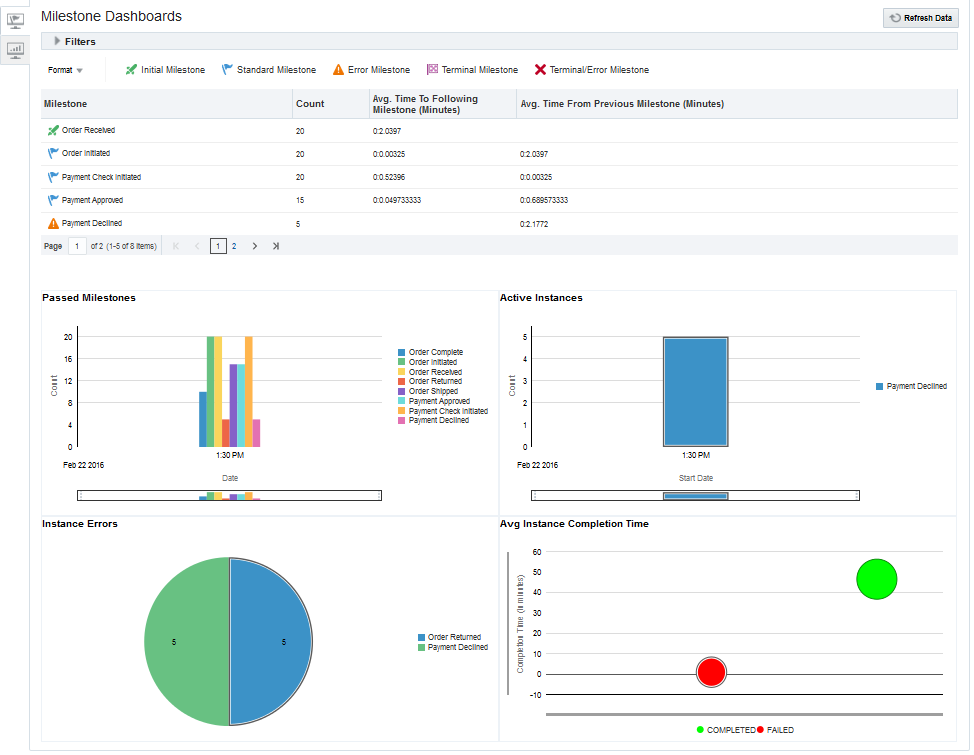
The dashboard displays the model data based on the milestones. The Milestone Timings Dashboard appears at the top, with the following four dashboards below it:
Passed Milestones — bar view of the count of milestones passed for a given date grouped by the start of each day. You can click any milestone color box or name in the legend to see those milestones on the dashboard. The boxes in the legend are toggle icons, which when clicked either show or hide that milestone on the dashboard. You can use Ctrl+mouse wheel on the dashboard to zoom in or out. To return to the normal view, wheel out or expand the selection area on the bar beneath the dashboard.
Active Instances — stacked bar view of the count of currently active instances by the date they were started and grouped by the start of each day. You can click any milestone color box or name in the legend to see those milestones on the dashboard. The boxes in the legend are toggle icons, which when clicked either show or hide that milestone on the dashboard. You can use Ctrl+mouse wheel on the dashboard to zoom in or out. To return to the normal view, wheel out or expand the selection area on the bar beneath the dashboard.
Instance Errors — pie view of the count of instances where the final milestone was defined to be an Error milestone. You can click any milestone color box or name in the legend to see those milestones (slices) on the dashboard. The boxes in the legend are toggle icons, which when clicked either show or hide that milestone on the dashboard. You can use Ctrl+mouse wheel on the dashboard to zoom in or out. To return to the normal view, wheel out or expand the selection area on the slice beneath the dashboard.
Avg Instance Completion Time — bubble view of the completed and failed instances. The completion time is on Y Axis. The average time an instance takes to complete and the number of instances in each category determine the bubble size. You can click the categories in the legend to either show or hide that data in the dashboard. You can also use the Marquee zoom tool to zoom in and out. To return to the normal view, wheel out or expand the selection area on the slice beneath the dashboard.
Click Refresh Data to see the latest data without changing the filters.
Figure 4-9 Milestone Dashboard
Hover over any of the dashboards to view details about the milestone and execution time. You can also drill across the milestones to view specific instances. See Drilling Across Dashboards.
Click Consoles to go back to the Dashboards page.
After you are done with viewing the dashboards, click View All at the top-right corner of the page to navigate to the Instance List page.