4.1 Console Overview
The Consoles page lists all the activated models.
You can mark any model as favorite. You can also sort the models either by Date or Name.
The Consoles page includes a high-level visualization of the metrics collected over the past day for an activated model. These metrics include the number of instances for the model that are:
Healthy
Recoverable Errors
Successful
Failed.
On the consoles list page, instances for the previous 24 hours are represented as bars at the end of each console's row. Active instances (Healthy and Recoverable) are stacked together as one bar and completed instances (Successful and Failed) are stacked as the other. Hover over the desired section of either bars to see the number of instances that bar represents. For detailed information about these instance states, refer to Instance States.
Note:
The active/inactive status and instance bars will always show the state at which the page was first loaded even if you use the browser's refresh button. You must navigate away from this page and come back to see the updated data..The Consoles page appears as follows:
Figure 4-1 Consoles Page
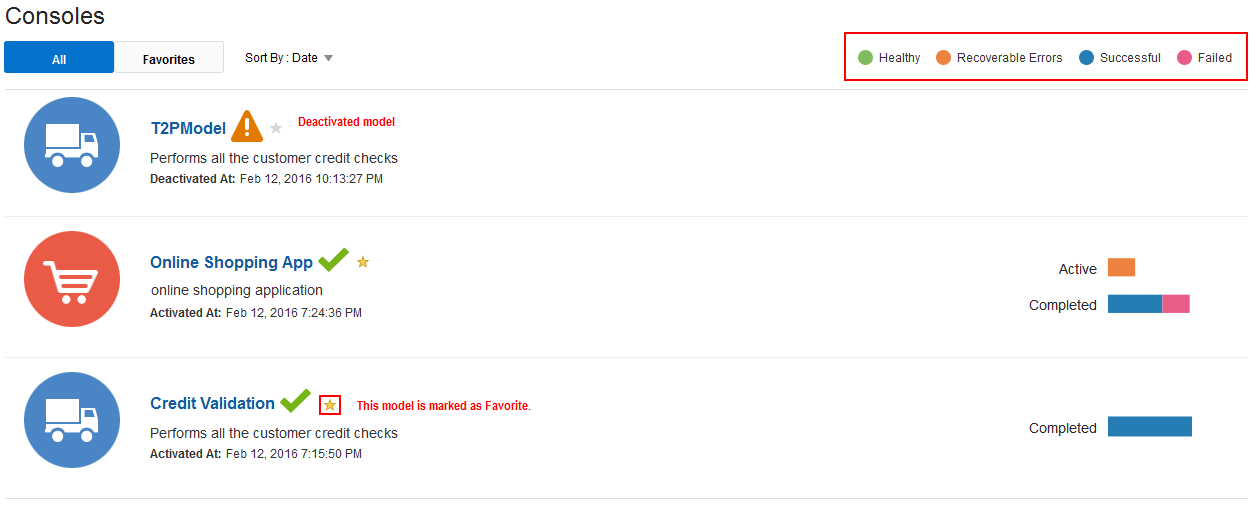
Click a model’s name to navigate to the Dashboards page of that model.