4.2 Understanding Dashboards
The main console shows information about the milestone performance of an integration application. For example, once the model of the application has been created and activated, business owners can identify bottlenecks in the application and track key metrics immediately and in real time.
The default dashboards are also known as Milestone Dashboards as they show metrics based on milestones defined in the model. These dashboards display the aggregate state of the business model based on milestones alone. To see the aggregate state of the model’s indicators, you need to create custom dashboards.
The status area is a collapsible section of the Dashboards page that always displays the last time the model changed to/from active/inactive state. This area also displays the search tool. You can see the model's icon, model description, and the descriptions for Single and Multiple Instances (that were defined while creating the model).
See also:
The Dashboards page for a model looks like the below screen.
Figure 4-2 Dashboards of the Model
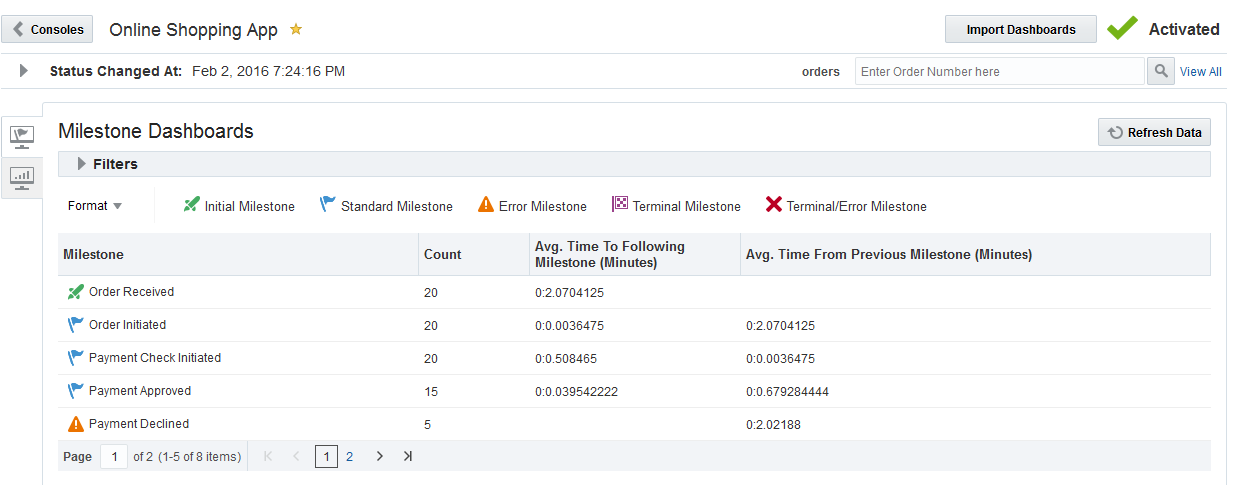
The Dashboards page has the following elements:
The Consoles button takes you back to the list of Consoles and updates the data on that page.
The title area contains the model name and a Favorites toggle icon. This icon lets you mark a model as favorite.
The Import Dashboards button allows you to import dashboards that were previously exported with this particular model. See Importing Dashboards.
The status indicator which indicates the status of the model
The timestamp at which the model’s status was last changed.
The icons Custom Dashboards and External Dashboards enable you to view the dashboards.