6 Monitoring Elastic Charging Engine
This chapter describes how to monitor Oracle Communications Elastic Charging Engine (ECE) targets using the home pages provided by Oracle Application Management Pack for Oracle Communications.
It also describes the ECE monitoring metrics provided by Oracle Application Management Pack for Oracle Communications.
About Monitoring ECE
Application Management Pack for Oracle Communications enables monitoring ECE targets using Oracle Enterprise Manager Cloud Control. You can monitor ECE node targets and ECE cluster targets.
You must install and configure the Application Management Pack for Oracle Communications plug-in before monitoring ECE. See the following chapters for information about setting up Oracle Communications application monitoring with Enterprise Manager Cloud Control:
-
Installing Application Management Pack for Oracle Communications
-
Managing Communications Applications with Enterprise Manager Cloud Control
About the Monitoring Home Page for ECE Targets
The home page for an ECE target displays metrics data that you can use to monitor the health of your ECE node and identify problems. See "Viewing Home Pages" for information about accessing target home pages. You can access the target's configuration topology from the home page as described in "Viewing Topology".
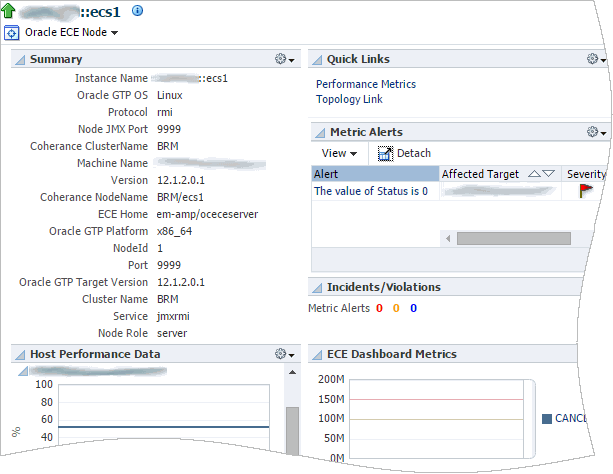
Figure 6-1 shows the regions on the home page for an ECE node target.
Table 6-1 describes the regions on the home page for ECE targets.
Table 6-1 Regions on the ECE Node Target Home Page
| Region | Description |
|---|---|
|
Summary |
Displays information about the ECE instance, including operating systems, ports, cluster names, version numbers, and more. |
|
Host Performance Data |
Displays performance information including CPU and memory usage. Use this region to identify performance problems for individual hosts. |
|
Quick Links |
Provides links to the topology viewer and to performance metrics for the ECE target. |
|
Metric Alerts |
Displays any metric alerts for the targets in the suite. Use this region to identify and resolve alerts. |
|
Incidents/Violations |
Displays the number of critical, warning, and escalated incidents and violations. Use this region to identify problems based on high numbers of incidents. |
|
ECE Dashboard Metrics |
Displays latency time for ECE operations. Use this region to identify operations that are taking too long or creating backlogs. |
The home pages for ECE cluster targets also include the ECE Oracle Coherence Installation region, which shows the status of all the Coherence targets in the cluster. The home pages for ECE cluster targets do not include the Incidents/Violations, Metric Alerts, or ECE Dashboard Metrics regions.
ECE Node Metrics
This section describes metrics collected for ECE client nodes.
See "About Conditions that Trigger Notifications" for an explanation of fields and tables included below.
Application Management Pack for Oracle Communications provides default thresholds for critical collection items and metrics. You can customize the thresholds and add thresholds and alerts for collection items and metrics that have no default thresholds. See "Configuring Metric Monitoring Thresholds and Alerts" for more information about configuring thresholds.
Metric: Response
All ECE targets have a Response Status collection item that provides target connection status. The Response Status is either up or down.
The Management Agent checks the Response Status at a default interval of every minute. Enterprise Manager Cloud Control administration console displays a message indicating whether the ECE node is either up or down. Table 6-2 describes the condition that triggers an alert.
Metric: Performance
This metric monitors event processing performance in ECE. Application Management Pack for Oracle Communications generates alerts when processing parameters exceed the warning and critical thresholds listed in Table 6-3.
Table 6-3 ECE Node Performance Condition
| Condition Column Name | Description | Operator | Default Warning Threshold | Default Critical Threshold | Consecutive Number of Occurrences Preceding Notification | Alert Text |
|---|---|---|---|---|---|---|
|
CANCEL_MAX_LATENCY |
The mean latency of an ECE cancel operation. |
GT |
100000000ns |
150000000ns |
0 |
CANCEL_MAX_LATENCY is %value% and has crossed warning (%warning_threshold%) or critical (%crticial_threshold%) threshold. |
|
INITIATE_MAX_LATENCY |
The maximum latency of an ECE initiation operation. |
GT |
50000000ns |
100000000ns |
0 |
INITIATE_MAX_LATENCY is %value% and has crossed warning (%warning_threshold%) or critical (%crticial_threshold%) threshold. |
|
TERMINATE_MAX_LATENCY |
The maximum latency of ECE termination operations. |
GT |
100000000ns |
150000000ns |
0 |
TERMINATE_MAX_LATENCY is %value% and has crossed warning (%warning_threshold%) or critical (%crticial_threshold%) threshold. |
|
UPDATE_MAX_LATENCY |
The maximum latency of an ECE update operation. |
GT |
100000000ns |
0150000000ns |
0 |
UPDATE_MAX_LATENCY is %value% and has crossed warning (%warning_threshold%) or critical (%crticial_threshold%) threshold. |
ECE Cluster Metrics
This section describes metrics collected for ECE clusters.
See "About Conditions that Trigger Notifications" for an explanation of fields and tables included below.
Application Management Pack for Oracle Communications provides default thresholds for critical collection items and metrics. You can customize the thresholds and add thresholds and alerts for collection items and metrics that have no default thresholds. See "Configuring Metric Monitoring Thresholds and Alerts" for more information about configuring thresholds.
Metric: Response
All ECE clusters have a Response Status collection item that provides target connection status. The Response Status is either up or down.
The Management Agent checks the Response Status at a default interval of every minute. Enterprise Manager Cloud Control administration console displays a message indicating whether the ECE node is either up or down. Table 6-4 describes the condition triggering an alert.
