| Oracle® Retail Demand Forecasting Cloud Service User Guide Release 19.0 F24922-17 |
|

 Previous |
 Next |
| Oracle® Retail Demand Forecasting Cloud Service User Guide Release 19.0 F24922-17 |
|
Previous |
Next |
The Dashboard is the workspace that is seen upon login. You can use the dashboard to quickly analyze the health of the business. The dashboard will need to be refreshed periodically as new products, locations, and demand-related data are added. This typically happens weekly, but depends on your administrator's settings. The measure data of existing products and locations in the dashboard can be refreshed at any time to view updated changes.
|
Note: For additional information about the user interface, dashboard, and workspaces, click Application Help from the Help icon on the dashboard. |
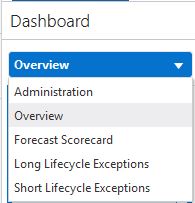
RDFCS has two dashboard profile types and includes two profiles for each type:
Metric profile type
Overview
Forecast Scorecard
Exception profile type
Long Lifecycle Exceptions
Short Lifecycle Exceptions
The information in the metric and exception profiles is summarized in tiles, which can be filtered on the product, location, or any other hierarchy that makes sense as shown in Figure 2-2 and Figure 2-3.
The information that is presented condensed in the tile metrics, is also presented in a chart with more detail.
In addition there is the Administration dashboard which gives information about scheduled OAT tasks, or workspace build information. More about the Administration dashboard can be found in the Oracle Retail Predictive Application Server Cloud Edition User Guide.
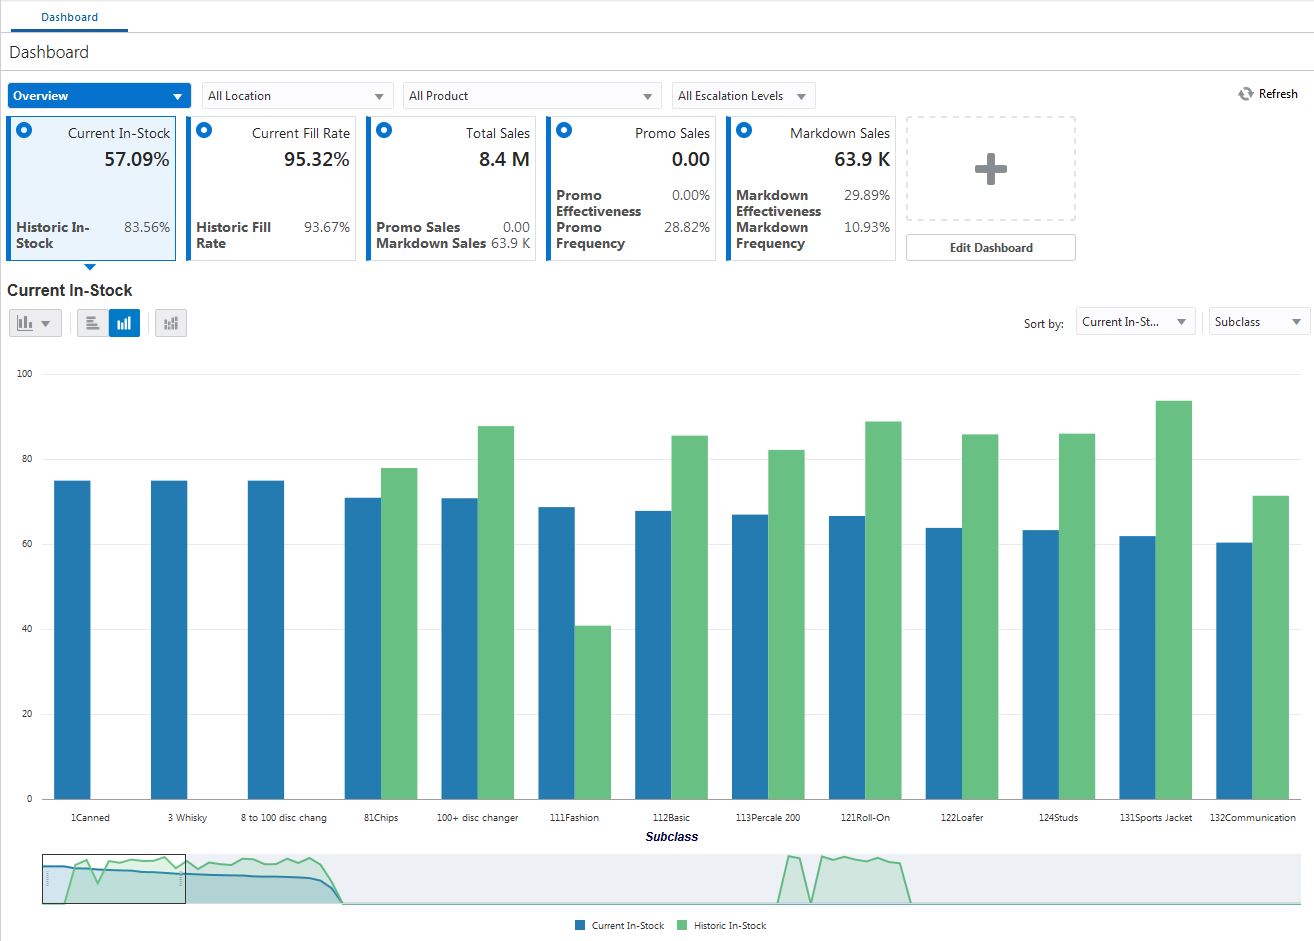
There are five GA tiles in the Overview dashboard.
|
Note: This view has a dual Y-axis and the scales of the Y-axes could be different from each other. |
Current and Historical In-stock Rates
The first tile displays information about how often stockouts occurred. If every four weeks, a stockout is registered, the in-stock rate would be 75%. This information is driven by how often stockouts occur. The tile displays current and historical fill rates.
Stockouts
The second tile displays information about the current and historical fill rates, which are related to service levels. This information is directly tied to the amount of lost sales caused by total or partial stockouts.
Breakdown of Sales
The third tile shows the breakdown of sales. The total sales are the sum of regular, promotional and markdown sales. The promotional and markdown sales are displayed as secondary metrics to gauge the amount of sales driven by these extraordinary events.
Promotional and Markdown Sales
The last two tiles display information about promotional and markdown sales. Besides the total units, additional information is displayed as secondary metrics. For instance, the tiles display how often the merchandise are promoted or marked down, as the promo or markdown frequency. Also, it shows the effectiveness of how promoting or marking down merchandise is increasing demand as compared to regular demand.
The information displayed in this dashboard helps the forecast analyst or forecast manager determine how accurate the forecasts are.
Error Metrics
These are the error metrics:
Mean Absolute Percentage Error
Root Mean Squared Error
Mean Absolute Error
Forecast Bias
Percent Adjusted
The error metrics are detailed in Appendix B, "Appendix: Forecast Errors in the Forecast Scorecard Dashboard." They are calculated for both the user-adjusted, as well as for the system-generated forecasts, allowing a fair evaluation of the performance of the analyst versus the system.
Forecast Bias
Another tile is dedicated to the forecast bias, a useful metric in determining if the forecast is consistently over or under the actual demand.
Percent Adjusted and Adjusted Volume
Finally, there is the Percent Adjusted tile, with the Adjusted Volume as the secondary metric. Here is displayed the percent of adjusted forecasts, and the volume resulted as the result of the adjustments. For instance, if the percent adjustment is high, but the adjusted volume is not significant, the analyst may want to spent time and effort on other areas of the merchandise.
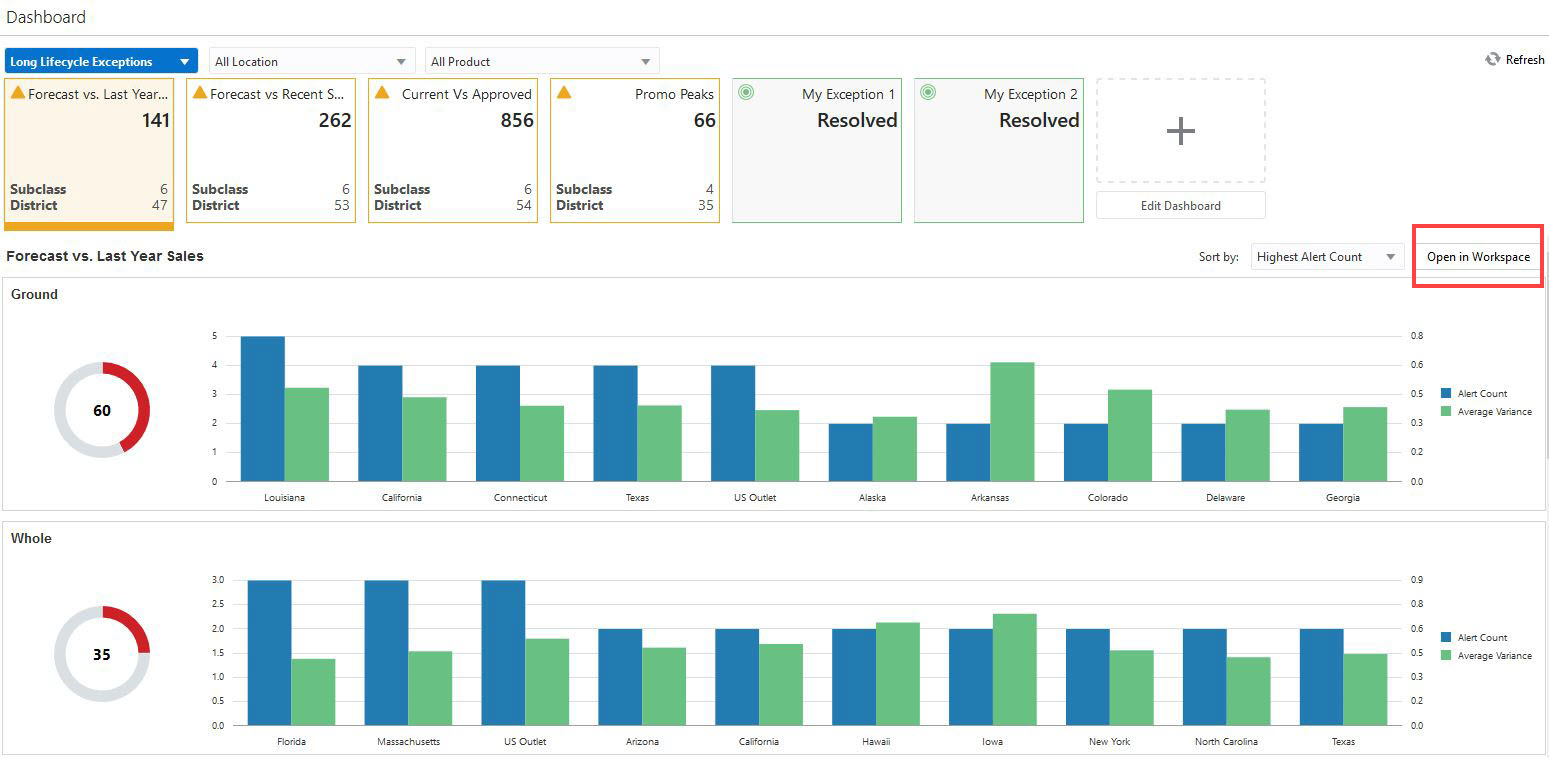
This is the first of the exception profile types available in RDFCS. It is relevant to merchandise that sells year over year, like hardlines, grocery items or basic fashion items.
Exceptions
The information displayed in the tiles is based on exceptions, or business rules defined to check if the forecasts are within bounds with respect to some thresholds. The exceptions definitions and expressions are detailed in Appendix A, "Appendix: Forecast Exceptions & Alerts."
Number of Hits Count
The main metric in the tiles is the number of hits count which is based on the product and location filter settings. If the filter settings range products and locations to a narrower selection than, All Product and All Location, then the number should be reflected in the tile; that is, it should decrease.
Number of Subclass and Districts
The secondary metric on the tiles display the number of subclass and districts that are affected. Note that the dimensions are configurable.
Charts
Each tile comes with a set of charts where the hit count information is broken down to lower levels and sorted based on hit count, or average variance.
|
Note: The average variance represents how much off the forecast is versus its target. For example we compare the forecast against last year sales. If the sales are 10 units and the forecast is 15 units, the variance is 5 units. The average variance is the average of all the differences between forecast and last year sales. |
The hit count represents how many times the forecast did not pass the configured business rules. The average variance represents by how much the forecasts were off. This is useful, because if a subclass is heavily alerted, but the forecasts only barely miss the threshold, the user may want to concentrate on other merchandise, potentially less alerted, but where the forecasts were off by a larger amount.
Forecast Review Workspace
Finally, when a user makes a decision as to which merchandise and locations to review, the user can launch directly in the Forecast Review workspace by clicking Open in Workspace, with the locations and product ranged down to the desired selection.
The Open in Workspace button is located in the right corner above the top chart.
|
Note: Alternatively, you can right-click on any exception chart and select Open in Workspace. |
Once in the workspace, the navigation is elegantly assisted by the workspace alerts.
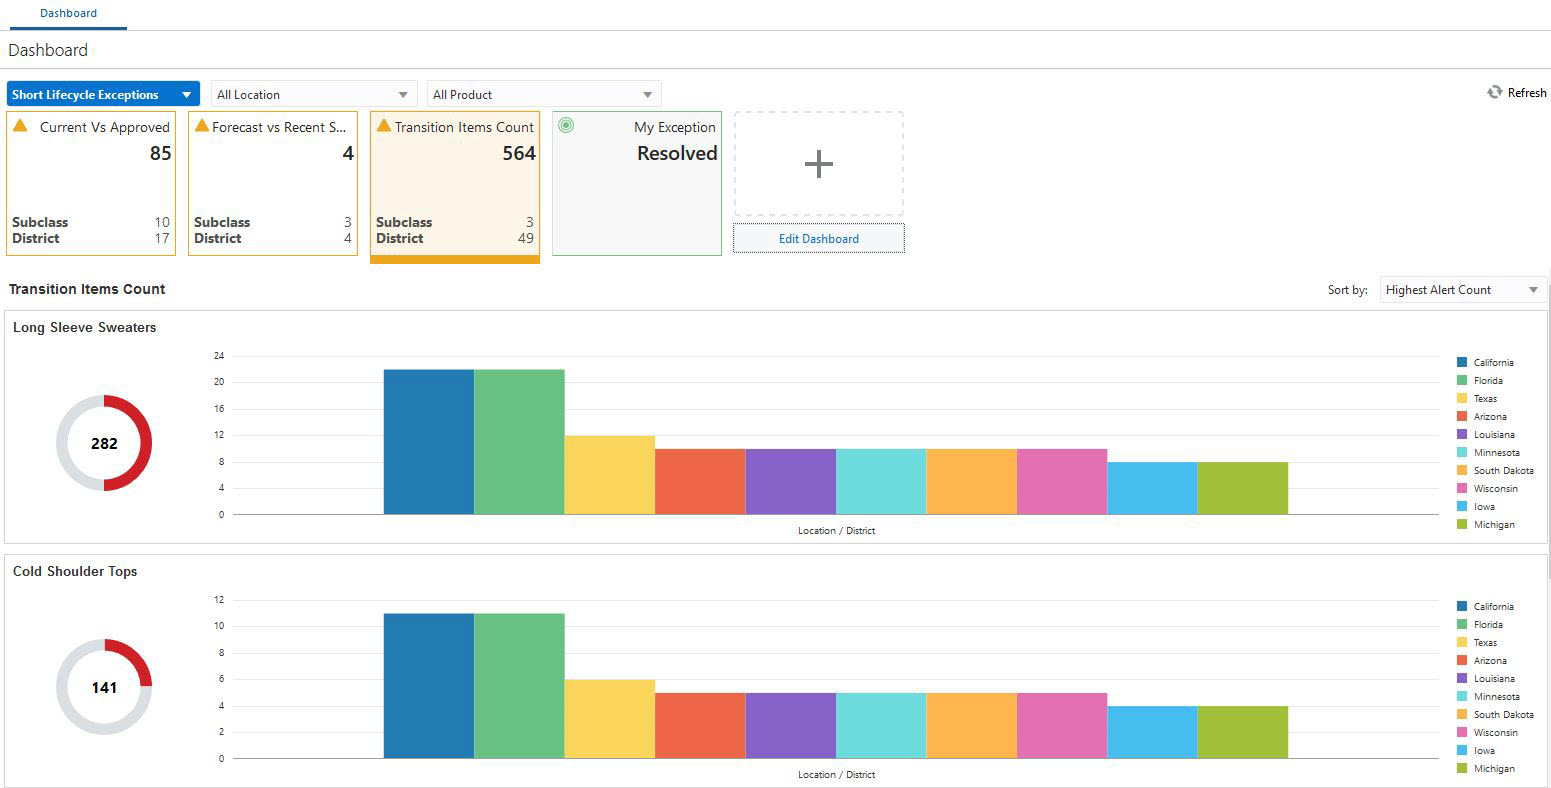
This is the second of the exception profile types available in RDFCS. It is relevant to merchandise that sell for a relatively short period of time and then never again. This type of merchandise can be divided in fashion items, and items that have replacements.
Exceptions
The information presented in this dashboard is conceptually the same as the information for long lifecycle items. The difference is the business rules that are setup for this type of merchandise. The exceptions definitions and expressions are detailed in Appendix A, "Appendix: Forecast Exceptions & Alerts."
Forecast Review Workspace
Almost every exception has a counterpart in the Forecast Review workspace, as workspace alerts. Once the user decides in the dashboard what merchandise to review, she launches in the workspace, and navigates using the workspace alerts. The only exception that is a bit different is the "Transition Items Count." This exception alerts the user on the number of pre-season items that will start selling in the next few periods, and hence have to be managed. There is no workspace alert counterpart, because the items do not actively sell, and a review is not needed. The alert is useful to let the user know of the additional workload coming up in the next few periods. This is also the reason why there is no Open in Workspace button associated with the Forecast Review workspace.