| Oracle® Retail Demand Forecasting Cloud Service User Guide Release 19.0 F24922-17 |
|

 Previous |
 Next |
| Oracle® Retail Demand Forecasting Cloud Service User Guide Release 19.0 F24922-17 |
|
Previous |
Next |
This chapter describes the Forecast Review Short Lifecycle for RDF Cloud Service.
The following table lists the workspaces, steps, and views for the Forecast Review SLC task.
The Forecast Review SLC workspace allows you access to all of the views listed in Forecast Review SLC Workspaces, Steps, and Views.
To build the Forecast Review SLC workspace, perform these steps:
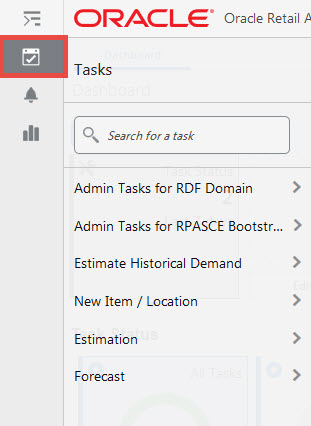
From the left sidebar menu, click the Task Module to view the available tasks.
Click the Forecast activity and then click Review to access the available workspaces.
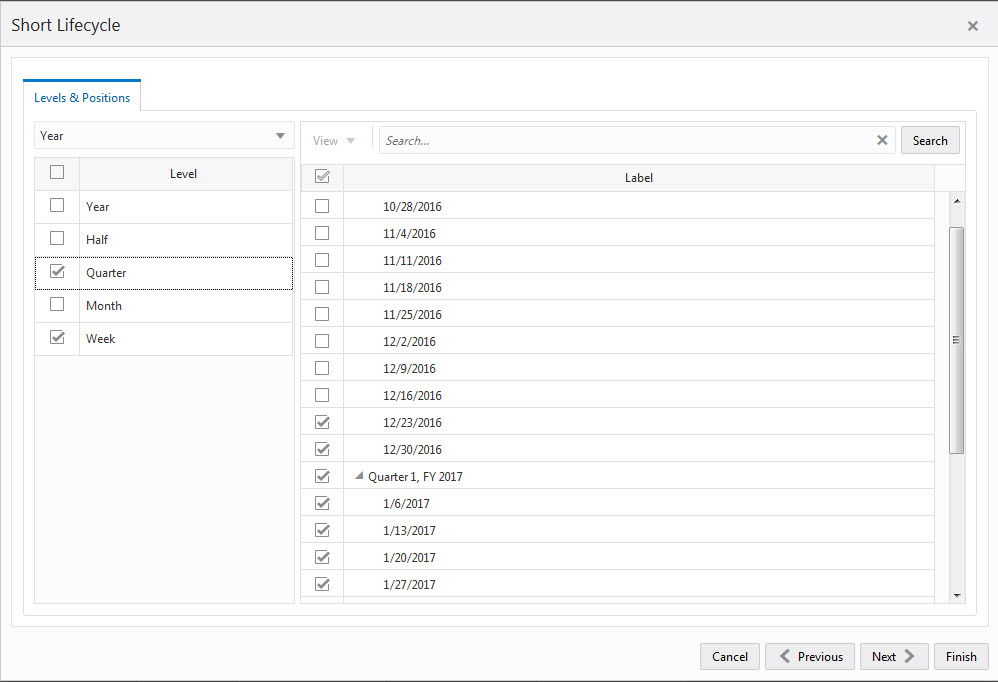
Click Short Lifecycle. The Short Lifecycle wizard opens.
You can open an existing workspace, but to create a new workspace, click Create New Workspace.
Enter a name for your new workspace in the label text box and click OK.
The Workspace wizard opens. Select the products you want to work with and click Next.
Select the locations you want to work with and click Next.
Select the time periods you want to work with and click Finish.
The wizard notifies you that your workspace is being prepared. Successful workspaces are available from the Dashboard.
The Forecast Review SLC workspace is built. This workspace contains these steps:
The available views are:
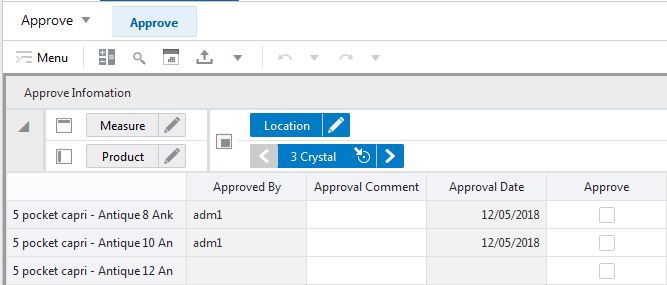
The Approve Information view shows information around the approval process, like which user approved the forecast, when the forecast was approved and potential notes.
The Approve Information view contains the following measures:
Approve By
Approved By is a read-only field that displays the name of the user to approve forecasts for an item/location. This field may be populated with Sys if the system was set to automatically approve forecasts during the batch forecast process.
Approval Comment
Approval Comment is a field in which notes may be entered regarding the forecast values or any pertinent information for specified product/location combinations.
Approval Date
Approval Date is a read-only field that displays the date that the forecast quantity is approved either automatically during the batch forecast process or when changes are made to the Adjusted Forecast. This information is necessary for RDF Cloud Service to carry out any subsequent processes, such as replenishment procedures.
Approve
This field may be checked if you want to accept the System Forecast quantity for a time series that has yet to be approved. The flag is also activated when a change is made to the Adjusted Forecast and Calculate occurs. When this flag is activated, the time series for an item/location are approved and both the Approval Date and Approved By fields are updated.
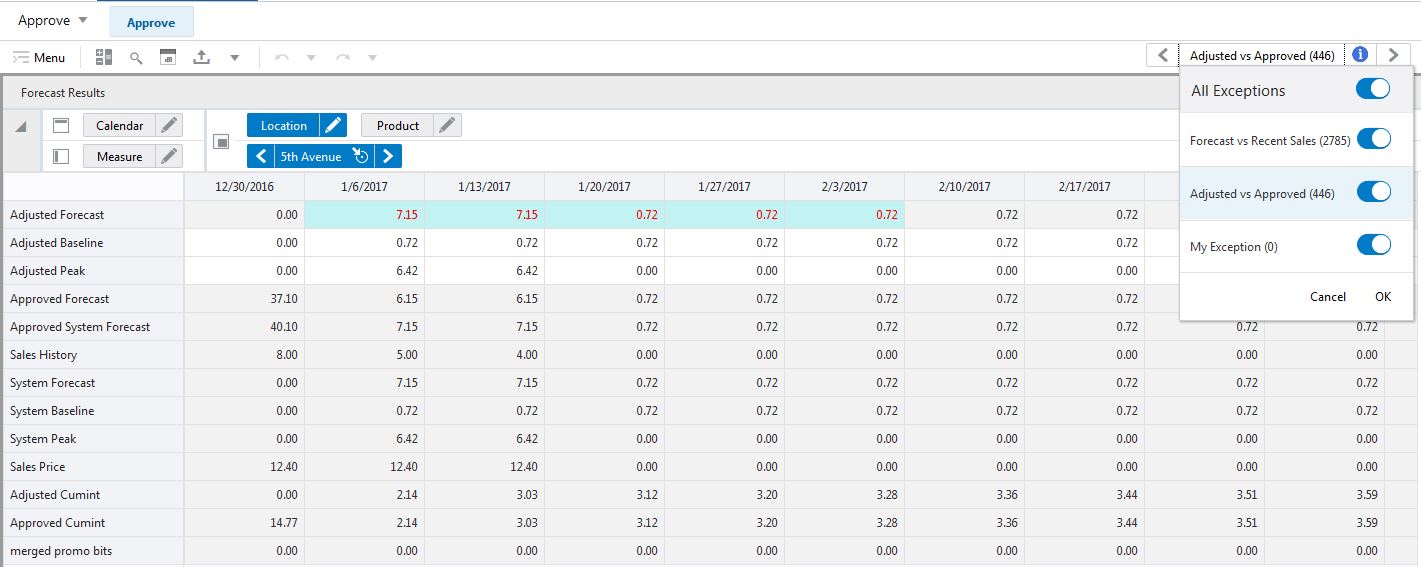
The Forecast Results view shows all information related to forecast generation. It shows the forecast with its components, baseline and promotional peaks. It also shows sales of last year, and cumulative interval information.
The navigation of this worksheet is very conveniently driven by real time, or workbook alerts.
|
Note: There is a duplicate of this view - Forecast Results Chart - that is intended to show the information in chart form.If not already in chart mode, you need to change the view type from pivot table to chart and save the format. This is a one time action. |
The Forecast Results view contains the following measures:
Adjusted Forecast
This is a read-only measures that equals the adjusted baseline plus the adjusted peaks.
Adjusted Baseline
The value in this field initially defaults to the System Baseline if the forecast is automatically approved by the system or through a Forecast Approval Alert. Otherwise, the value in the Adjusted Baseline is different than the System Baseline if:
Adjusted Baseline has been updated by you.
Keep Last Changes is selected.
Update Last Weeks Forecast is set to Replicate.
Changes to the Adjusted Baseline are automatically approved. The Approval view updates with the date of the adjustment and the name of the user who made the adjustment.
Adjusted Peak
The value in this field initially defaults to the System Peak if the forecast is automatically approved by the system or through a Forecast Approval Alert. Otherwise, the value in the Adjusted Peak is different than the System Peak if:
Adjusted Peak has been updated by you.
Keep Last Changes is selected.
Update Last Weeks Forecast is set to Replicate.
Changes to the Adjusted Peak are automatically approved. The Approval view updates with the date of the adjustment and the name of the user who made the adjustment.
Approved Forecast
The Approved Forecast is the forecast quantity that was approved at the time of the task build. The values contained in this measure are read-only. If changes are made to the Adjusted Forecast, then click Calculate to show the new value in the Approved Forecast.
Approved System Forecast
The Approved System Forecast is populated with the last System Forecast approved for a time series:
Approval Method set to Automatic Approval
Approval Method set to a Forecast Approval Alert and the alert is not triggered
Update Last Weeks Forecast is set to Use Forecast
Sales History
Sales History (a read-only measure) is the demand data used to generate the forecast. This allows you to compare Actuals to forecast values. When the task is created, the Data Source measure is copied into Sales History.
Sales Price
This is the price for which a product was sold at a given location for a given time period.
System Forecast
This is a read-only measures that equals the system baseline plus the system peaks.
System Baseline
The System Baseline displays the system generated baseline forecast. The values contained in this field are read-only. The system baseline incorporates level, trend, seasonality, but no causal-related information.
System Peak
The System Peak displays the causal-related peaks. The values contained in this field are read-only.
Adjusted Cumint
Cumulative Intervals are used in safety stock calculation within allocation and replenishment systems. Its value is similar to a running total of a percentage of the actual forecast and is read-only.
Approved Cumint
Cumulative Intervals are used in safety stock calculation within allocation and replenishment systems. Its value is similar to a running total of a percentage of the actual forecast and is read-only.
The What-If Parameters view allows you to adjust forecast parameters and immediately view the effects on the forecast in the Forecast Results view.
If you like the new adjusted forecast, you first have to Approve the forecast to get the forecast in the approved forecast measure. Next you have to Commit to update the database with the approved forecast as well as with the What-if forecast parameters settings. These parameters are used the next time the forecast batch is run.
Parameters that can be adjusted will affect base demand as well as seasonality.
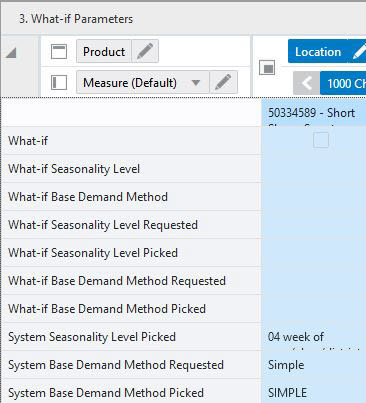
The What-If Parameters view contains the following measures:
What-if
This Boolean measures specifies if the user can perform What-if. If it is unchecked, no What-if is triggered. To perform What-if you need to select at least one of the following measures:
What-if Seasonality Level
What-if Base Demand Method
If the What-if flag is on, you can run it by clicking on the What-if custom menu
What-if Seasonality Level
This measure lets you specify a certain escalation level from which the seasonality curve will be used during What-if.
What-if Base Demand Method
This measure lets you override the forecast method for the base demand to be used during What-if. The choices are all the methods available for base demand in the forecast setup task.
What-if Seasonality Level Requested
This measure displays the requested seasonality level. This can be different from the What-if Seasonality Level Picked, because the requested level may be pruned. In this case escalation is performed to pick the next intersection.
What-if Seasonality Level Picked
This measure displays the picked seasonality level. This can be different from the What-if Seasonality Level Requested, because the requested level may be pruned. In this case escalation is performed to pick the next intersection.
What-if Base Demand Method Requested
This measure displays the requested base demand method. This can be different from the What-if Base Demand Method Picked. For instance, if the requested method is Auto Baseline Pick Best, the method picked will show the actual winner of the Auto Baseline competition.
What-if Base Demand Method Picked
This measure displays the picked base demand method. This can be different from the What-if Base Demand Method Requested. For instance, if the requested method is Auto Baseline Pick Best, the method picked will show the actual winner of the Auto Baseline competition, like Holt.
System Seasonality Level Picked
This measure displays the escalation level used in generating the system forecast.
System Base Demand Method Requested
This measure displays the requested base demand method to generate the system forecast. This can be different from the System Base Demand Method Picked. For instance, if the requested method is Auto Baseline Pick Best, the method picked will show the actual winner of the Auto Baseline competition.
System Base Demand Method Picked
This measure displays the picked base demand method when generating the system forecast. This can be different from the System Base Demand Method Requested. For instance, if the requested method is Auto Baseline Pick Best, the method picked will show the actual winner of the Auto Baseline competition, like Holt.
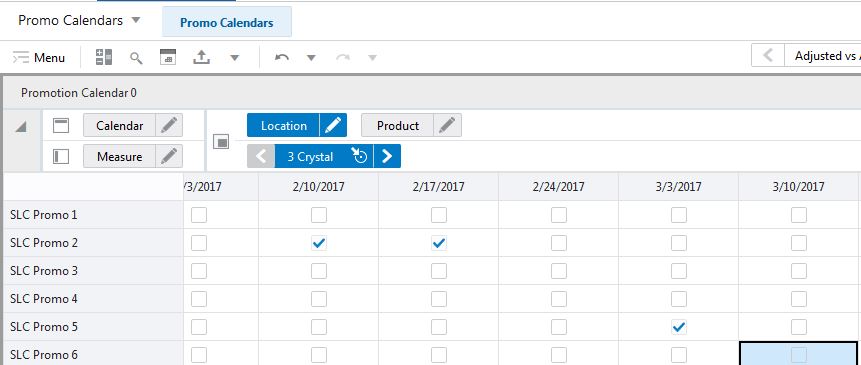
This step includes the Promotion Calendar View.
The Promotion Calendar view allows you to view the time periods when the merchandise is promoted. You can also modify the calendar by enabling and disabling certain periods, and the results are reflected in the Forecast Results view.
The Promotion Calendar view contains the following measures:
SLP1
Measure that displays if an event is active for a certain period at a given location and product.
SLP2
Measure that displays if an event is active for a certain period at a given location and product.