| Oracle® Retail Category Management User Guide for the RPAS Fusion Client Release 14.1.1 E62413-01 |
|

 Previous |
 Next |
| Oracle® Retail Category Management User Guide for the RPAS Fusion Client Release 14.1.1 E62413-01 |
|
Previous |
Next |
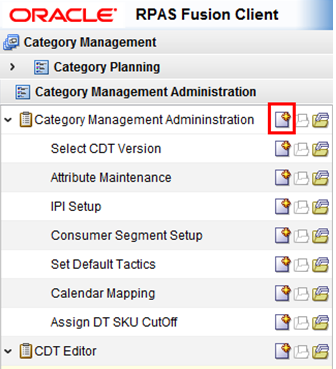
The Category Management Administration task is used to define the corporate guidelines and data required for assessment and optimization. It has steps and views that mirror the Category Management workflow. Each view requires the entry of corporate level data. As such, an administrator would manage and maintain this workbook.
All other administrative parameters are set in this Administration activity. For more information, see the Oracle Retail Predictive Application Server Administration Guide for the Fusion Client.
This task has the following steps:
To create the workbook:
Select the New Workbook icon in the Category Management Administration task.
The workbook is created.
This step has two views:
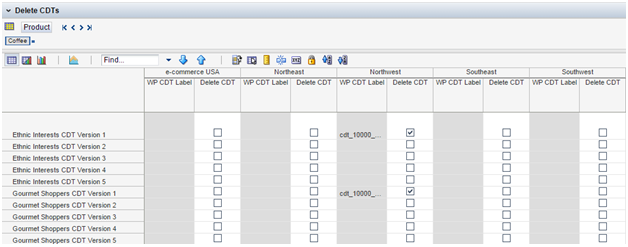
Use this view to delete CDTs. Five slots are available for each consumer segment to upload five versions of CDTs. This view facilitates the maintenance of appropriate CDTs for a consumer segment. It provides a feature to delete a CDT version to free up available slots. This, in effect, facilitates maintaining appropriate CDTs in the application per the business requirements.
Check the Boolean flag measure for the CDT versions that must be deleted in the view, commit the workbook, and run the batch script
$CM_HOME/bin/deleteCdts.ksh in the back-end. All CDTs marked for deletion will be purged by the script:
CDT measure deleted.
Dynamic Hierarchy Dimension measures for name and label for all levels of the CDT are deleted for the consumer segment, trading area, and category. This ensures that the deleted CDTs are not visible in the application in the Assortment Planning tasks.
CDT Editor will not show the CDT in the menu.
Table 3-1 lists the measures available in this view.
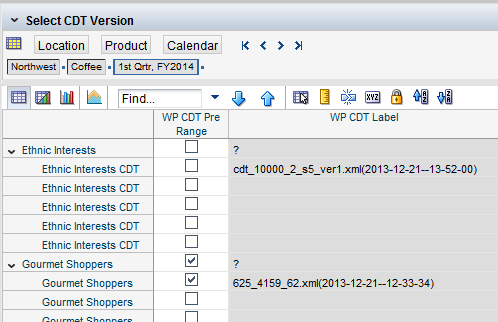
Use this view to select the CDT versions that are available in the workbook. A CDT version must be enabled here before it can be used elsewhere in the application. This action defines the pre-range mapping of CDTs, which governs their availability at the time of Assortment Planning workbook creation.
Table 3-2 lists the measures available in this view.
This step has three views:
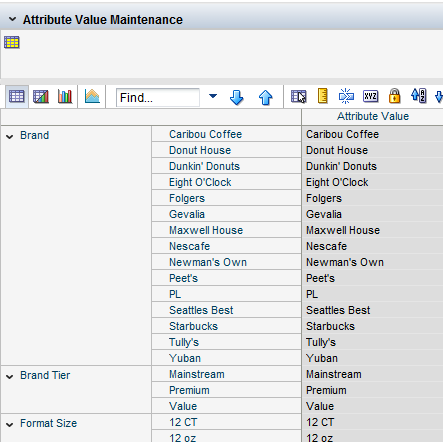
Product attributes in RCM are stored in the form of Attribute Names and Attribute Values. Attribute Values are a list of product attributes for a specific Attribute Name. Examples of attribute names are Brand, Brand Tier, Size, Flavor, and so on. The following is an example of attribute values:
The attribute name is Flavor and the product category in consideration is Fruit Juices.
The corresponding attribute values are Apple, Orange, Grape, Mixed Fruit, and so on.
Right-click on an Attribute Value position and use the Attribute Value Maintenance view to maintain product attribute values (attribute value) mapping to product attribute names (attribute name). Product attributes, in general, refer to both attribute names and attribute values.
The ground rule here is that the name and label of the attribute value should be similar. Except for underscore (_), the attribute value name cannot use any other special characters, unlike the attribute value label. The user should ensure that the naming method (nomenclature) of the attribute value name and attribute value label is similar. For example, if the attribute name equals Brand and attribute value label equals Dunkin' Donuts, the attribute value name should be Dunkin_Donuts.
Table 3-3 lists the measure available in this view.
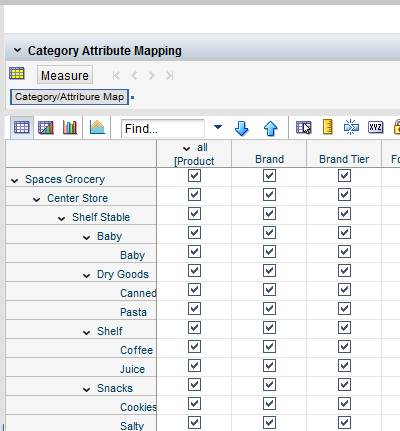
Use the Category Attribute Mapping view to maintain the mapping of attribute names to a product category. Depending on the settings done here, different attribute names and their respective attribute values are made available to different product categories for placeholder item creation and attribute values' modification. For example, an attribute name equal to Flavor may apply for the Juices product category, but may not apply for the Kitchen Utensils product category.
Table 3-4 lists the measure available in this view.
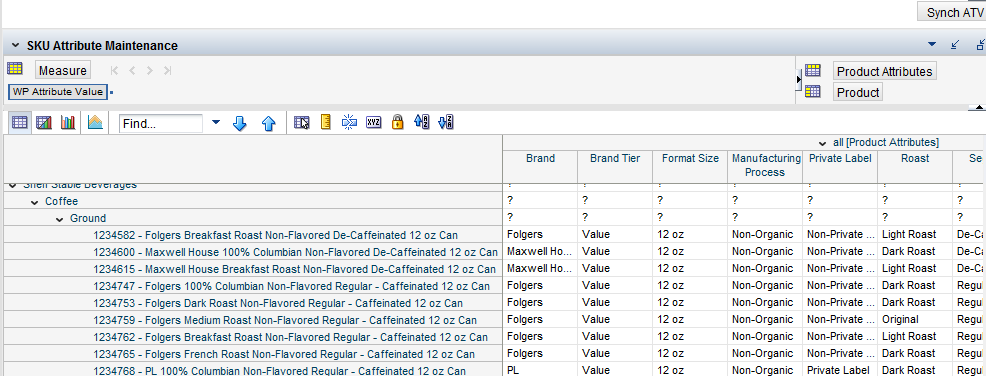
Use the SKU Attribute Maintenance view to maintain the attribute values mapping to a SKU or item. This view provides the facility to modify attribute value mappings for a SKU, if required. A master data management (MDM) system, such as RMS, has the system of record for product/SKU attributes information. Any changes done to attribute values of a SKU here need to be communicated to RMS.
Table 3-5 lists the measure available in this view.
Table 3-5 SKU Attribute Maintenance Measure
| Label | Definition |
|---|---|
|
WP Attribute Value |
The attribute value mapped to an attribute name defining a product feature or attribute as part of a working plan assortment. Attribute values map to attribute names and attribute names map to the product. For example, the Attribute Name equals Brand, Flavor, Size, and so on. The Attribute Values for Flavor equal Apple, Orange, Grape, Mixed Fruit, and so on. |
Committing the workbook allows the attribute changes made in this workbook to appear across different views in the rest of the application.
The weights set in the IPI Setup step are used to pre-populate the IPI weights that are used in the Assortment Planning @ Cluster task. They can then be overridden by the Assortment Planner to achieve category-specific objectives. These weights are pre-populated to match a retailer's specific assortment requirements. Weights used in IPI calculations are directly determined by the strategy assignment to a sub-category/category. Roles, strategies, and tactics assignments in Category Planning to categories and sub-categories determine the assignment of IPI weights. Weights can be set at the consumer segment, cluster, and sub-category level in the Assortment Planning @ Cluster task to generate customized IPI assortments.
This step contains five views:
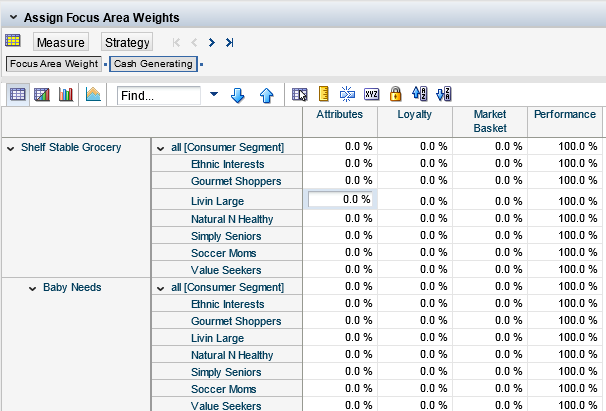
1. Assign Focus Area Weights View
3. Assign Attribute Name Weights View
4. Assign Attribute Value Weights View
5. Assign Consumer Segment Weights View
Focus areas represent the different perspectives of looking at a business to analyze, understand, evaluate, and manage it. Examples of focus areas include Attributes or Product attributes-focused analysis, Loyalty Analysis, Market Basket Analysis, Performance Analysis, and so on. Focus areas are used as levers to generate an assortment in which the required importance is given to different perspectives of looking at a business. Use the Assign Focus Area Weights view to set weights for focus areas, which are used in the SKU's/Item's IPI score calculations. These weights should add up to 100 percent in order to keep the IPI scores within a narrow range of values.
Table 3-6 lists the measure available in this view.
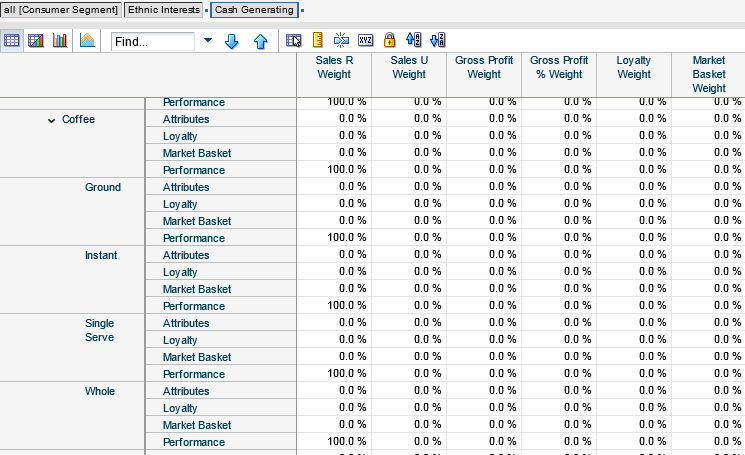
Metrics are used to define a focus area. Weights are assigned to different metrics according to the relative importance or emphasis that needs to be given to them. Use the Assign Metric Weights view to set the mix of weights for different retail metrics or measures to be used for a SKU's/Item's IPI score calculations. These weights should add up to 100 percent in order to keep the IPI scores within a narrow range of values.
Table 3-7 lists the measures available in this view.
Table 3-7 2. Assign Metric Weights Measures
| Label | Definition |
|---|---|
|
Sales R Weight |
The percentage of weight given to the sales retail metric for individual focus areas in IPI calculations for any category. |
|
Sales U Weight |
The percentage of weight given to the sales unit metric for individual focus areas in IPI calculations for any category. |
|
Gross Profit Weight |
The percentage of weight assigned to the gross profit retail metric for individual focus areas in the IPI calculation for any category. |
|
Gross Profit % Weight |
The percentage of weight given to the gross profit retail metric for individual focus areas in the IPI calculation for any category. |
|
Exclusivity Weight |
Administrator default value exclusivity weight value. The weight assigned to individual focus areas, keeping in mind their exclusivity. |
|
Loyalty Weight |
Administrator default value loyalty weight value. The weight assigned to individual focus areas based on the loyalty associated with them. |
|
Market Basket Weight |
The user-defined percentage weight assigned to the market basket focus area in IPI calculations and IPI assortment generation. It is used to emphasize the presence of an item in the market basket, or consumer's basket, in generating a system-recommended IPI assortment. |
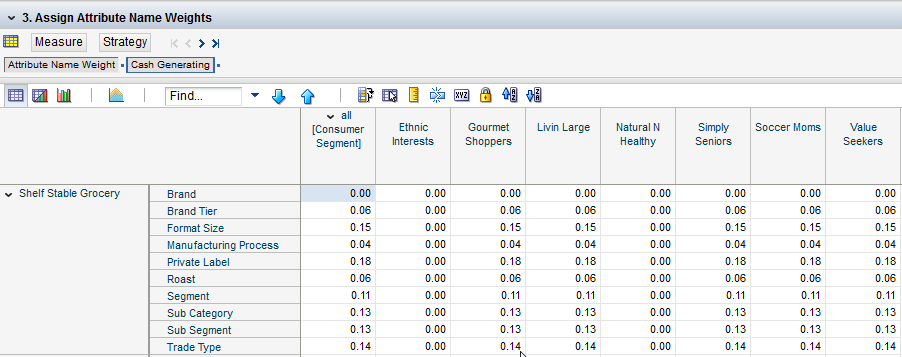
Attribute Name Weights must be defined when the assortment must have a specific product attributes mix. This provides a useful way to derive an assortment.
Use the Assign Attribute Name Weights view to set numeric weights that can be used to assign positive rational number ratios between different attribute names per the assortment-mix requirements. These weights directly influence the assortment mix on the basis of the relative weights emphasis to different attribute names. For example, if Attribute Name Weights are defined using high value rational numbers, the IPI scores generated by the system will have high value numbers. Similarly, if the Attribute Name Weights are assigned lower rational number values, the IPI scores will have a lower range of values.
|
Note: Attribute name weights, being numeric weights, can inflate the IPI scores if a high numeric value is set. The user should be cautious in assigning weights to them. |
Table 3-8 lists the measure available in this view.
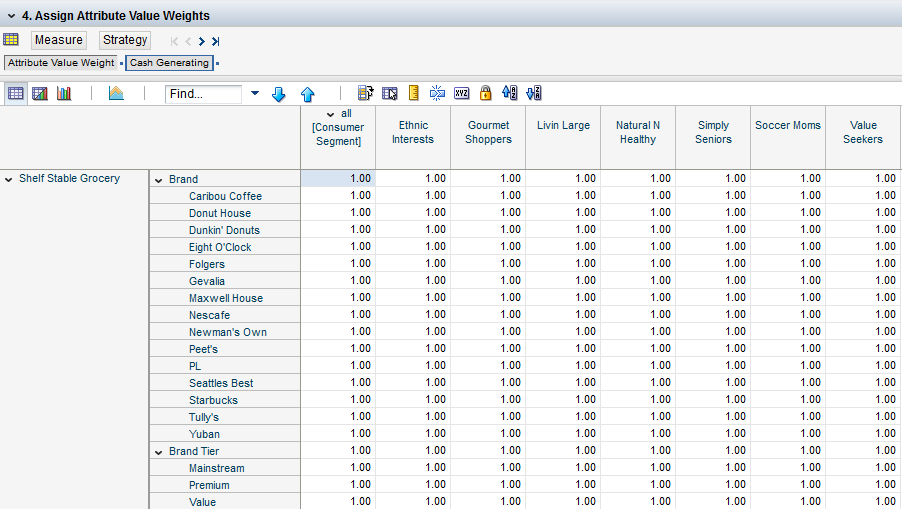
Use the Assign Attribute Value Weights view to set the numeric weights for the product's attribute values to be used in a SKU's/Item's IPI score calculations. Increasing or decreasing the value for an attribute value weight increases or decreases the IPI score for items with that attribute value. The average attribute value weight score should equal 1.00.
|
Note: Attribute value weights, being numeric weights, can inflate the IPI scores if a high numeric value is set. The user should be cautious in assigning weights to them. |
Table 3-9 lists the measure available in this view.
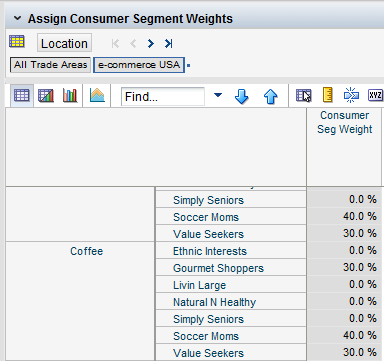
Use the Assign Consumer Segment Weights view to set weights for different consumer segments buying at the retailer in the market. These consumer segment weights are directly used in IPI score calculations and can be used to shape the assortment towards target consumer segments. These weights should add up to 100 percent in order to keep the IPI scores within a narrow range of values.
Table 3-10 lists the measure available in this view.
This step contains two views:
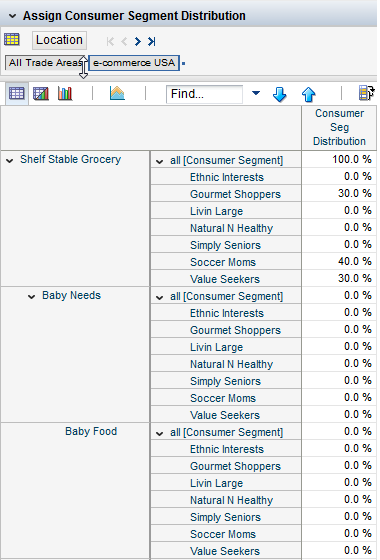
Use the Assign Consumer Segment Distribution view to see the contribution of individual consumer segments to the overall sales at the retailer for different product categories in the past. It is represented in the form of a consumer segment distribution.
Table 3-11 lists the measure available in this view.
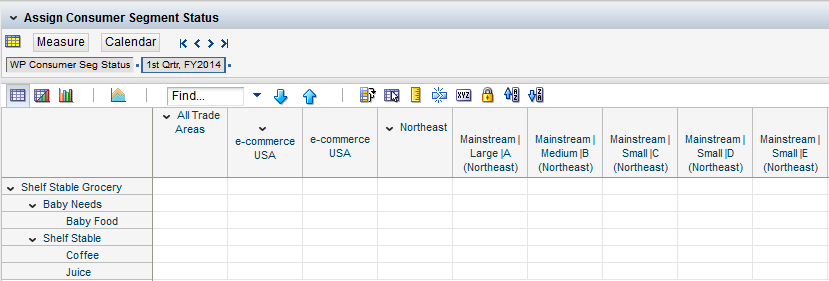
Use this view to assign primary consumer segments (or target consumer segments) to a category and store cluster. The strategies exported to ORASE are identified by using the primary consumer segments defined here. Note that only a few strategies are assigned at the consumer segment level.
When store clusters are updated with new imports from ORASE, the primary consumer segments should be updated in this view.
Table 3-12 lists the measure available in this view.
Table 3-12 Assign Consumer Segment Status Measure
| Label | Definition |
|---|---|
|
WP Consumer Seg Status |
Indicates the importance of a consumer segment to the retailer. It is used to identify the target consumer segments in a working plan assortment. It can have values such as primary, secondary, and so on. Note: Associates the consumer segment with the store cluster for the purpose of exporting the correct assigned status to ORASE. |
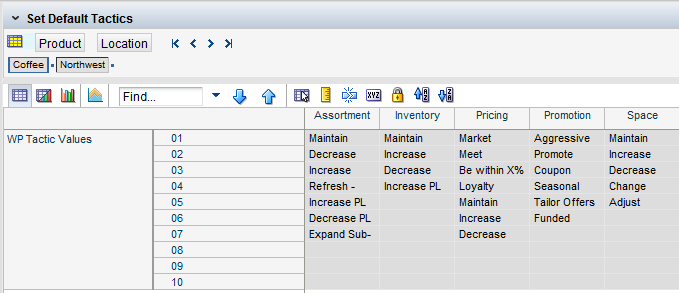
The Set Default Tactics step has two views:
Use these views to assign tactics for each tactical area:
Assortment
Inventory
Pricing
Promotion
Space
Entries made in this table are used to populate many of the drop-down lists that are used in Category Planning.
Use the Set Default Tactics view to maintain the superset of tactics (tactics values) for a retail business tactical area such as assortment, pricing, space, and so on. Tactics are the possible approaches suggested in the category plan for a specific tactical area. For example, in the area of assortment, tactic values could expand the assortment or increase private labels (PL). Tactics are assigned at the sub-category level in a category plan. This is done to maintain alignment to actions required at the sub-category level per the role and strategy assigned to achieve the business targets at the category level. Roles, strategies, and tactics are part of the category plan.
Table 3-13 lists the measure available in this view.
Table 3-13 Set Default Tactics Measure
| Label | Definition |
|---|---|
|
WP Tactic Values |
List of tactics' values used to assign a tactic to a sub-category as part of the category plan. Tactics represent the suggested actions in a tactical area such as assortment, pricing, space, and so on, in alignment with the role and strategy for a category and sub-category to meet the business targets. |
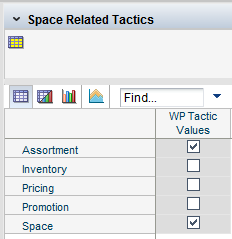
Use the Space Related Tactics view to set the default space tactics options. These default space tactics then appear as the drop-down selection options in the Assign Tactics view.
Table 3-14 lists the measure available in this view.
Table 3-14 Space Related Tactics Measure
| Label | Definition |
|---|---|
|
WP Tactic Values |
List of tactics' values used to assign a tactic to a sub-category as part of the category plan. Tactics represent the suggested actions in a tactical area such as assortment, pricing, space, and so on, in alignment with the role and strategy for a category and sub-category to meet the business targets. |
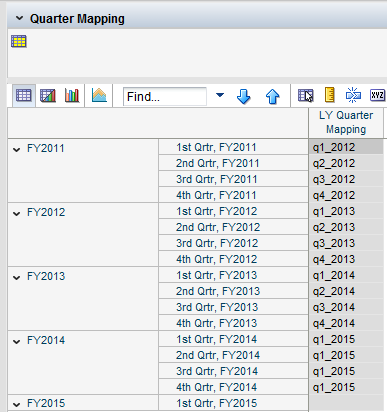
This step has two views:
Use these views to assign and validate the last year quarter or week mapping. By default, the loaded file maps the last year as the same quarter or week last year. The mapping for any quarter or week can be reassigned in this workbook.
Use this view to assign and validate the last year quarter mapping. By default, the loaded file maps the last year as the same quarter last year. The mapping for any quarter can be reassigned in this workbook.
Table 3-15 lists the measure available in this view.
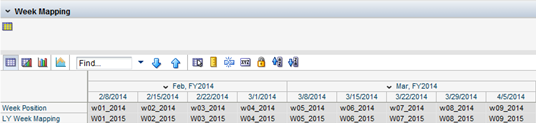
Use this view to assign and validate the last year week mapping. By default, the loaded file maps the last year as the same week last year. The mapping for any week can be reassigned in this workbook.
Table 3-16 lists the measures available in this view.
This step has one view.
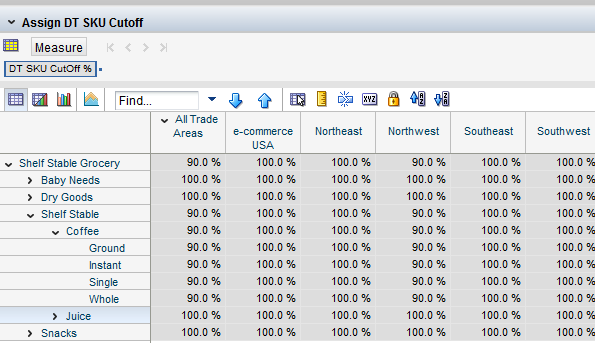
Use this view to define DT SKU CutOff %, which is used when applying DT to an assortment to calculate the No. of Significant Substitute SKUs for the substitutable demand from a SKU to its substitute SKUs. For more details, refer to the definition of DT SKU CutOff % in Table 3-17.
Table 3-17 lists the measure available in this view.
Table 3-17 Assign DT SKU Cutoff Measure
| Label | Definition |
|---|---|
|
DT SKU Cutoff % |
DT SKU Cut-Off % refers to the percentage of substitutable demand of a SKU. It is used in calculating the number of significant substitute SKUs. It defines the total amount of spread of substitutable demand among the substitute SKUs, shown in the DT Details type of view. This cut-off percentage is required to avoid looking at the tapered substitutable demand or tail of the substitutable demand that is thinly spread across the substitute SKUs. For example, 90% of the substitutable demand of a SKU spreads to 5 items, but the remaining 10% spreads to another 20 items. So, in such a case, if DT Cut-Off % = 90%, then tapered substitutable demand of 10% is not considered when calculating the number of significant substitute SKUs. If there is no tapering effect in substitutable demand, then it is best to keep DT Cut-Off % at 100%. |
Before performing MSO, the MSO tables should be populated in this step. The MSO tables form the basis of MSO and are maintained by an administrator. These tables are used to store a relationship between the allocated space and the respective gross profit returns at the retailer based on historical data. MSO tables are also space profit tables and space profit elasticity curves, which are derived using advanced science algorithms.
This step helps users to create and manage MSO tables for the POG Department and POG sub-category levels. The MSO tables are consumed by the special expression/API that generates optimized space and profits for the two POG hierarchy levels. The MSO tables can be systemically loaded using space elasticity models or through this step in which administrators and the implementation team populate the tables manually or systematically.
Here is a recommended approach to populate the MSO tables:
Identify key business considerations that can impact space profitability in the retailer's business.
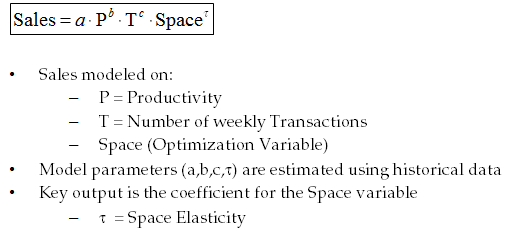
Combine retail business insights and data with statistical modeling best practices to generate elasticity models.
Here is an example of an elasticity model that can be configured into the RPAS Planning platform:
For more information on space planning and MSO, see Chapter 5 and Chapter 6.
This step has the following views:
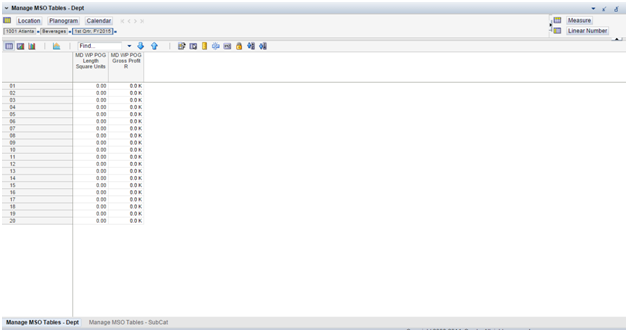
This view is used to maintain the data in the space profit tables at the POG Department level. This view presents two measures: MD WP POG Length Square Units and MD WP POG Gross Profit R. Figure 3-20 shows an example of this view, displaying the space profit table information for a POG Department.
Table 3-18 lists the measures available in this view.
Table 3-18 Manage MSO Tables @Dept View Measures
| Label | Description |
|---|---|
|
MD WP POG Length Square Units |
POG Department's (or Department Zone's) space in terms of the selling area in square units. |
|
MD WP POG Gross Profit R |
POG Department's (or Department Zone's) gross profit retail value. It is the corresponding value of gross profit to the POG Department's selling area. |
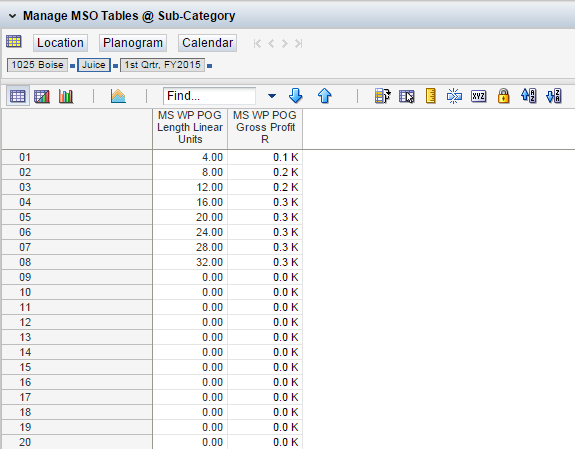
This view is used to maintain data in the space profit tables at the POG sub-category level. This view presents two measures: MS WP POG Length Linear Units and MS WP POG Gross Profit R. Figure 3-21 shows an example of this view presenting the space Pprofit table information for a POG sub-category.
Table 3-19 lists the measures available in this view.
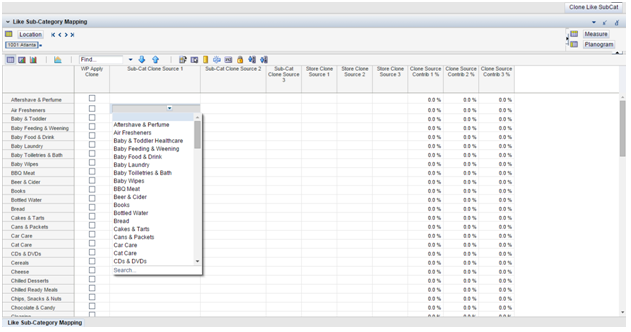
This step is used to populate the MSO tables for new POG sub-categories by mapping them to the existing POG sub-categories. This facilitates the participation of the new sub-categories in the MSO process.
This step has one view.
A new POG sub-category can be cloned, using a maximum of three existing sub-category/store combinations, as a clone source. Choose the existing POG sub-categories (or store) from the drop-down menu. Set the contribution percentage of the respective POG sub-category/store combination being used to clone the new POG sub-category. Execute the Clone Like Sub-Category custom menu. The MSO tables for a new POG sub-category are populated on the basis of the defined contribution percentages.
Table 3-20 lists the measures available in this view.
Table 3-20 Like Sub-Category Mapping View Measures
| Label | Description |
|---|---|
|
WP Apply Clone |
Boolean measure that needs to be checked to run the Like sub-category custom menu. |
|
Sub-Cat Clone Source 1 |
Contains a drop-down list that has the existing sub-categories from which to select a sub-category to be used as the first sub-category source to map and populate the new sub-category's MSO tables. |
|
Sub-Cat Clone Source 2 |
Contains a drop-down list that has the existing sub-categories from which to select a sub-category to be used as the second sub-category source to map and populate the new sub-category's MSO tables. |
|
Sub-Cat Clone Source 3 |
Contains a drop-down list that has the existing sub-categories from which to select a sub-category to be used as the third sub-category source to map and populate the new sub-category's MSO tables. |
|
Store Clone Source 1 |
Contains a drop-down list that has the stores from which to select a store corresponding to the first sub-category source to map and populate the new sub-category. |
|
Store Clone Source 2 |
Contains a drop-down list that has the stores from which to select a store corresponding to the second sub-category source to map and populate the new sub-category. |
|
Store Clone Source 3 |
Contains a drop-down list that has the stores from which to select a store corresponding to the third sub-category source to map and populate the new sub-category. |
|
Clone Source Contrib 1 % |
Contribution percentage from the first sub-category source and corresponding store used to derive the MSO tables of the new sub-category. |
|
Clone Source Contrib 2 % |
Contribution percentage from the second sub-category source and corresponding store used to derive the MSO tables of the new sub-category. |
|
Clone Source Contrib 3 % |
Contribution percentage from the third sub-category source and corresponding store used to derive the MSO tables of the new sub-category. |
Use this step to define the relationship between the POG and PROD hierarchies in terms of the distribution percentage.
The POG hierarchy represents the store layout and depicts the manner in which products are merchandised in the store. It consists of three levels:
POG Department equivalent to Department Zone in the store layout
POG Category equivalent to Category in the PROD hierarchy
POG Sub-Category equivalent to Sub-Category in the PROD hierarchy
The PROD hierarchy is mainly used in the back-end for Category Management, which includes defining roles, strategies, tactics, buying, pricing, promotions, assortment planning, and supply chain management.
The POG hierarchy is specifically used to define how the front-end of the store looks. Store layouts and planograms form the basis of the POG hierarchy. The POG hierarchy depicts the way a store is presented to the customer. MSO and Space Planning are based on the POG hierarchy in place of the PROD hierarchy.
For more information on space planning and MSO, see Chapter 5 and Chapter 6.
This step has the following views:
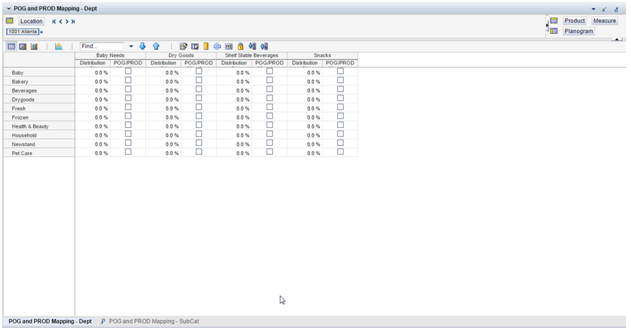
This view is used to define the relationship between the POG and PROD hierarchies at the department level. The POG hierarchy (y-axis) is presented against the PROD hierarchy (x-axis) in this view, so that mapping can be done between the POG departments and departments (from the PROD hierarchy). Check the relevant check boxes and set the distribution percentages for deriving the target sales retail for the POG departments.
Table 3-21 lists the measures available in this view.
Table 3-21 POG and PROD Hierarchy Mapping @Dept View Measures
| Label | Description |
|---|---|
|
Distribution % |
Distribution percentage used to map a POG department to a department (from the PROD hierarchy) to calculate the target sales retail value for the POG departments using the department targets from the category plan. |
|
POG/PROD Mapping - Dept |
Flag measure (Boolean measure) used to check the mapping of a POG department and department (from the PROD hierarchy). |
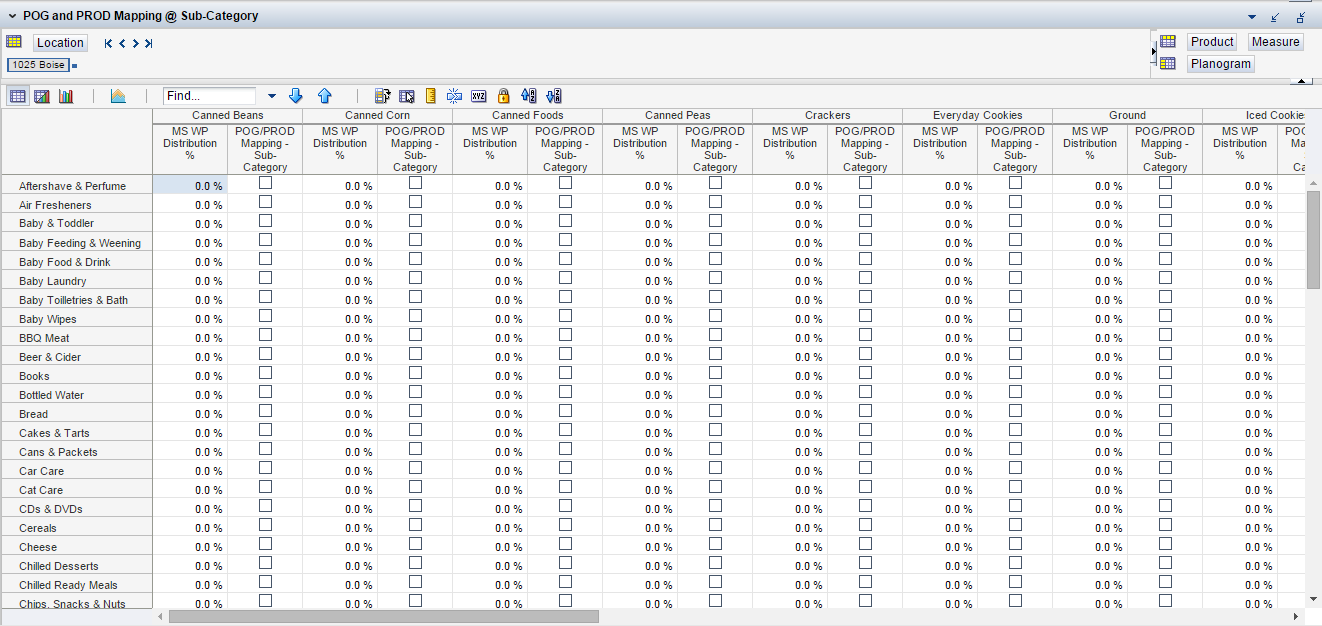
This view is used to define the relationship between the POG and PROD hierarchies at the sub-category level. The POG hierarchy (y-axis) is presented against the product hierarchy (x-axis) in this view, so that mapping can be done between the POG sub-categories and sub-categories (from the PROD hierarchy). Select the relevant check boxes and set the distribution percentages.
Table 3-22 lists the measures available in this view.
Table 3-22 POG and PROD Hierarchy Mapping @Sub-Category View Measures
| Label | Description |
|---|---|
|
Distribution % |
Distribution percentage used to map a POG sub-category to a sub-category (from the PROD hierarchy) to calculate the target sales retail value for the POG sub-category using the sub-category's targets from the category plan. |
|
POG/PROD Mapping - Sub-Category |
Flag measure (Boolean measure) used to check the mapping of a POG department and department (from the PROD hierarchy). |
This step in Category Management Administration is used to store the formalization information for placeholder items.
Placeholder items are created in RPAS using DPM in the Assortment Planning tasks. Note that when creating placeholder items, the item name and label should be maintained symmetrically in the RHS (Right Hand Side) Product hierarchy.
Placeholder items' details need to be shared with RMS (or an MDM system) that owns the system of record for items. RMS in turn creates formal items/SKUs with the information supplied by RCM. Formalization information consisting of mapping between the DPM position number (or placeholder item number) and formalized item number needs to be shared with RCM.
This step has one view.
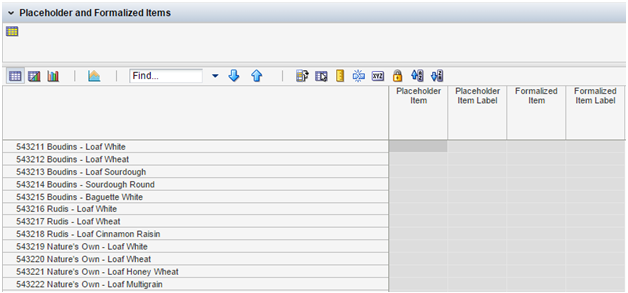
Imported formalization information from RMS or an MDM system is presented in this view. This is a read-only view. Formalization information consists of the mapping between formal items and placeholder items. Formalization information is stored in the Placeholder Item, Placeholder Item Label, Formalized Item, and Formalized Item Label measures.
After importing formalization information from RMS, standard RPAS functionality (through a nightly batch) is used to complete the formalization of placeholder items.
Formalization involves renaming the placeholder items' DPM position (stored separately in the Placeholder Item measure) with the actual position (stored in the Formalized Item measure). Similarly, the Formalized Item Label measure is updated for the placeholder items. The placeholder items' RHS Product Hierarchy details are also updated through formalization.
The workbooks containing the placeholder items must be rebuilt for the formalization items to be reflected there.
Table 3-23 lists the measures available in this view.
Table 3-23 Placeholder and Formalized Items View Measures
| Label | Description |
|---|---|
|
Placeholder Item |
Used to store the placeholder item number. Placeholder items are created using DP and their DPM position number serves as the placeholder item number. |
|
Placeholder Item Label |
Used to store the placeholder item label. Placeholder items are created using DPM. |
|
Formalized Item |
Used to store the formalized item number. Formalized items are created in RMS or an MDM system against the placeholder items created in RCM. |
|
Formalized Item Label |
Used to store the formalized item label. Formalized items are created in RMS or an MDM system against the placeholder items created in RCM. |