| Oracle® Retail Category Management User Guide for the RPAS Fusion Client Release 14.1.1 E62413-01 |
|

 Previous |
 Next |
| Oracle® Retail Category Management User Guide for the RPAS Fusion Client Release 14.1.1 E62413-01 |
|
Previous |
Next |
The Category Planning task forms the basis for Category Management and is used create category specific business plans and clearly define the role each and every category plays in a retailer's business to achieve the set business objectives.
It involves analyzing information from varied sources to obtain an understanding of a retailer's standing regarding competition that sets the required background for category planning. This information consists of consumer profile data, syndicated market data, syndicated household panel data, retailer's historic data, plan-period actuals, forecast data, and loyalty program data. The analysis of this information provides an understanding of a category's business from an internal performance, market, and consumer perspective, which drives the review, creation, and approval of category plans. Category Plans consist of sub-category/category level targets in the form of various retail business measures such as sales, gross profit, inventory targets, private label and promotional specific targets. In addition, one of the most important actions in category planning is the assignment of roles, strategies, and tactics to categories and sub-categories.
Category planning facilitates the allocation of resources to available business opportunities. It is conducted at the trading area level in the application, which is lowest level available on the location hierarchy in this task. Category plans are created at the sub-category and category levels for a specific planning period, which can vary between quarter, half-year or a year, depending on the business need.
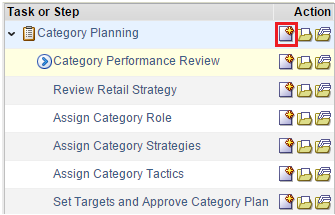
The Category Planning task has the following six steps:
The following data is required for this task:
Predefined consumer segments presented as foundation data such as product hierarchy, location hierarchy, and calendar hierarchy, loaded as part of the domain setup
Consumer segment distribution
Predefined tactics pick list and week/quarter mapping information from the administration workbooks
Predefined trading areas as part of the location hierarchy, which is again loaded as part of the domain setup
Forecast data from Oracle Retail Demand Forecasting (RDF) or any other forecasting solution
POS data of the retailer
Market and household panel data from external sources, such as Nielsen, Symphony, and IRI is needed for performing analysis and actions that consider market or consumer perspective
All external data from market research companies and other applications, including CRM solutions and BI solutions such Oracle Retail Analytics (RA), pre-computed or aggregated and not required to be re-computed within Category Planning
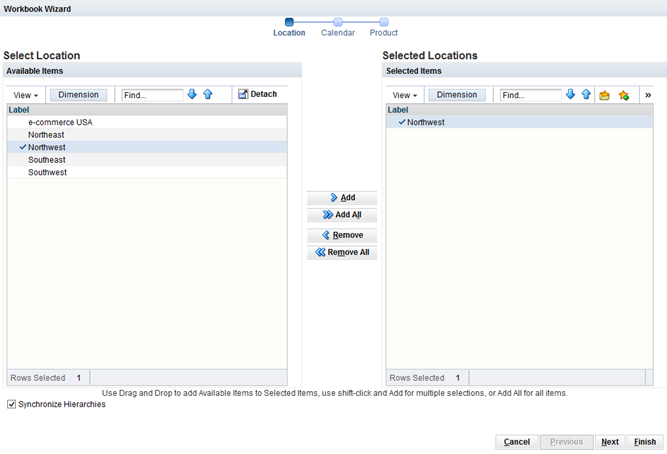
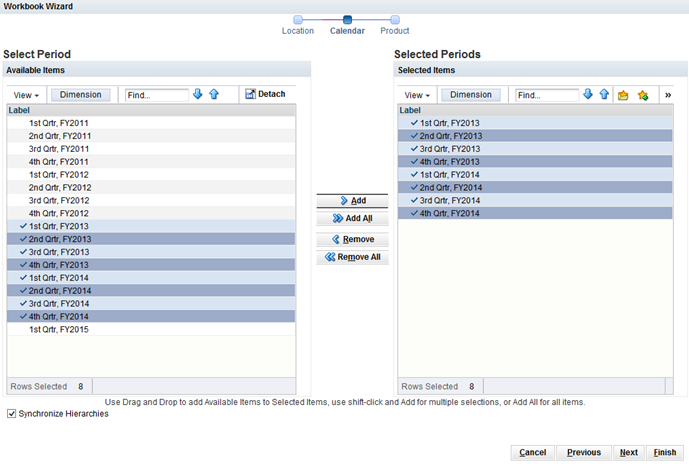
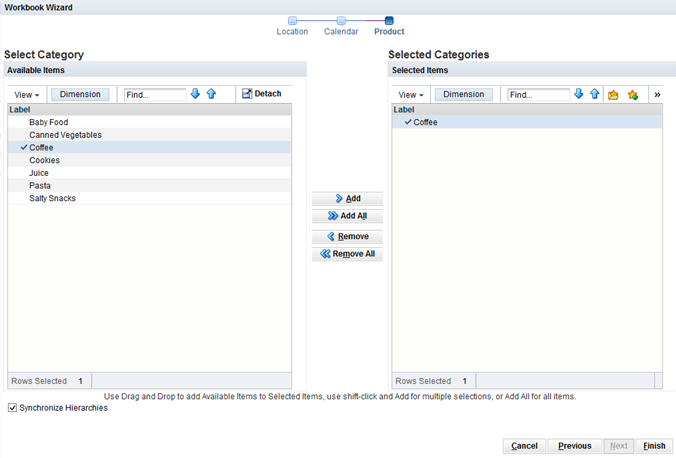
To create the workbook:
Select the New Workbook icon in the Category Planning task.
The workbook wizard opens.
Select one location and move it to the Selected Items box. Click Next.
Select the calendar periods and move them to the Selected Items box. Click Next.
Select the categories and move them to the Selected Items box. Click Finish.
The workbook is created.
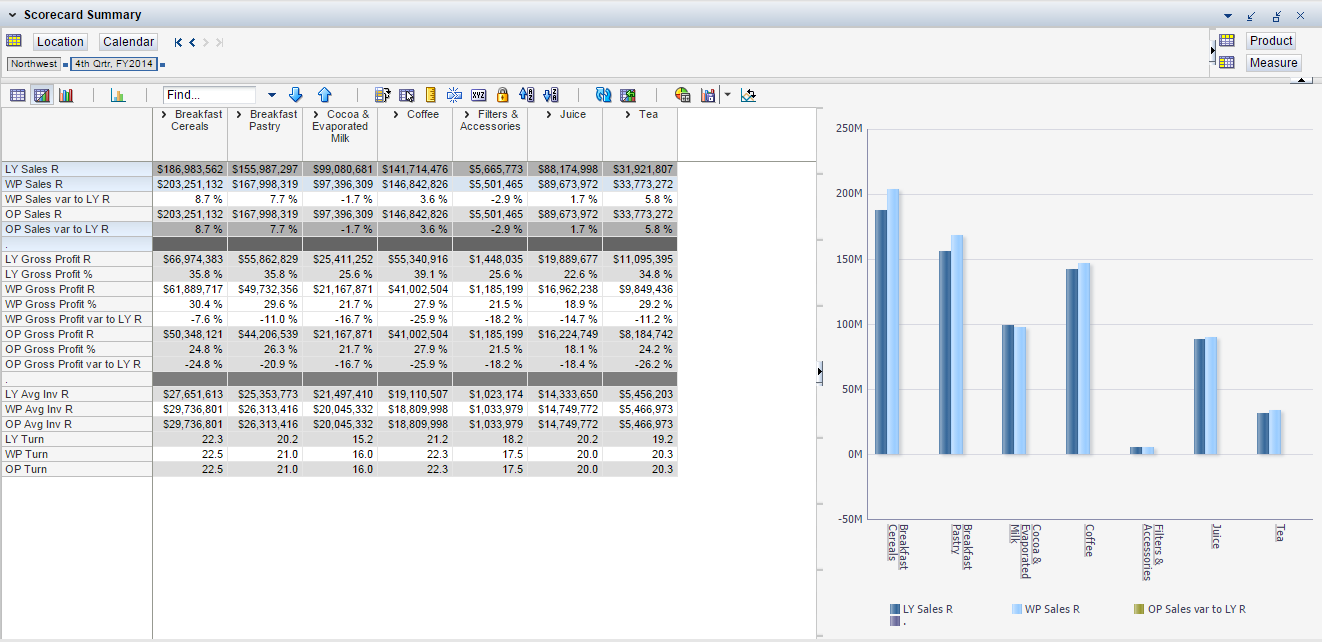
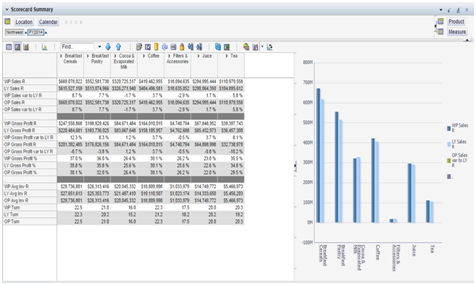
The Category Performance Review Step is a dashboard view for the user to assess the performance of a category and sub-category against the targets set for the approved category plan. In the pre-season context when category planning starts, this view is used to review LY (last year) data, which serves as a good reference for the new category plans' creation. In the in-season context, it is used to track actuals (in the form of WP data) against the approved category plan targets (OP - Original Plan version).
This step has one view, Scorecard Summary. Use this view to assess the performance categories and their respective sub-categories.
The Scorecard Summary view contains three measure profiles for basic retail parameters such as sales and gross profit at different levels:
Sales – Overall sales and gross profit information for national brands and private labels
Promo Sales – Promotional sales
Private Label Sales – Sales and gross profit for private labels
Table 4-1 lists the measures available in the Scorecard Summary Sales Measure Profile View.
Table 4-1 Scorecard Summary Sales Measure Profile Measures
| Label | Definition |
|---|---|
|
LY Sales R |
Last year's sales retail value (actuals) from the merchandise. |
|
WP Sales R |
Sales retail value from the merchandise in category plan's working plan version. |
|
WP Sales var to LY R |
The working plan's sales retail value's variance to the same in last year's actuals. |
|
OP Sales R |
The original plan assortment's sales retail value. The original plan represents the approved category plan and is used in assortment planning as the target sales retail value. |
|
OP Sales var to LY R |
The original plan's sales retail value's variance to the same in last year's actuals. |
|
LY Gross Profit R |
Last year's gross profit retail value (actuals) from the merchandise. |
|
LY Gross Profit % |
Last year's gross profit percentage from the merchandise. |
|
WP Gross Profit R |
The gross profit retail value from the merchandise in the category plan's working plan version. |
|
WP Gross Profit % |
The gross profit percentage from the merchandise in the category plan's working plan version. |
|
WP Gross Profit var to LY R |
The working plan's gross profit retail value's variance to last year's gross profit retail value actuals. |
|
OP Gross Profit R |
Approved category plan's (referred to as original plan) gross profit retail value. It is shared as a target with assortment planning and MSO. |
|
OP Gross Profit % |
Approved category plan's (referred to as original plan) gross profit percentage. It is shared as a target with assortment planning and MSO. |
|
OP Gross Profit var to LY |
The original plan's gross profit value's variance to the same in last year's actuals. |
|
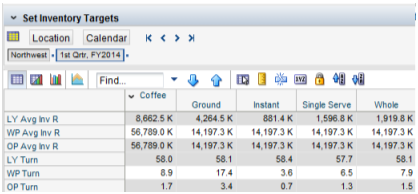
LY Avg Inv R |
The average inventory retail value or stock retail value carried by the category or sub-category per last year's actuals. Average inventory retail value represents an average retail value of merchandise bought, received, and carried by the retailer before it gets sold at any point in time. This average inventory retail value is generally calculated on a weekly basis or a monthly basis to get an understanding of the money invested in inventory or buying merchandise. |
|
WP Avg Inv R |
The average inventory retail value to be carried by a category or sub-category in a given planning period, per the category plan's working plan version. |
|
OP Avg Inv R |
Average inventory retail value to be carried by a category or sub-category per the approved category plan or original plan. |
|
LY Turn |
Inventory turns per last year's actuals. It reflects the number of times the average inventory carried can be sold over a specified period of time. |
|
WP Turn |
Inventory turns in the working plan version of the category plan. It is the number of times the average inventory carried can be sold over a specified period of time. In other words, it reflects the speed of inventory movement. |
|
OP Turn |
Inventory turns in the approved category plan or original plan. It reflects the number of times the average inventory carried can be sold over a specified period of time. |
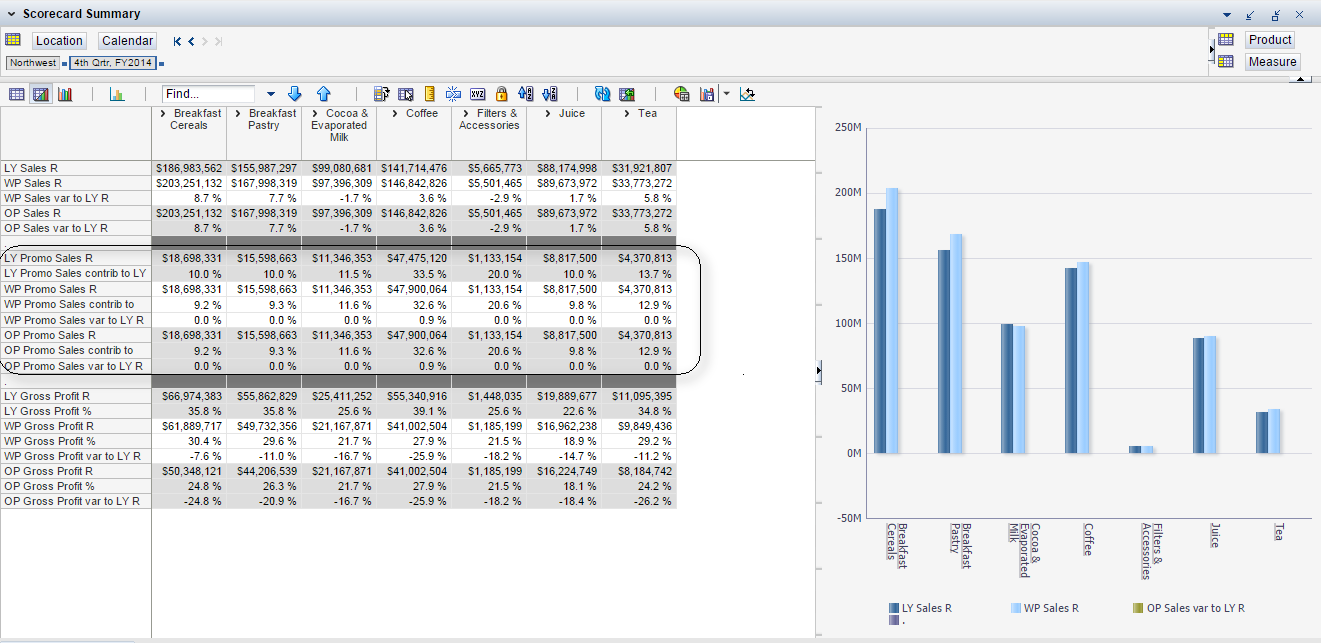
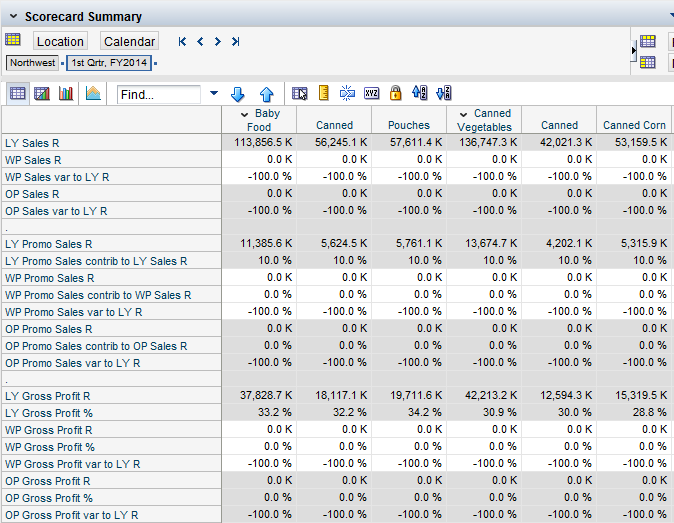
Table 4-2 lists the measures available in the Promo Sales Measure Profile View.
Table 4-2 Scorecard Summary Promo Sales Measure Profile Measures
| Label | Definition |
|---|---|
|
LY Sales R |
Last year's sales retail value (actuals) from the merchandise. |
|
WP Sales R |
Sales retail value from the merchandise in category plan's working plan version. |
|
WP Sales var to LY R |
The working plan's sales retail value's variance to the same in last year's actuals. |
|
OP Sales R |
Approved category plan's (referred to as original plan) sales retail value. It is shared as a target with assortment planning and MSO. |
|
OP Sales var to LY R |
The original plan's sales retail value's variance to the same in last year's actuals. |
|
LY Promo Sales R |
Last year's promotional sales retail value actuals. |
|
LY Promo Sales contrib to LY Sales R |
Last year's promotional sales retail contribution, in percentage points, to the overall sales retail of last year's actuals. |
|
Wp Promo Sales R |
Promotional sales retail in the working plan version of the category plan. |
|
WP Promo Sales contrib to WP Sales R |
The promotional sales retail contribution, in percentage points, to the overall sales retail of the working plan version of the category plan. |
|
WP Promo Sales var to LY R |
The working plan's promotional sales retail value's variance to the same in last year plan's actuals. |
|
OP Promo Sales R |
Promotional sales retail in the original plan assortment. |
|
OP Promo Sales contrib to OP Sales R |
The original plan's promotional sales retail value's variance to the same in last year plan's actuals. |
|
OP Promo Sales var to LY R |
The original plan's promotional sales retail value's variance to the same in last year's actuals. |
|
LY Gross Profit R |
Last year's gross profit retail value (actuals) from the merchandise. |
|
LY Gross Profit % |
Last year's gross profit percentage from the merchandise. |
|
WP Gross Profit R |
The gross profit retail value from the merchandise in the category plan's working plan version. |
|
WP Gross Profit % |
The gross profit percentage from the merchandise in the category plan's working plan version. |
|
WP Gross Profit var to LY R |
The working plan's gross profit retail value's variance to last year's gross profit retail value actuals. |
|
OP Gross Profit R |
Approved category plan's (referred to as original plan) gross profit retail value. It is shared as a target with assortment planning and MSO. |
|
OP Gross Profit % |
Approved category plan's (referred to as original plan) gross profit percentage. It is shared as a target with assortment planning and MSO. |
|
OP Gross Profit var to LY R |
Gross profit retail value variance between the original plan and last year's actuals. |
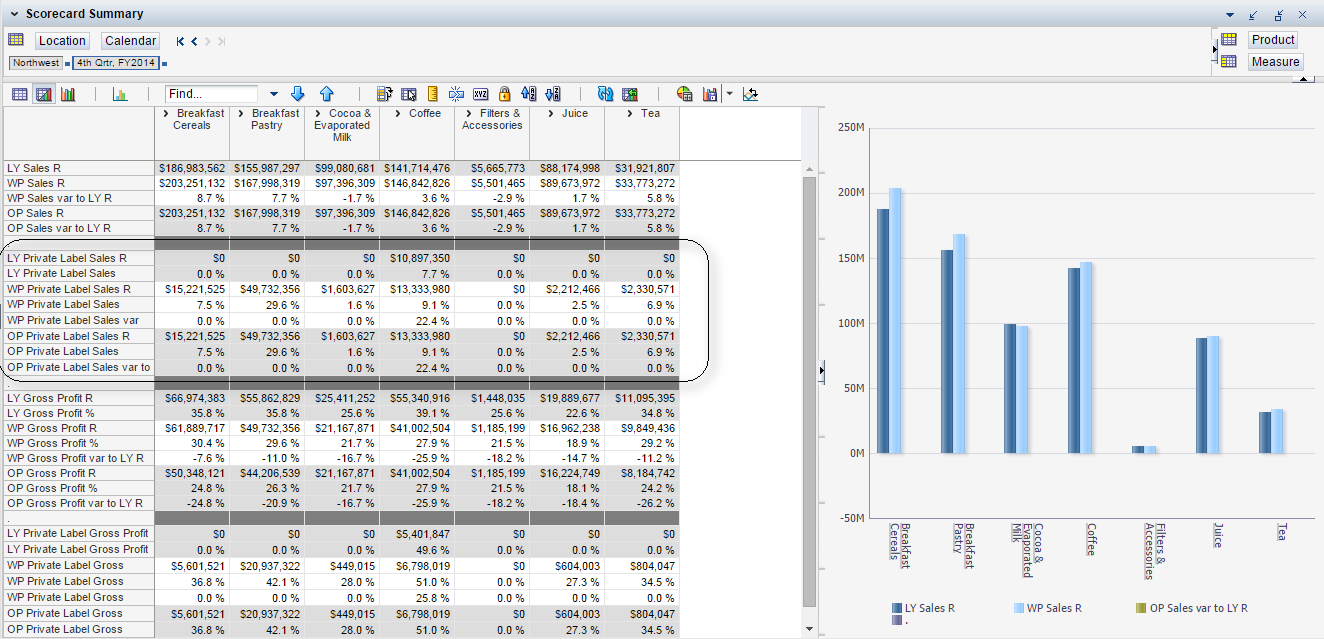
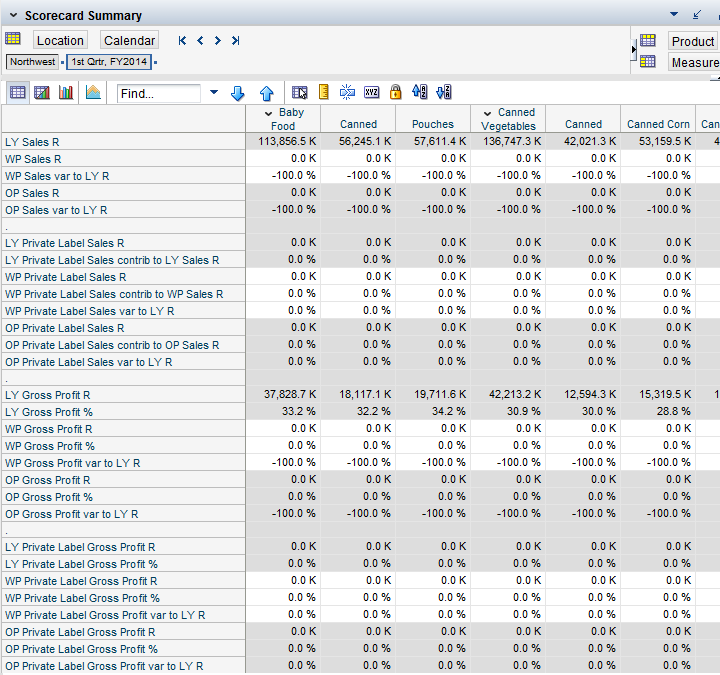
Table 4-3 lists the measures available in the Private Label Measure Profile View.
Table 4-3 Scorecard Summary Private Label Measure Profile Measures
| Label | Definition |
|---|---|
|
LY Sales R |
Last year's sales retail value (actuals) from the merchandise. |
|
WP Sales R |
Sales retail value from the merchandise in category plan's working plan version. |
|
WP Sales var to LY R |
The working plan's sales retail value's variance to the same in last year's actuals. |
|
OP Sales R |
Approved category plan's (referred to as original plan) sales retail value. It is shared as a target with assortment planning and MSO. |
|
OP Sales var to LY R |
The original plan's sales retail value's variance to the same in last year's actuals. |
|
LY Private Label Sales R |
Sales retail value from private label merchandise, for a category or sub-category, per last year's actuals. |
|
LY Private Label Sales contrib to LY Sales R |
Last year's sales retail contribution of private label merchandise to the overall sales retail in last year's actuals expressed in percentage points. |
|
WP Private Label Sales R |
The private label items' sales retail value in a working plan version of the category plan. |
|
WP Private Label Sales contrib to WP Sales R |
The sales retail contribution of private label merchandise to the overall sales retail of the working plan version of the category plan expressed in percentage points. |
|
WP Private Label Sales var to LY R |
The working plan's private label merchandise's sales retail variance to the same in last year's actuals. |
|
OP Private Label Sales R |
The private label items' sales retail value in the pre-season original plan assortment. |
|
OP Private Label Sales contrib to OP Sales R |
The original plan's private label sales retail value's contribution to the overall sales retail value in the original plan. |
|
OP Private Label Sales var to LY R |
The original plan's private label items' sales retail variance to the same in last year plan's actuals. |
|
LY Gross Profit R |
Last year's gross profit retail value (actuals) from the merchandise. |
|
LY Gross Profit % |
Last year's gross profit percentage from the merchandise. |
|
WP Gross Profit R |
The gross profit retail value from the merchandise in the category plan's working plan version. |
|
WP Gross Profit % |
The gross profit percentage from the merchandise in the category plan's working plan version. |
|
WP Gross Profit var to LY R |
The working plan's gross profit retail value's variance to last year's gross profit retail value actuals. |
|
OP Gross Profit R |
Approved category plan's (referred to as original plan) gross profit retail value. It is shared as a target with assortment planning and MSO. |
|
OP Gross Profit % |
Approved category plan's (referred to as original plan) gross profit retail percentage. It is shared as a target with assortment planning and MSO. |
|
OP Gross Profit var to LY |
Gross profit percentage from the merchandise per the original plan. |
|
LY Private Label Gross Profit R |
Gross profit retail of private label items in last year's assortment for the cluster. |
|
LY Private Label Gross Profit % |
Gross profit percentage of private label items in last year's assortment for the cluster. |
|
WP Private Label Gross Profit R |
The gross profit retail of private label items in a working plan assortment. |
|
WP Private Label Gross Profit % |
The gross profit percentage of private label items in a working plan assortment. |
|
WP Private Label Gross Profit var to LY R |
The working plan's private label items' gross profit retail's variance to the same in last year plan's actuals. |
|
OP Private Label Gross Profit R |
The original plan's private label merchandise's gross profit value. It is the original plan's sales retail value of private label merchandise sold minus the corresponding cost of goods sold (COGS). |
|
OP Private Label Gross Profit % |
The original plan's private label merchandise's gross profit value. It is the original plan's approved retail sales values minus the COGS. It is the whole divided by the retail sales value. |
|
OP Private Label Gross Profit var to LY R |
The original plan's private label merchandise's gross profit retail value's variation to last year's actuals. |
Retailers need to review information from diverse sources to analyze and identify target consumer segment profiles, trading area opportunities, and the competition. The category plans should be based on business context, which requires a review of demographics, psychographic information about consumers shopping in the market, their buying behavior, and the retailer's standing regarding the competition in terms of key business parameters.
This step brings in the understanding of the business situation in the market in which the retailer competes in terms of the potential business, consumer profile composition, and their respective spends. This sets the foundation for the category planning process to begin. The retail strategy should answer the following questions:
Who are the retailer's target shoppers and is the retailer reaching them?
Who are the retailer's competitors for the target shopper?
What opportunities exist to improve the retailer's competitive position?
Which categories are most strategic in the market and for the retailer?
How should the retailer assign category roles and resources while allocating resources to opportunities?
This step has the following views:
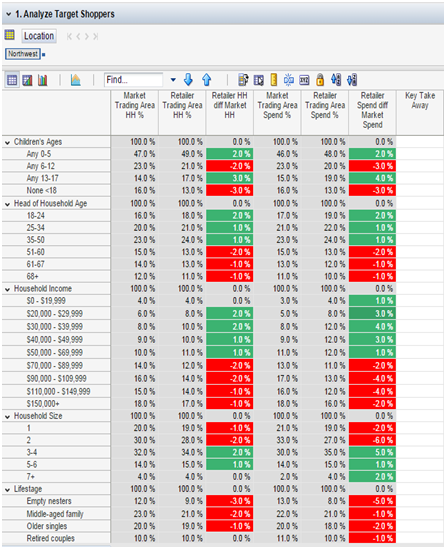
1. Analyze Target Shoppers View
2. Analyze Trading Area Opportunity View
Use this view to analyze target shoppers. Consumer demographic and psychographic information is presented against their relative presence, contribution, and spend in the market compared with the retailer. This analysis provides an insight into whether or not the retailer is stronger compared to the total market with respect to a particular consumer demographic group. It specifically provides insight into the following:
The composition of the consumers who shop at the retailer as compared to the overall market.
The percentage of the total spending in that market from a specific consumer profile.
The view exists at the following levels:
Consumer Profile in the form of demographic and psychographic parameters such as, household income, number of children, and so on
Trading Area (see the definition of trading area in Required Data. In the application examples of trading area in GA data include Northwest and Northeast.)
Table 4-4 lists the measures available in this view. The data is loaded from Household Panel data.
Table 4-4 1. Analyze Target Shoppers Measures
| Label | Definition |
|---|---|
|
Market Trading Area HH % |
The percentage of market households that belong to a particular consumer segment profile based on meeting specific demographic or psychographic parameters criteria. |
|
Retailer Trading Area HH % |
The percentage of market households that shop at the retailer and belong to a particular consumer segment profile based on meeting specific demographic or psychographic parameters criteria. |
|
Retailer HH diff Market HH |
The difference between Retailer HH % and Market HH % for a particular consumer segment profile based on meeting specific demographic or psychographic parameters criteria. In general, for the target consumer segment profile parameters, a positive value is a good sign. |
|
Market Trading Area Spend % |
Markets' spend percentage produced by a particular consumer segment profile based on meeting specific demographic or psychographic parameters criteria. This measure provides the spread of overall spend in the market. It takes into consideration the overall market sales. |
|
Retailer Trading Area Spend % |
Spend percentage of the overall spend at the retailer produced by a specific consumer segment profile (based on meeting a specific demographic or psychographic parameters criteria). This measure provides the spread of overall spend at the retailer. It only considers the sales generated by the retailer. |
|
Retailer Spend Diff Market Spend |
The difference in spend percentage between the market and the retailer. It is the difference between Market Spend % and Retailer Spend %. |
|
Key Take Away |
The user comments and notes that can be saved against each consumer segment profile parameter. |
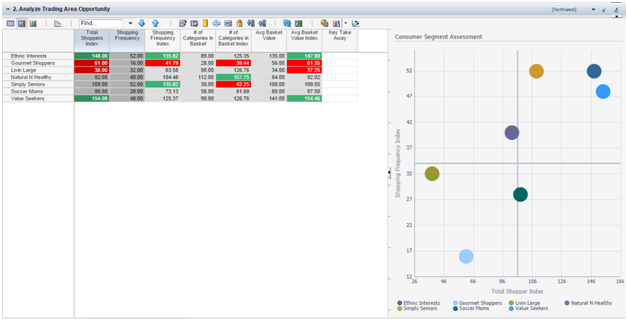
Use this view to see the analytics that identify whether or not target shoppers offer a good business opportunity by comparing selected metrics with the overall market averages and other consumer segments.
This view exists at the following levels:
Consumer Segment, such as Gourmet Shoppers and Soccer Moms
Trading Area
Table 4-5 lists the measures available in this view. The data is loaded from Household Panel data.
Table 4-5 2. Analyze Trading Area Opportunity Measures
| Label | Definition |
|---|---|
|
Total Shoppers Index |
The percentage of sales volume at the retailer, driven by a consumer segment in relation to other consumer segments. It is calculated using the index to average method and facilitates the identification of target consumer segments. |
|
Shopping Frequency |
The total number of shopping occasions of a consumer segment in a given time period (time period as specified in the workbook build). |
|
Shopping Frequency Index |
An index value indicating the relative shopping frequency of a consumer segment compared with other consumer segments. This index is based on the shopping frequency values of different consumer segments and calculated using the index-to-average method. |
|
# of Categories in Basket |
The number of product categories with at least one item in a basket (customer's purchases or customer's basket). This measure is available at the trading area and consumer segment level. |
|
# of Categories in Basket Index |
An index value to gauge the relative standing of consumer segments in terms of the number of categories in their basket in relation to other consumer segments. It is calculated using an index-to-average method. |
|
Avg. Basket Value |
The average purchase value of a consumer for a particular consumer segment. The consumer's purchase is often referred to as consumer's basket. |
|
Avg. Basket Value Index |
An index indicating the relative size of a consumer segment's basket, or purchases, based on the average basket values of a consumer segment. It is calculated using the index-to-average method. |
|
Key Take Away |
The user comments and notes that can be saved against each consumer segment. |
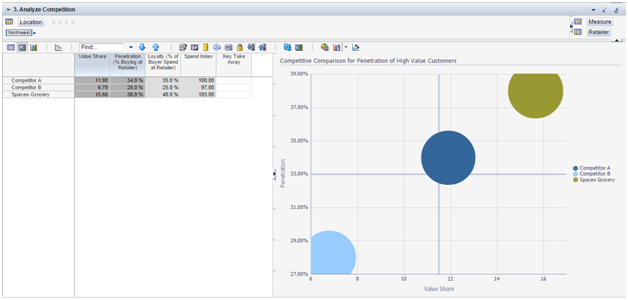
Use this view to determine who the retailer's strongest competitors are and if opportunities exist to improve the retailer's position.
This view exists at the following levels:
Retailer level, presenting retailers competing in the market (trading area)
Trading Area
Table 4-6 lists the measures available in this view. The measures are loaded from Household Panel data.
Table 4-6 3. Analyze Competition Measures
| Label | Definition |
|---|---|
|
Value Share |
A metric used to gauge the share of a retailer in overall market value. Market value is calculated on the basis of retailer's reach in the market, loyalty exhibited by its customer base, and 'customers' spend' at the retailer. This measure is calculated using the following formula: Penetration multiplied by Loyalty Index multiplied by Spending Index. |
|
Penetration (% Buying at Retailer) |
Category Planning Default Value Penetration (% Buying at Retailer) Percent. The percentage of households buying at the retailer. |
|
Loyalty (% of Buyer Spend at Retailer) |
Category Planning Default Value Loyalty (% of Buyer Spend at Retailer) Percent. The percentage of the spending that retail buyers spend at the retailer. |
|
Spend Index |
An index value based on the spend percentage of the consumers or market as a whole, attracted by the retailer compared to the average spend percentage at the other retailers competing in the market. It is calculated by the index-to-average method. |
|
Key Take Away |
The user comments and notes that can be saved against each competitor. |
In a gamut of product categories that the retailer stocks and sells, it is important to fix a role for each and every product category to clearly define and align with overall macro-retail business objectives set by the top management. This provides a sense of clarity, harmony, and synchronization among different product categories that are part of the retailer's portfolio and avoids a situation of overlapping sales or resource allocation conflicts between different product categories. It helps the retailer by clearly defining and meeting business targets for individual product categories by defining appropriate assortments meeting consumer expectations.
Category management is a practice to manage individual product categories as independent business units, but there is a certain role or a guideline to which each business unit needs to adhere to, which is incorporated by role assignment to categories. Category roles represent the importance and function of a product category in a retailer's business in the larger scheme of things.
To present an analogy, if a product category is an individual business unit, the category role is like a vision statement for the respective business unit. Similarly, strategies and tactics, which are assigned in the later part of the category planning process flow, are mission and goals to product categories and sub-categories. So, in effect, roles, strategies, and tactics to product categories are like the vision, mission, and goals for individual business units. Strategies suggest the overall approach to achieve the required category role. Tactics are a set of activities to attain the set strategy.
The assignment of roles, strategies, and tactics fulfills an imminent need in retail business planning, which is to orchestrate the whole business, consisting of numerous product categories, in a manner to maximize sales, profits, and produce optimum business results.
Roles, strategies and tactics along with category plan targets are shared with assortment planning and MSO tasks on approval. They are used as a reference or set of guidelines to make an assortment plan.
The retailer needs to view and analyze information from diverse sources to determine what role each category plays in the retailer's business so that the larger retail business objectives are met. Category planning provides the ability to analyze category roles by providing insight into which categories are most strategic in the market as well as which are most strategic for the retailer's target shoppers. This analysis sets the foundation for understanding which categories should be assigned what roles, considering the retailer's portfolio. There are two industry models available as part of the base GA solution used to assign roles to a category: Industry Model A and Industry Model B. These industry models draw from industry standard best practices. Role assignment to a category also depends on the intent or overall game plan of the retailer to compete in the market, which is why Category Manager's discretion is very important in the assignment of category roles.
This step initially presents market insights highlighting the market shares, growth, value shares, trends, and so on, cross-category consumer segment spend analysis, and internal cross-category performance analysis, setting the background for category role assignments. In effect, this step presents a different analysis that answer key questions such as:
Consumer
Who buys the category?
What percentage buys the category?
How frequently do they purchase?
How much do they spend?
When do they buy the category?
What drives their purchases?
What else is in their basket?
How loyal are they to the category?
Retailers
How productive are overall sales and profit trends?
How productive is the current assortment?
How productive is the current pricing?
How effective are current promotions?
What are the inventory turns and days of supply?
What are the profit margins, velocity, and inventory levels?
Market/Competitor
What are the sales trends of the category in the market?
What is the retailer's share?
What are the opportunities?
How does pricing compare to the competition?
How does the assortment compare?
How does promotional activity compare?
The following data is required for this step:
Retailer's loyalty data
Market scan data
Household panel data
This step contains two measure profiles:
Market
Retailer
This step also contains the following tabs and views:
Analyze Market Share and Growth Tab:
1. Analyze Market Share and Growth View
5. Analyze Cross Category Spending View
6. Analyze Spend Versus Frequency View
7. Analyze Consumer Purchase Behavior View
Mkt Share / Growth / Category Size
Mkt Share / Growth / Sales View
Analyze and Assign Category Role - Industry Model A Tab:
1. Analyze Historic Performance - Industry Model A View
Analyze and Assign Category Role - Industry Model B Tab:
1. Analyze Historic Performance - Industry Model B View
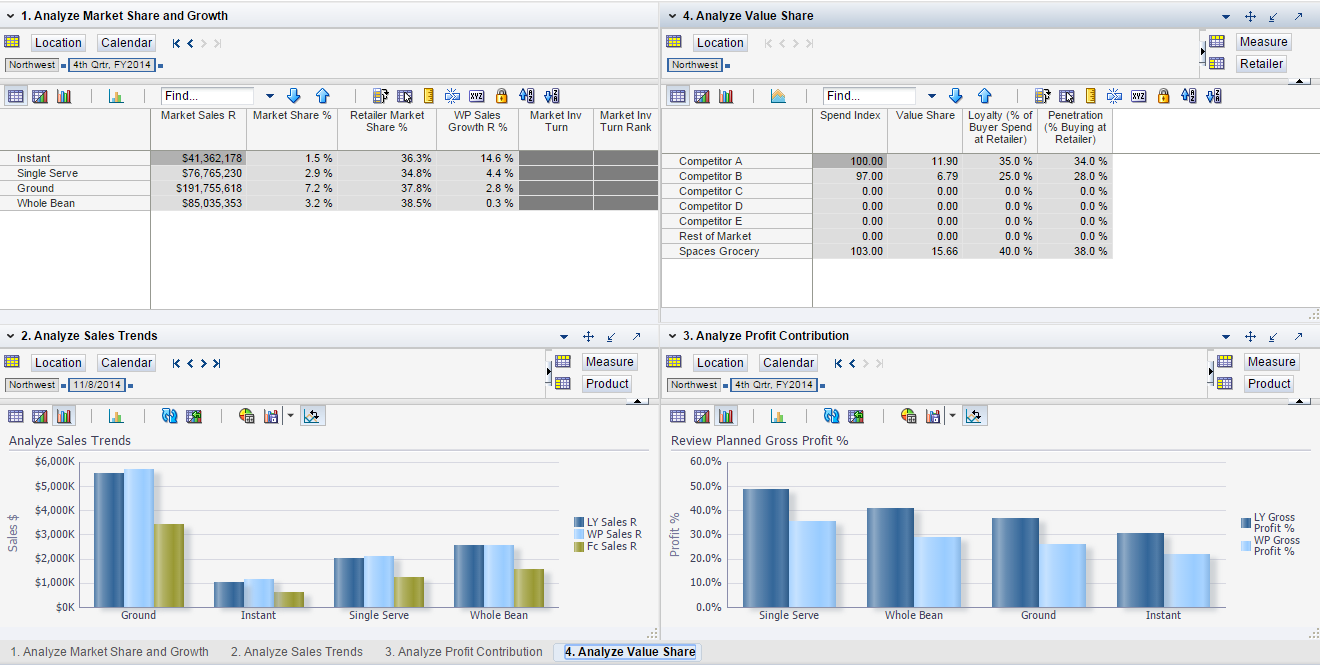
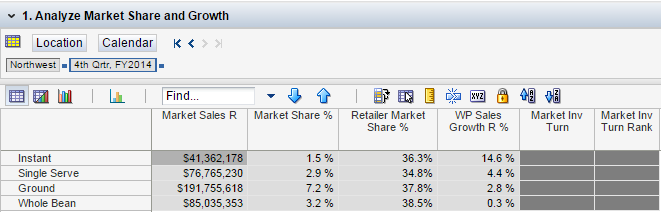
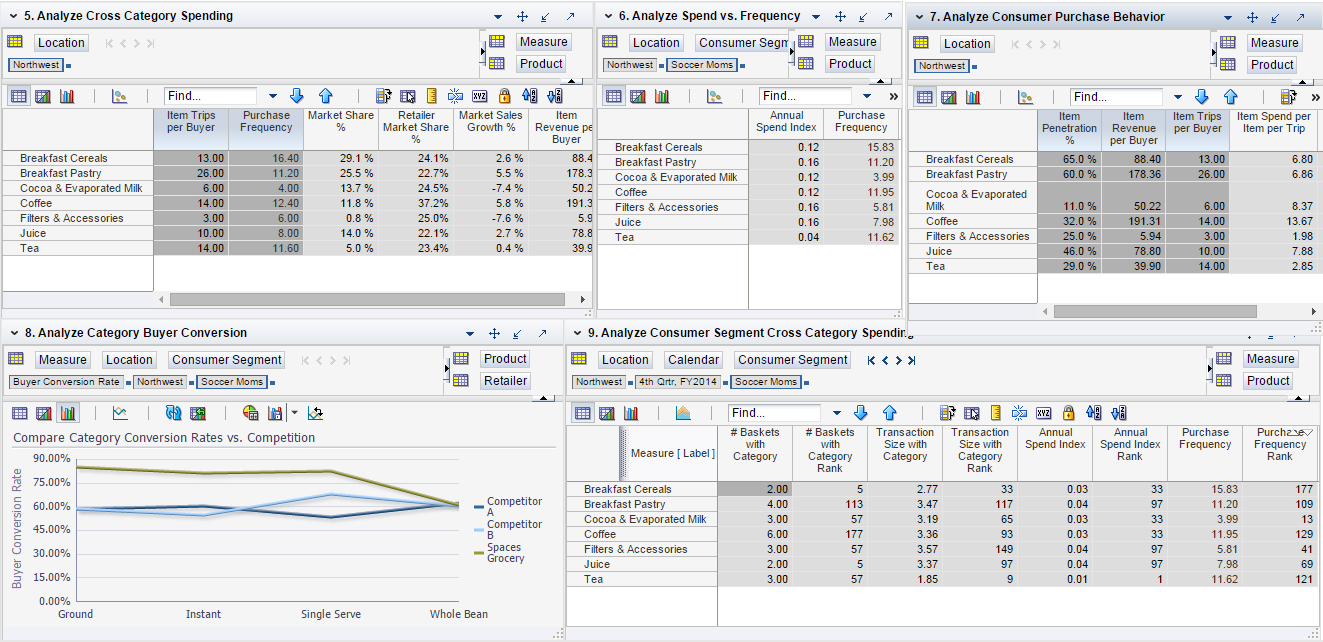
This tab presents a combined view of market insights and the retailer's standing in the market in terms of various business parameters. This provides a market business context or highlights the business situation of the market for a product category. In effect, it builds the required market business background for the category manager to create an optimum category plan.
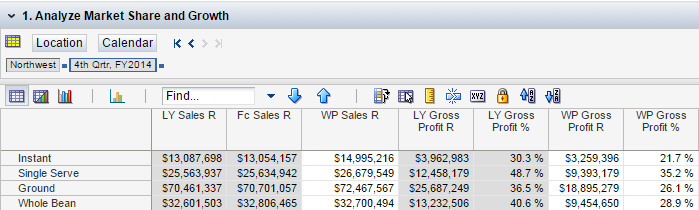
Use this view to analyze which categories are growing fastest in the market and which of the categories are the strongest for the retailer as compared to all competitors across all consumer segments.
The following figure shows the four views for this tab.
This view exists at the following levels:
Category
Trading Area
Table 4-7 lists the measures available in this view. The measures are loaded from market scan competitive data.
Table 4-7 1. Analyze Market Share and Growth Measures (Market Measure Profile)
| Label | Definition |
|---|---|
|
Market Sales R |
The sales retail value of the merchandise in the market, typically at the trading area level or above. This information is sourced from third parties providing syndicated data such as Nielsen, IRI, and so on, on a quarterly basis. |
|
Market Share % |
The percentage of market sales generated by a particular product segment towards the overall market sales of the larger product segment to which it maps in the product hierarchy. For example, a sub-category's market sales percentage in the overall market sales retail of the category or the percentage of department's sales generated by a category. |
|
Retailer Market Share % |
The retailer's sales retail value share of the overall market for a sub-category or a category. |
|
WP Sales Growth R % |
The working plan's sales retail's growth rate. |
|
Market Inv Turn |
This measure reflects the market's (typically, trading area level or above) average inventory, taking into consideration all the retailers competing in the market. Inventory turns are defined as the number of times a retailer sells out its average inventory carried at a location (for example a store, DC, a fulfillment center, and so on) in a given period of time. It represents the speed with which inventory is sold. Inventory Turns are calculated by dividing Sales by Average Inventory. If a retailer turns its inventory 22 times a year, it means that, on average, the retailer purchases and sells a product 22 times a year. |
|
Market Inv Turn Rank |
An ordinal rank assigned to product segment (sub-category, category, and so on) on the basis of the Market Inv Turn measure. |
Table 4-8 lists the measures available in this view. The measures are loaded from retailer scan competitive data.
Table 4-8 1. Analyze Market Share and Growth Measures (Retailer Measure Profile)
| Label | Definition |
|---|---|
|
LY Sales R |
Last year's sales retail value (actuals) from the merchandise. |
|
Fc Sales R |
Forecasted sales retail value for a specific time period. It is generated in RCM by using Automated Exponential Smoothing (AutoES) libraries sourced from RDF. AutoES libraries are embedded in RCM. AutoES uses historic data to generate these forecasts. It can be scheduled periodically through batch jobs. |
|
WP Sales R |
Sales retail value from the merchandise in category plan's working plan version. |
|
LY Gross Profit R |
Last year's gross profit retail value (actuals) from the merchandise. |
|
LY Gross Profit % |
Last year's gross profit percentage from the merchandise. |
|
WP Gross Profit R |
The gross profit retail value from the merchandise in category plan's working plan version |
|
WP Gross Profit % |
The gross profit percentage from the merchandise in category plan's working plan version |
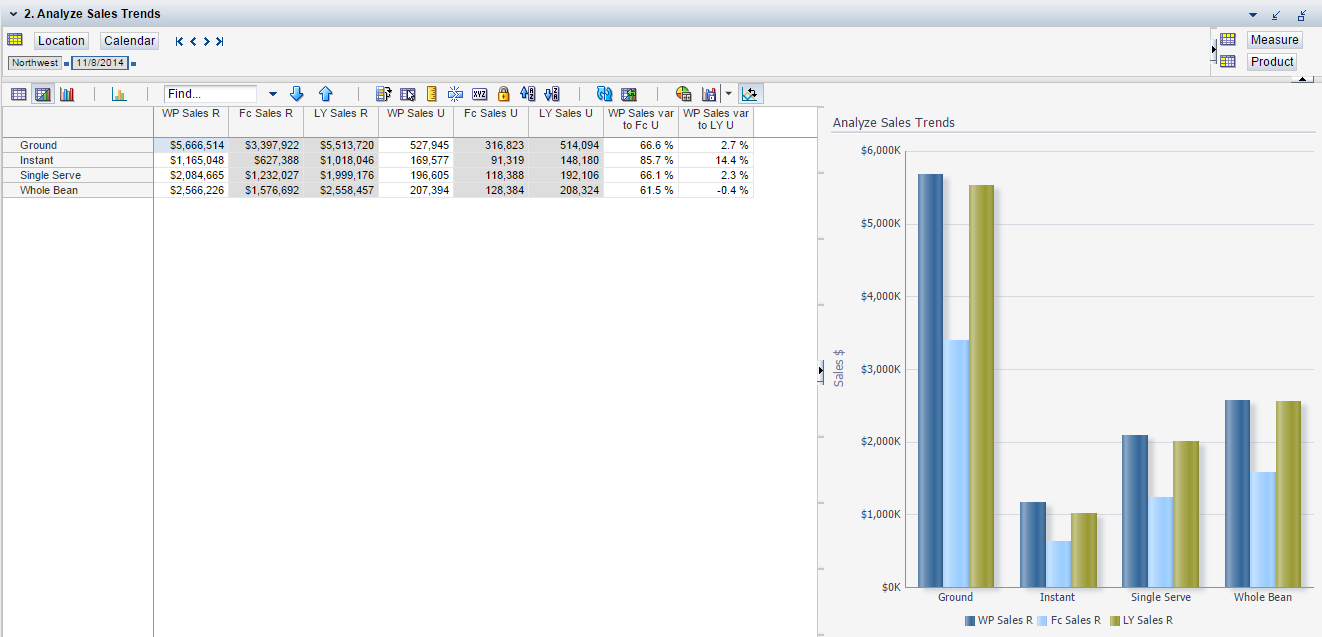
Use this view to determine the category role between seasonal and convenience. Using the chart, you can infer which of the categories exhibit seasonal behavior. This information is best viewed as a column chart.
This view exists at the following levels:
Week
Sub-Category
Trading Area
Table 4-9 lists the measures available in this view.
Table 4-9 2. Analyze Sales Trends Measures
| Label | Definition |
|---|---|
|
WP Sales R |
Sales retail value from the merchandise in category plan's working plan version. |
|
Fc Sales R |
Forecasted sales retail value for a specific time period. It is generated in RCM by using AutoES libraries sourced from RDF. AutoES libraries are embedded in RCM. AutoES uses historic data to generate these forecasts. It can be scheduled periodically through batch jobs. |
|
LY Sales R |
Last year's sales retail value (actuals) from the merchandise. |
|
WP Sales U |
Sales units from the merchandise in category plan's working plan version. |
|
Fc Sales U |
Forecasted sales retail units for a specific time period. It is generated in RCM by using AutoES libraries sourced from RDF. AutoES libraries are embedded in RCM. AutoES uses historic data to generate these forecasts. It can be scheduled periodically through batch jobs. |
|
LY Sales U |
Last year's sales retail value (actuals) from the merchandise. |
|
WP Sales var to Fc U |
Variation of sales units in the working plan version of the category plan to the same in the forecast. |
|
WP Sales var to LY U |
Variation of sales units in the working plan version of the category plan to the same in last year's actuals. |
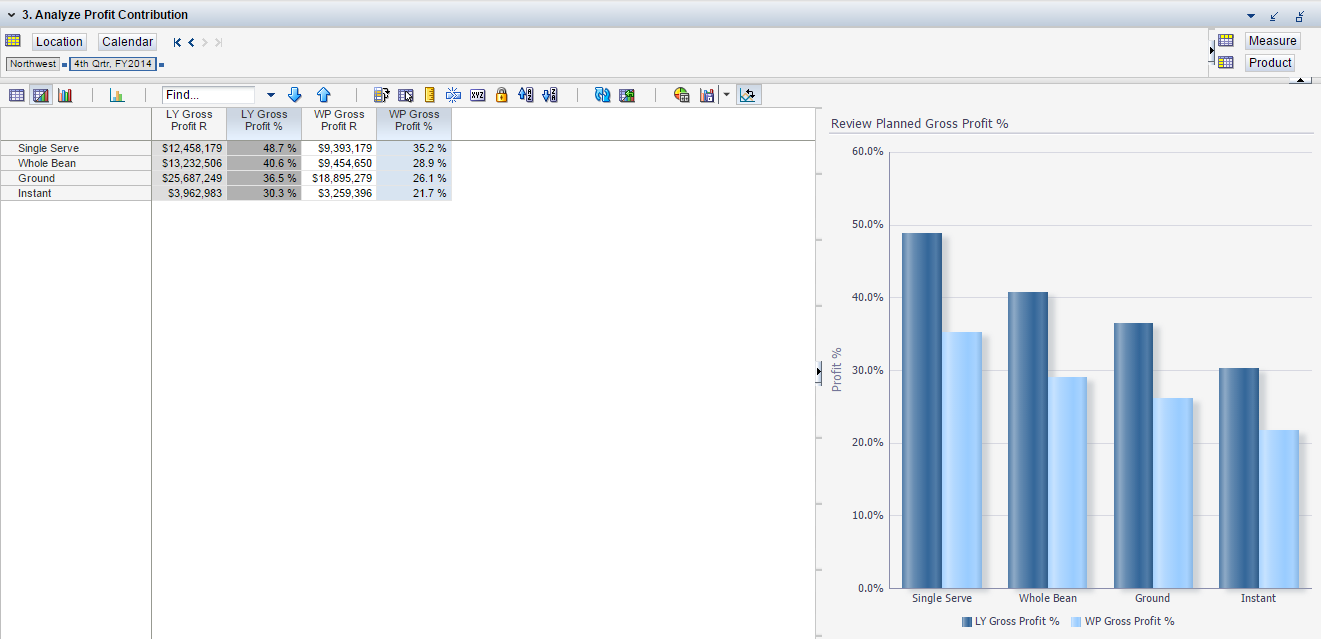
Use this view to determine how each sub-category contributes to the overall margin and profit of the category. This information is best viewed as a scatter chart.
This view exists at the following levels:
Trading Area
Sub-Category
Table 4-10 lists the measures available in this view.
Table 4-10 3. Analyze Profit Contribution Measures
| Label | Definition |
|---|---|
|
LY Gross Profit R |
Last year's gross profit retail value (actuals) from the merchandise. |
|
LY Gross Profit % |
Last year's gross profit percentage from the merchandise. |
|
WP Gross Profit R |
The gross profit retail value from the merchandise in the category plan's working plan version. |
|
WP Gross Profit % |
The gross profit percentage from the merchandise in the category plan's working plan version. |
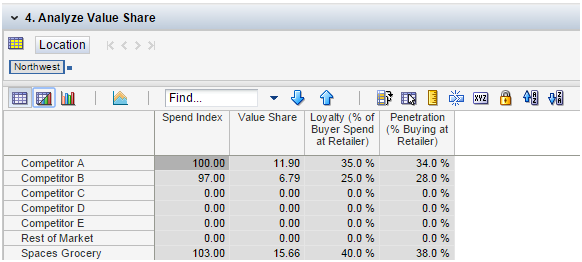
Use this view to analyze the value share. Value share is a measure used to gauge the share of the retailer in the market's overall business by looking at key parameters such as spend index, loyalty, and penetration.
Table 4-11 lists the measures available in this view.
Table 4-11 4. Analyze Value Share Measures
| Label | Definition |
|---|---|
|
Spend Index |
An index value based on the spend percentage of the consumers attracted by the retailer compared to the average spend percentage at the other retailers competing in the market. It is calculated by the index-to-average method. |
|
Value Share |
Value share of the retailer is calculated using the formula: (Penetration) multiplied by (Loyalty Index) multiplied by (Spending Index). |
|
Loyalty (% of Buyer Spend at Retailer)% |
The share of annual category requirements that the consumer is able to satisfy with a single brand (size, type, flavor, and so on). For example, if a consumer makes ten purchases annually in a given category, three of which are made for Brand A, Brand A would have a 30% loyalty, (3/10 = 30%). This measure enables the distributor to discriminate in favor of those items for which targeted consumers have shown a higher loyalty to purchase versus other products within the category. The discontinuation of these products could result in the target consumer leaving the store. Loyalty is converted into an index by comparing (dividing) the loyalty of Brand A by the average loyalty of all brands within the category. Loyalty and the loyalty index can be measured at all levels of data analysis (brand, size, flavor, SKU, and so on). |
|
Penetration (% Buying at Retailer) |
The percent of households buying at the retailer. |
This tab presents cross-category consumer spend analysis at different levels including the overall market level, retailer level, and competitor level. Consumer spend metrics consist of parameters such as Purchase Frequency, Item Penetration, Annual Spend, and so on. It helps the retailer assessing the consumer spending patterns and identifying its target consumer segments.
The following figure shows the initial views displayed for this tab.
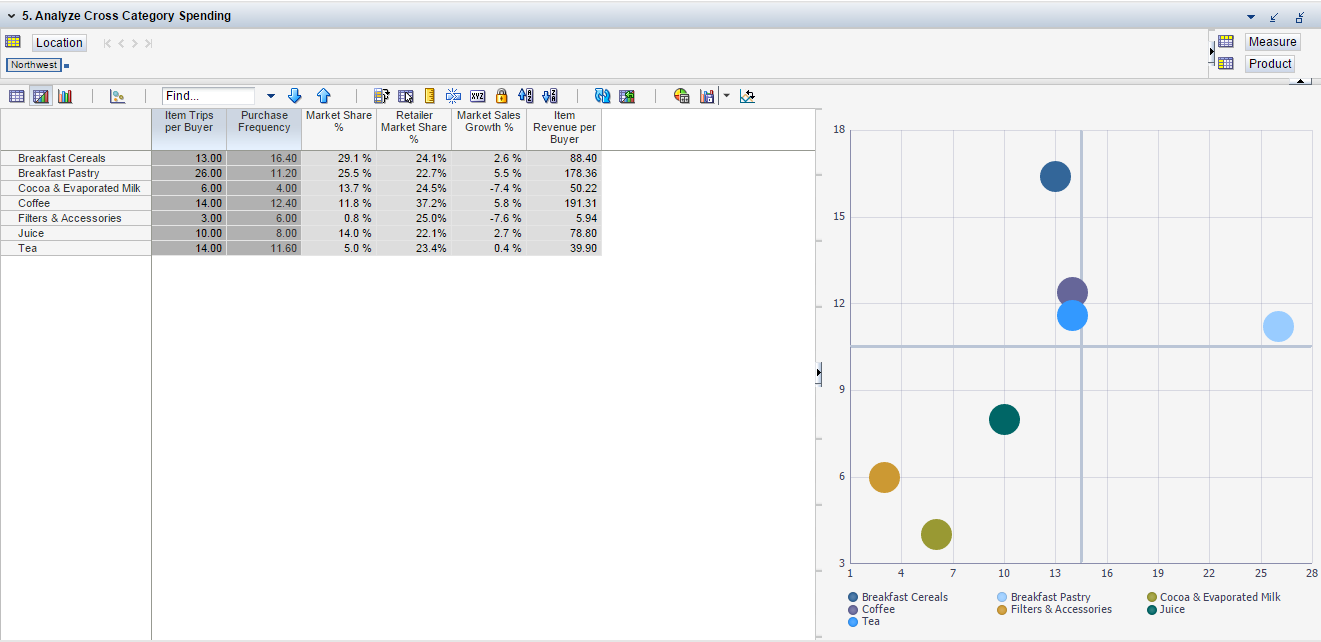
Use this view to analyze which categories are shopped more frequently, have a higher market share, or represent higher market growth compared to other categories for the retailer. This information is best viewed as a bubble chart.
The view exists at the following levels:
Category
Table 4-12 lists the measures available in this view. The measures are loaded from Household Panel data.
Table 4-12 5. Analyze Cross Category Spending Measures
| Label | Definition |
|---|---|
|
Item Trips per Buyer |
The average number of times a customer makes a shopping trip for a particular item/sub-category/category (or a product segment, in general). |
|
Purchase Frequency |
The total number of times an item or an item from a specific product segment such as a sub-category or category is purchased in a given time period (planning period as per the workbook build). It is presented at the sub-category or category level in the application. |
|
Market Share % |
The percentage of market sales generated by a particular product segment towards the overall market sales of the larger product segment to which it maps in the product hierarchy. For example, a sub-category's market sales percentage in the overall market sales retail of the category or the percentage of department's sales generated by a category. |
|
Retailer Market Share % |
The retailer's sales revenue share for a category or sub-category within the market. |
|
Market Sales Growth % |
The percentage increase or decrease in sales retail volume for the entire market compared to the previous time period. |
|
Item Revenue per Buyer |
An item's average retail sales per customer, buyer, or shopper. |
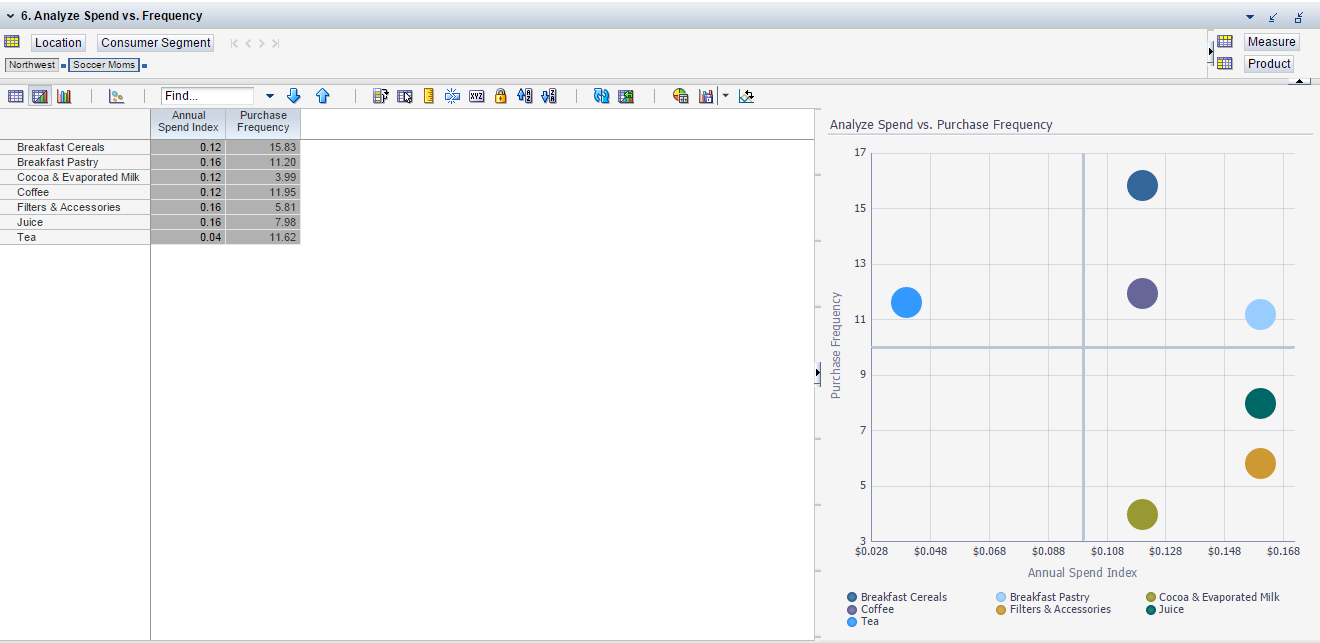
Use this view to identify which categories are important for those customers who shop at the retailer. This information is best viewed as a scatter chart.
This view exists at the following levels:
Consumer Segment
Category
Table 4-13 lists the measures available in this view. The measures are loaded from market scan and retailer data.
Table 4-13 6. Analyze Spend Vs. Frequency Measures
| Label | Definition |
|---|---|
|
Annual Spend Index |
An index indicating the average annual spend on a product category relative to other product categories. It is calculated by an index-to-average method using the spends for different product categories. This measure is presented at the consumer segment level. |
|
Purchase Frequency |
The total number of times an item or an item from a specific product segment such as a sub-category or category is purchased in a given time period (planning period as per the workbook build). It is presented at the sub-category or category level in the application. It can be viewed at the consumer segment level. |
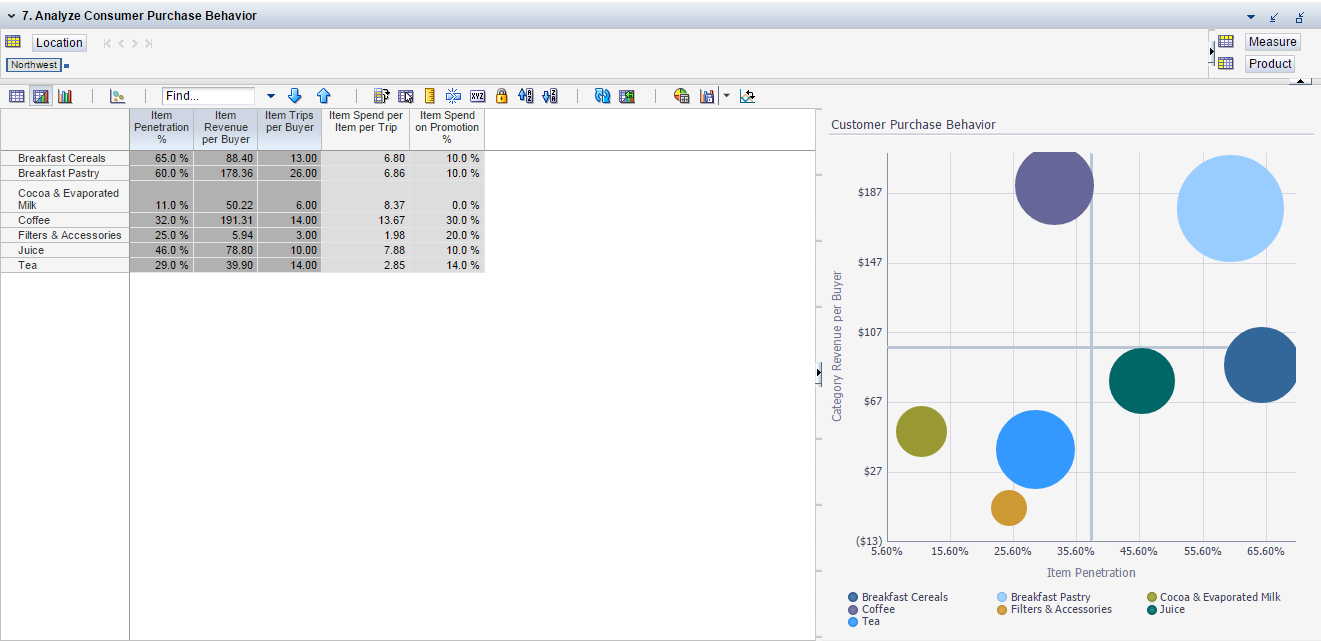
Use this view to analyze consumer purchase behavior across categories.
This view exists at the following levels:
Category
Consumer Segment
Table 4-14 lists the measures available in this view.
Table 4-14 7. Analyze Consumer Purchase Behavior Measures
| Label | Definition |
|---|---|
|
Item Penetration % |
The percentage of households from a trading area (market or region) that purchased an item or an item from a product group (such as a sub-category or a category) at least once within a given time frame. This is presented at the sub-category or category level. |
|
Item Revenue per Buyer |
An item's average retail sales per customer, buyer, or shopper. |
|
Item Trips per Buyer |
The average number of times a customer makes a shopping trip for a particular item or a set of merchandise. |
|
Item Spend per Item per Trip |
An item's retail sales value per customer's trip. |
|
Item Spend on Promotion % |
An item's promotional sales share of the overall retail sales. |
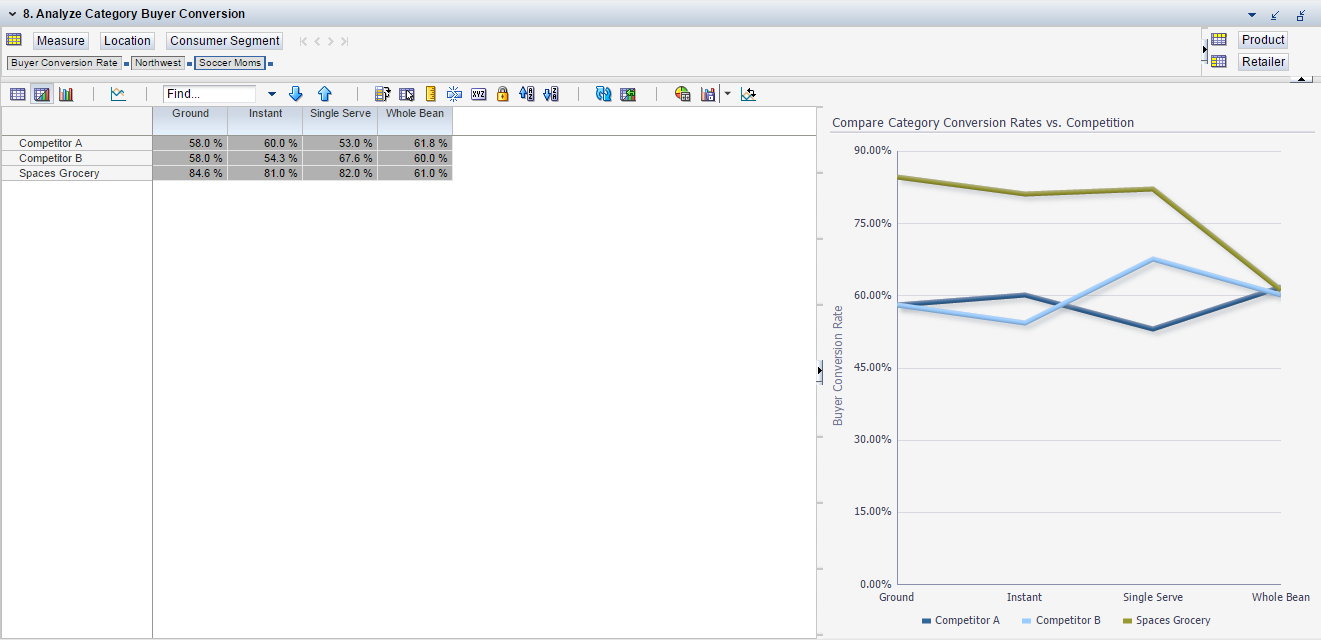
Use this view to compare the percentage of buyer conversion of the retailer with that of named competitors.
This view exists at the following levels:
Category
Retailer, presenting the retailer and its competitors
Consumer Segment
Trading Area
Table 4-15 lists the measure available in this view.
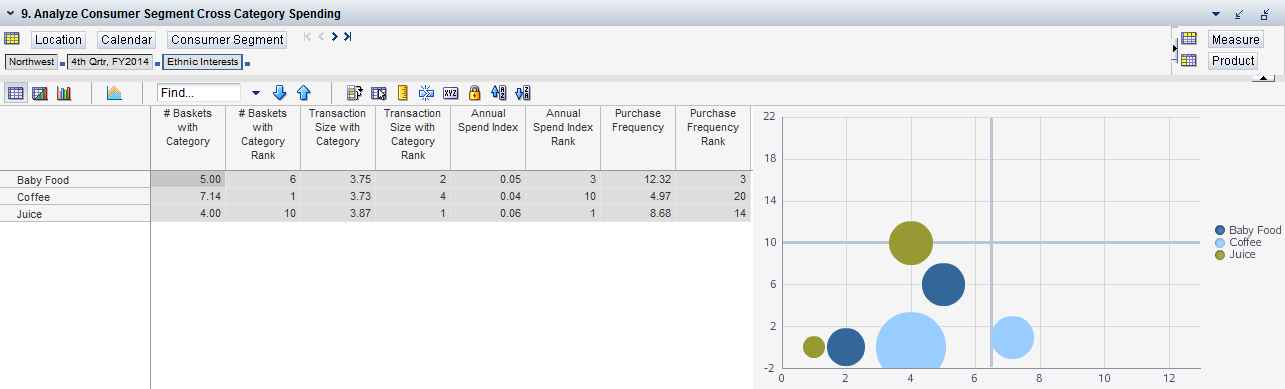
Use this view to determine what is more important for spending to each of the consumer segments. This can be based on market data and retailer data.
The view exists at the following levels:
Category
Quarter
Consumer Segment
Table 4-16 lists the measures available in this view. The measures are loaded from market scan and retailer data.
Table 4-16 9. Analyze Consumer Segment Cross Category Spending Measures
| Label | Definition |
|---|---|
|
# Baskets with Category |
The number of baskets (customer purchases or customer baskets) that contain at least one item from the product category. This measure is available at the consumer segment level. |
|
# Baskets with Category Rank |
An ordinal rank (sequential rank) assigned to a product category based in the # Baskets with Category measure. |
|
Transaction Size with Category |
The average basket share value for a particular product category in a customer's basket. |
|
Transaction Size with Category Rank |
An ordinal rank based on the Transaction Size with Category for a category relative to other product categories. |
|
Annual Spend Index |
An index indicating the average annual spend on a product category relative to other product categories. It is calculated by an index-to-average method using the spends for different product categories. This measure is presented at the consumer segment level. |
|
Annual Spend Index Rank |
An ordinal rank (sequential rank) assigned to a product category based on the Annual Spend Index measure. |
|
Purchase Frequency |
The total number of times an item or an item from a specific product segment such as a sub-category or category is purchased in a given time period (planning period as per the workbook build). It is presented at the sub-category or category level in the application. It can be viewed at the consumer segment level. |
|
Purchase Frequency Rank |
An ordinal rank (sequential rank) based on the purchase frequency. |
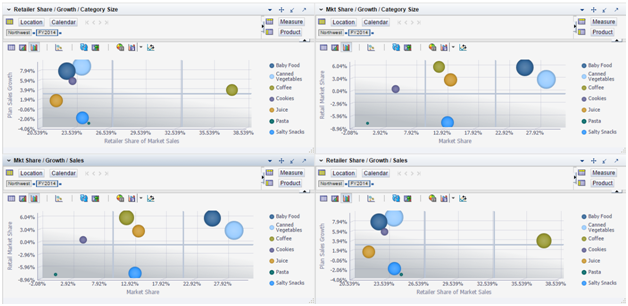
Quadrant Analysis, under this step, presents cross-category quantitative performance analysis of the retailer compared the overall market. It provides quick snapshot views of the retailer's standing compared the market for a category.
This tab has four views. Figure 4-23 shows those views.
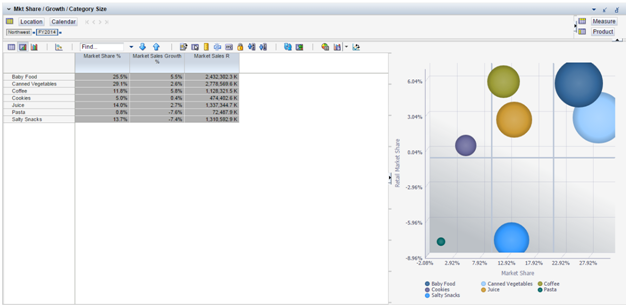
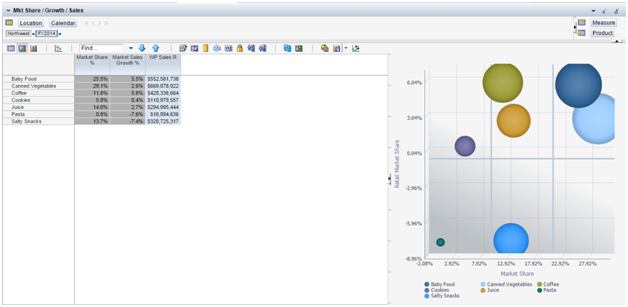
Use this view to analyze market share, growth, and category size. This information is best viewed as a bubble chart.
Table 4-17 lists the measure available in this view. The measure is loaded from market scan and retailer data.
Table 4-17 Mkt Share / Growth / Category Size Measures
| Label | Definition |
|---|---|
|
Market Share % |
The quantum or percentage of sales generated by a particular product or a product segment, such as a sub-category, towards the overall sales retail of the sub-category, category, and so on. |
|
Market Share Growth % |
The rate at which the market sales revenue is growing for a sub-category or category. |
|
Market Sales R |
The sales retail value of the merchandise in the market, typically at the trading area level or above. This information is sourced from third parties providing syndicated data such as Nielsen, IRI, and so on, on a quarterly basis. |
Use this view to analyze market share, growth, and sales. This information is best viewed as a bubble chart.
Table 4-18 lists the measures available in this view. The measures are loaded from market scan and retailer data.
Table 4-18 Mkt Share / Growth / Sales Measures
| Label | Definition |
|---|---|
|
Market Share % |
The quantum or percentage of sales generated by a particular product or a product segment, such as a sub-category, towards the overall sales retail of the sub-category, category, and so on. |
|
Retailer Market Share % |
The retailer's sales retail value share of the overall market for a sub-category or category. |
|
WP Sales R |
Sales retail value from the merchandise in category plan's working plan version. |
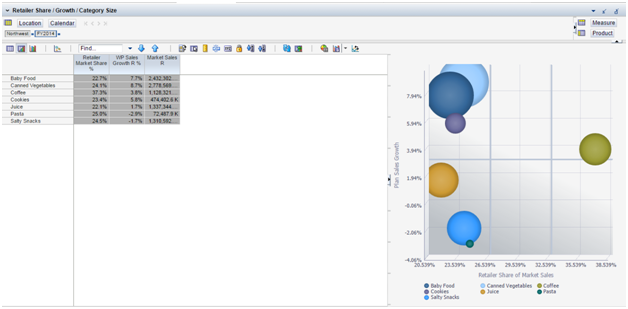
Use this view to analyze retailer share, growth, and category size. This information is best viewed as a bubble chart.
Table 4-19 lists the measures available in this view. The measures are loaded from market scan and retailer data.
Table 4-19 Retailer Share / Growth / Category Size Measures
| Label | Definition |
|---|---|
|
Retailer Market Share % |
The retailer's sales retail value share of the overall market for a sub-category or category. |
|
WP Sales Growth R% |
The working plan's sales retail's growth rate. |
|
Market Sales R |
The sales retail value of the merchandise in the market, typically at the trading area level or above. This information is sourced from third parties providing syndicated data such as Nielsen, IRI, and so on, on a quarterly basis. |
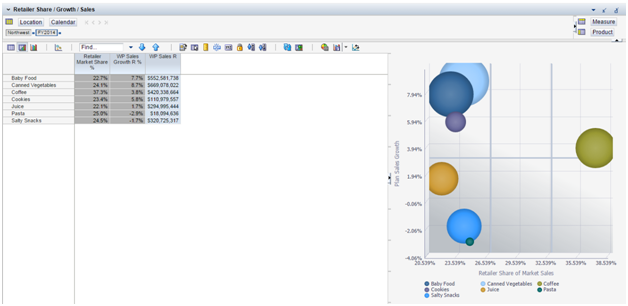
Use this view to analyze retailer share, growth, and sales. This information is best viewed as a bubble chart.
Table 4-20 lists the measures available in this view. The measures are loaded from market scan and retailer data.
Table 4-20 Retailer Share / Growth / Sales Measures
| Label | Definition |
|---|---|
|
Retailer Market Share % |
The retailer's sales retail value share of the overall market for a sub-category or category. |
|
WP Sales Growth R% |
The category plan's sales retail value's growth rate in the working plan version. |
|
WP Sales R |
Sales retail value from the merchandise in category plan's working plan version. |
Roles are assigned at the category level in the product hierarchy.
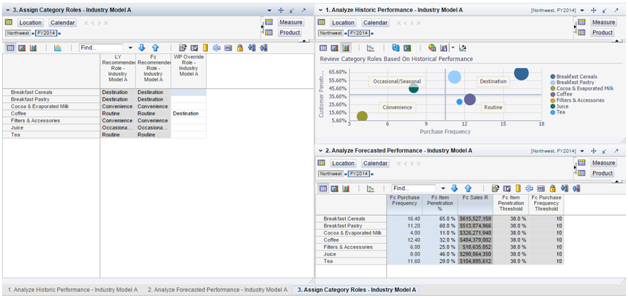
Use this tab to analyze and assign a role to each category, based on Industry Model A. However, it is possible to configure a customized version of this model to meet retailer-specific business requirements that leverage the flexible configuration framework in RPAS. It is important to note that role assignment through this model can be based on either retailer-specific or market-specific data. The expectation is that the category manager leverages insights from upstream analysis and considers the retailer's macro-strategy as well as recommendations from industry models to override, assign, and approve category roles.
This tab presents Model A for category role assignment. Model A assigns a role to a category, based on a consumer perception of a category's importance in the retailer's portfolio of various categories. The consumer perception being referred to does not require individual consumer segment level perceptions; rather, it looks at the overall customer base as a whole.
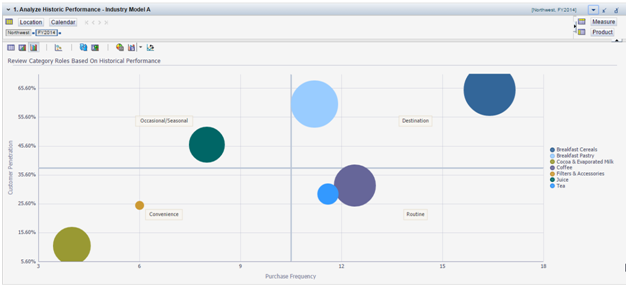
The data required for these analyses that is presented in the first two views is sourced from the retailer's POS (point-of-sale solution) or a third-party syndicate household panel data provider like Nielsen. Forecast data can also be used for role assignment, and it is sourced from RDF and third parties. Model A requires a bubble-chart plot of Item Penetration (on x-axis), Purchase Frequency (on y-axis) for individual categories, and Sales Retail value (on z-axis in the form of bubble-size). Roles are defined based on of the relative position and size of categories on the bubble-chart.
Note that category roles can be assigned on a quarterly basis; however, the examples in the application images present role examples at an yearly level.
Model A requires the following data:
Retailer's POS data
Retailer's forecast data
Household Panel data
Category roles pre-defined in Industry Model A consists of:
Destination
Routine
Occasional / Seasonal
Convenience
Figure 4-28 shows the views for this tab.
Use this view to analyze historical performance for determining category roles, such as the following:
Destination: Destination categories are identified by their high penetration and purchase frequency and large sales revenue. The objective is to be the primary category provider and help define the retailer as the store of choice by delivering consistent value, superior target consumer value.
Routine: Routine categories have low-medium penetration and high purchase frequency and medium sales revenue. The objective of routine category is to be one of the preferred category providers and help develop the retailer as the store of choice by delivering consistent, competitive target consumer value.
Seasonal/Occasional: Seasonal category's objective is to be a major category provider and help reinforce the retailer as the store of choice by delivering frequent, competitive target consumer value.
Convenience: Convenience categories are represented by average-to-low penetration, low purchase frequency, and low sales revenue. The goal of such a category is to be a category provider and help reinforce the retailer as the full-service store of choice by delivering good target consumer value.
This information is best viewed as a bubble chart.
Table 4-21 lists the measures available in this view. The measures are loaded from market scan and retailer data.
Table 4-21 1. Analyze Historic Performance - Industry Model A Measures
| Label | Definition |
|---|---|
|
LY Item Penetration % |
The percentage of the total number of households in a specific market/region/trading area that purchased an item or any merchandise from a category at least once last year (LY) at the retailer or the market as a whole. This data is typically sourced from household panel data provided by third parties such as Nielsen. Note that the item penetration % presented here is in the retailer's business context; it can also be viewed in a market context to derive category roles. |
|
LY Purchase Frequency |
The total number of times an item or an item from a specific product segment such as a sub-category or category has been purchased in last year planning period. It is presented at the sub-category or category level in the application. It can be viewed at the consumer segment level. The total number of times an item or merchandise from a particular category was purchased last year (LY) at the retailer. This data is typically sourced from household panel data provided by third parties such as Nielsen. Note that the purchase frequency presented here is in the retailer's business context; it can also be viewed in a market context to derive category roles. |
|
LY Sales R |
Last year's sales retail value (actuals) from the merchandise. |
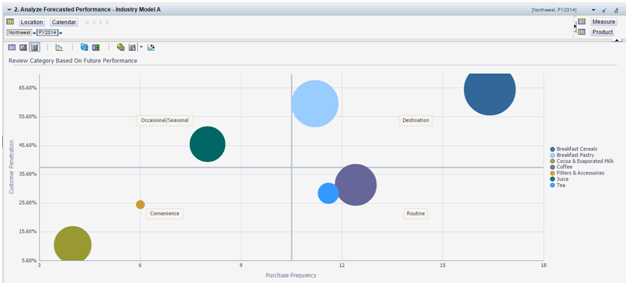
Use this view to analyze forecasted performance for determining category roles. Similar to the Analyze Historic Performance - Industry Model A view, this view plots the charts based on forecasted values for item penetration percentage, purchase frequency, and sales retail value.
This view exists at the following levels:
Consumer Segment
Quarter (lowest level of the calendar hierarchy)
Category
Table 4-22 lists the measures available in this view. The measures are loaded from market scan and retailer data.
Table 4-22 2. Analyze Forecasted Performance - Industry Model A Measures
| Label | Definition |
|---|---|
|
Fc Item Penetration % |
The percentage of households from a specific market/region/trading area that are expected to purchase an item or any merchandise from a product category at least once in the planning period at the retailer. This measure is sourced from a third party, such as Nielsen. Note that the forecasted item penetration % presented here is in the retailer's business context; it can also be viewed in the market context to derive category roles. |
|
Fc Purchase Frequency |
The total number of times an item or an item from a specific product segment such as a sub-category or category is expected to be purchased in a future time period. It is presented at the sub-category or category level in the application. It can be viewed at the consumer segment level. This measure is sourced from a third party, such as Nielsen, or some external system and loaded into RCM. The total number of times an item or merchandise from a particular product category is expected to be purchased in planning period at the retailer. This measure is sourced from a third party such as Nielsen. Note that the forecasted purchase frequency presented here is in the retailer's business context; it can also be viewed in market context to derive category roles. |
|
Fc Sales R |
Forecasted sales retail value for a specific time period. It is generated in RCM by using AutoES libraries sourced from RDF. AutoES libraries are embedded in RCM. AutoES uses historic data to generate these forecasts. It can be scheduled periodically through batch jobs. |
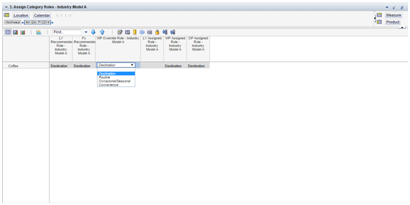
Use this view to assign category roles based on historical and forecasted performance. You are able to override the role recommended by the system. These roles drive the preset weights, which are specified in the Category Management Administration task, to help drive the assortment recommendations that best align with the role.
This view exists at the following level:
Category
Quarter (lowest level of the calendar hierarchy)
Table 4-23 lists the measures available in this view.
Table 4-23 3. Assign Category Roles - Industry Model A Measures
| Label | Definition |
|---|---|
|
LY Recommended Role - Industry Model A |
The role recommended to a category per Industry Model A using last year's actuals for the respective measures. The assignment happens on the basis of the definition of roles previously described. |
|
Fc Recommended Role - Industry Model A |
The role recommended to a category per Industry Model A based on the forecasted data for the respective measures. The assignment happens on the basis of definition of roles previously described. |
|
WP Override Role - Industry Model A |
This measure provides a facility to override the system-recommended role per Industry Model A in the working plan version of the category plan. It has a drop-down list containing a pick list of roles. |
|
LY Assigned Role - Industry Model A |
The role assigned to a category per Industry Model A in last year's category plan. |
|
WP Assigned Role - Industry Model A |
The final role assigned to a category per Industry Model A in the working plan version of the category plan. |
|
OP Assigned Role - Industry Model A |
The final role assigned to the category per Industry Model A in the approved working plan version of the category plan, known as the original plan. |
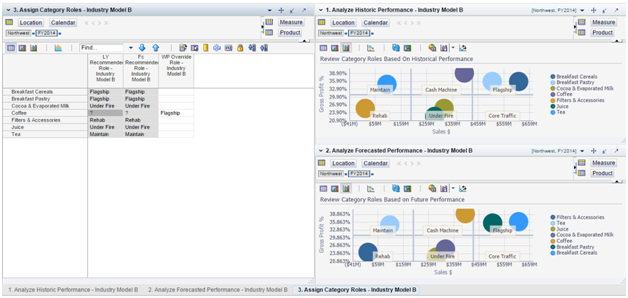
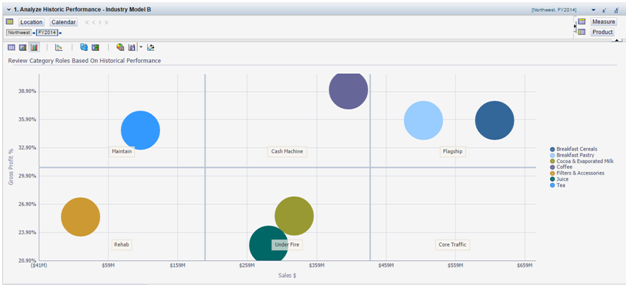
Industry Model B looks at the business generated by a product category from a retailer's point of view trying to assess the relative importance of a product category in the retailer's portfolio of categories. The data required for this analysis comes from the retailer's POS data aggregated to the category level. Model B requires a plot of Sales R and Gross Profit % to derive roles for the respective categories. Roles are defined on the basis of relative positioning of categories on the plot/chart. The data used to derive these roles can be forecast data from a forecasting application (such as RDF) or historic data (actuals) in the form of LY data.
Note that the category roles can be assigned on a quarterly basis; however, the examples in the application images present role examples at an yearly level.
The following data is required:
Retailer's POS data
Retailer's forecast data
Category roles defined using Industry Model B:
Flagship: Flagship categories are identified by their high sales and high gross margin. The objective of such categories is to increase sales and maintain margin or maintain sales and increase margin.
Cash Machine: Cash Machine categories are represented by high sales and medium gross margin. The objective is to increase sales and maintain profits or maintain sales and increase profits.
Maintain: Maintain categories are identified by low sales and high gross margin. The goal is to maintain sales and profits or increase sales and maintain profits.
Core Traffic: Core Traffic categories are represented by high sales and low gross margin. The target is to decrease sales and increase profits or maintain sales and profits.
Under Fire: Under Fire categories have medium sales and low gross margin. The objective is to decrease sales and increase profits or maintain sales and increase profits of such categories.
Rehab: Rehab categories are characterized by low sales and low gross margin the goal is to decrease sales and increase profits.
Figure 4-41 shows the views for this tab.
Use this view to analyze and determine category roles based on historical performance of the categories. The coordinates of a category in the chart form the basis of the assignment of roles to categories. This information is best viewed as a bubble chart.
Table 4-24 lists the measures available in this view. The measures are loaded from market scan and retailer data.
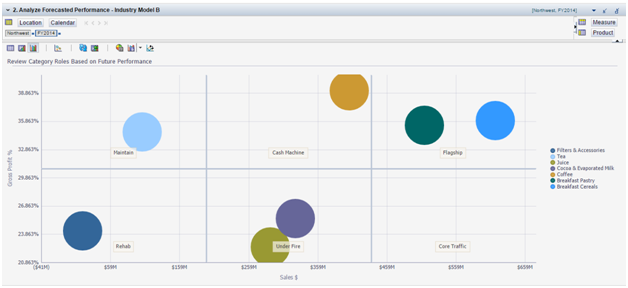
Use this view to analyze forecasted performance for determining category roles. Similar to the Analyze Historic Performance - Industry Model B view, this view provides a facility to determine the roles for a category per Industry Model B based on forecasted data for the respective measures. The coordinates of a category in the chart form the basis of assignment of roles to categories. Six roles are assigned using Industry Model B: Flagship, Cash Machine, Maintain, Core Traffic, Under Fire, and Rehab.
This view exists at the following levels:
Category
Quarter
Table 4-25 lists the measures available in this view. The measures are loaded from market scan and retailer data.
Table 4-25 2. Analyze Forecasted Performance - Industry Model B Measures
| Label | Definition |
|---|---|
|
Fc Sales R |
Forecasted sales retail value for a specific time period. It is generated in RCM by using AutoES libraries sourced from RDF. AutoES libraries are embedded in RCM. AutoES uses historic data to generate these forecasts. It can be scheduled periodically through batch jobs. |
|
Fc Gross Profit % |
The gross profit percentage from the merchandise per the forecast. |
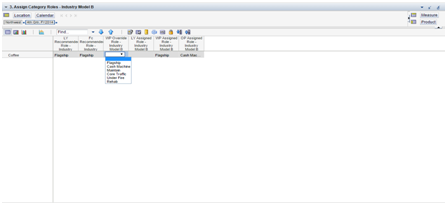
Use this view to assign category roles based on historical and forecasted performance. You can override the role recommended by the system. These roles drive the preset weights, which are specified in the Category Management Administration task, to help drive the assortment recommendations that best align with the role.
This view is a standard table at the following levels:
Category
Quarter (Lowest level of the calendar hierarchy)
Table 4-26 lists the measures available in this view.
Table 4-26 3. Assign Category Roles - Industry Model B Measures
| Label | Description |
|---|---|
|
LY Recommended Role - Industry Model B |
The role recommended to a category per Industry Model B in last year's assortment. |
|
Fc Recommended Role - Industry Model B |
The role recommended to a category per Industry Model B and the forecasted values of respective measures. |
|
WP Override Role - Industry Model B |
An override field giving the user an option to overwrite the category role that is being suggested by Model B that is used for the category role assignment. |
|
LY Assigned Role - Industry Model B |
The role assigned to a category per Industry Model B in last year's category plan. |
|
WP Assigned Role - Industry Model B |
The role assigned to a category per Industry Model B in the working plan. |
|
OP Assigned Role - Industry Model B |
The role assigned to a category in an approved category plan as per Industry Model B. |
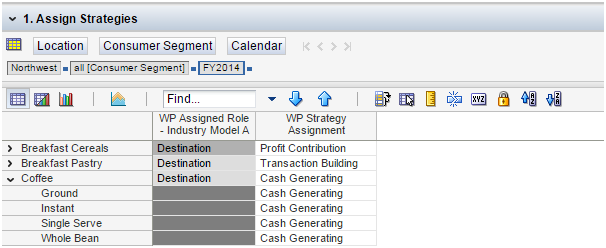
Strategies suggest the overall approach to achieve the required or assigned role to a category. If roles represent the vision of a business unit, then strategies represent the mission of the business unit. Strategies are generally assigned at the sub-category level, but sometimes at the category level as well. Strategies are assigned on the basis of specific analysis of historical or forecast data at a specific consumer segment level or overall consumer segment level. It is important to note here that the user's discretion, as in role assignment, plays an important role in strategy assignment.
It is also important to note that strategies assigned to a product category influence the weights assignment for IPI calculations. A system-recommended assortment can be generated using the IPI-based assortment method in the Assortment Planning tasks. For more details, see Chapter 8 and Chapter 9.
Strategies along with roles, tactics, and category plan targets are shared with assortment planning and MSO tasks. They are used as a reference or a set of guidelines in assortment planning and MSO.
Use this step to evaluate category purchase dynamics and assign appropriate strategies to sub-category/brand. Based on different metrics, define the strategies for each sub-category.
In RCM, strategies are assigned on the basis of specific purchase dynamics' parameters based on industry best practices. The following table summarizes the list of strategies available and the respective purchase dynamics' parameters used to identify them.
Note that strategies at best can be assigned at the quarterly level; however, the examples presented do it on an yearly basis.
Table 4-27 Category Strategies and Purchase Dynamics
| Category Strategy | Purchase Dynamic |
|---|---|
|
Traffic Builder - Attracting customers to the store, aisle, and category |
High share, frequently purchased, high percentage of sales |
|
Transaction Builder - Enlarging the size of the average purchase |
Higher ring-up. impulse purchase |
|
Profit Generating - Yielding profits |
Higher gross margin, higher turns |
|
Cash Generating - Producing cash flow |
Higher turns, frequently purchased |
|
Excitement Creating - Generating interest and enthusiasm among consumers |
Impulse, lifestyle oriented, seasonal |
|
Image Enhancing - Strengthening the view of the retailer held by the customer |
Frequently purchased, highly promoted, impulse, unique items, seasonal |
|
Turf Defending - Positioning the category strongly versus competitors. |
Used by retailers to draw traditional customer base |
The following data is required for defining the strategies in this step:
Retailer's POS data
Predefined category strategies
This step has the following views:
2. Identify Cash Generators View
3. Identify Excitement Generators View
4. Identify Image Enhancer View
5. Identify Profit Generators View
6. Identify Traffic Builders View
7. Identify Transaction Builders View
8. Identify Turf-Defenders View
Use this view to assign strategies based on the relevant performance behavior. Assigning strategies is a key component in calculating IPI values in Assortment Planning. These strategies drive the preset weights, which are specified in the Category Management Administration task, to help drive the assortment recommendations that best align with the category's role.
Roles, strategies, and tactics go hand-in-hand with strategies suggesting the overall approach to sub-categories so as to achieve the role assigned to a category. In a similar manner, tactics are a set of activities planned for sub-categories so that the targeted strategy for them is met.
Table 4-28 lists the measures available in this view.
Table 4-28 1. Assign Strategies Measures
| Label | Definition |
|---|---|
|
LY Strategy Assignment |
A strategy assigned to a category or sub-category in last year's category plan. Strategy represents the overall approach to attain the assigned role to a category. |
|
WP Strategy Assignment |
A strategy assigned to a sub-category or category in the working plan in Category Planning. Strategy represents the overall approach to attain the assigned role to a category. |
|
OP Strategy Assignment |
A strategy assigned to a sub-category or a category in the original plan in Category Planning. Strategy represents the overall approach to attain the assigned role to a category. |
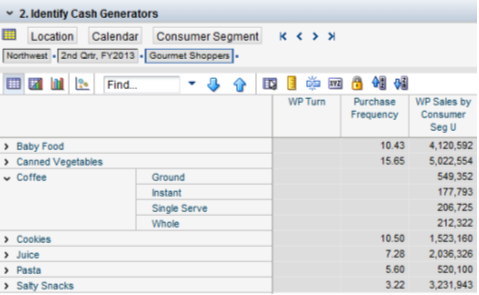
Use this view to plot purchase frequency regarding inventory turns with sales units by consumer segment on the z-axis. This information is best viewed as a bubble chart. Sub-categories, with a large bubble in the top right corner on the bubble chart, qualify for this strategy.
This view exists at the following levels:
Sub-Category (example below presented at the category level)
Consumer Segment (example below presented at all consumer segment level)
Table 4-29 lists the measures available in this view.
Table 4-29 2. Identify Cash Generators Measures
| Label | Definition |
|---|---|
|
WP Turn |
Inventory turns in the working plan version of the category plan. It is the number of times the average inventory carried can be sold over a specified period of time. In other words, it reflects the speed of inventory movement. |
|
Purchase Frequency |
The total number of times an item or an item from a specific product segment such as a sub-category or category is purchased in a given time period. It is presented at the sub-category or category level in the application. It can be viewed at the consumer segment level. |
|
WP Sales by Consumer Seg U |
The sales units contribution by a consumer segment to the overall sales. It is used to identify excitement generating sub-categories in this view. |
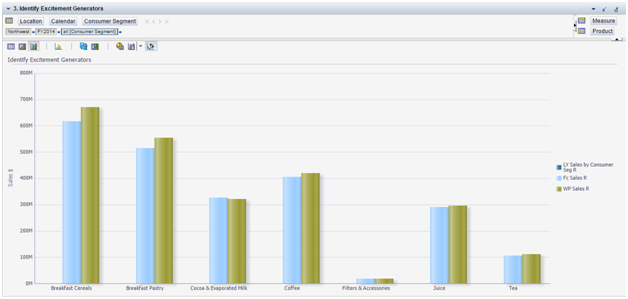
Use this view to plot sales revenue as a trend:
Any sub-category that demonstrates seasonal purchases and is high-impulse and lifestyle-oriented, is flagged as excitement-generating on a scale of excellent versus possible versus poor.
These attributes are not determined systematically. They are left to the discretion and judgement of the business users.
This information is best viewed as a column chart and it is presented at the following levels:
Sub-Category (example below presented at the category level)
Consumer Segment (example below presented at all consumer segment level)
Table 4-30 lists the measures available in this view.
Table 4-30 3. Identify Excitement Generators Measures
| Label | Definition |
|---|---|
|
LY Sales by Consumer Seg R |
The sales retail contribution in percentage points by a consumer segment to the overall sales retail in last year's assortment. |
|
Fc Sales R |
Forecast sales retail value for a specific time period in the future. It is generated in RCM by using AutoES libraries sourced from RDF. AutoES libraries are embedded in RCM. AutoES uses historic data to generate these forecasts. It can be scheduled periodically through batch jobs. |
|
WP Sales by Consumer Seg R |
The sales retail contribution in percentage points by a consumer segment to the overall sales retail in the working plan. It is used to identify excitement generators, a type of strategy assignment, sub-categories in Category Planning. |
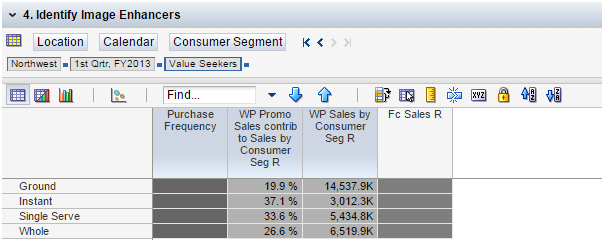
Use this view to perform quadrant analysis to plot purchase-frequency against Promo % (percentage bought on promotion). Sub-categories, in the top right corner, are flagged as an excellent fit and so on. This information is best viewed as a bubble chart.
This view exists at the following levels:
Sub-Category (example below presented at the category level)
Consumer Segment (example below presented at all consumer segment level)
Table 4-31 lists the measures available in this view.
Table 4-31 4. Identify Image Enhancer Measures
| Label | Definition |
|---|---|
|
Purchase Frequency |
The total number of times an item or an item from a specific product segment such as a sub-category or category is purchased in a given time period. It is presented at the sub-category or category level in the application. It can be viewed at the consumer segment level. |
|
Wp Sales by Consumer Seg R |
The sales retail contribution in percentage points by a consumer segment to the overall sales retail in the working plan. |
|
WP Promo Sales contrib to Sales by Consumer Seg R |
The contribution (in percentage points) of promotional sales retail towards the overall sales retail at the consumer segment level. |
|
Fc Sales R |
Forecasted sales retail value for a specific time period. It is generated in RCM by using AutoES libraries sourced from RDF. AutoES libraries are embedded in RCM. AutoES uses historic data to generate these forecasts. It can be scheduled periodically through batch jobs. |
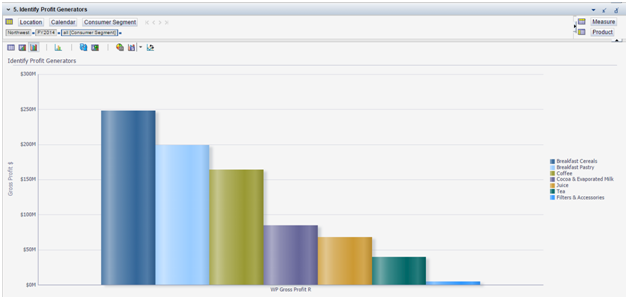
Use this view to plot histograms for the gross profit percentage or gross profit value of each sub-category. Excellent versus possible versus poor are based on predefined thresholds. This information is best viewed as a column chart.This view exists at the following levels:
Sub-Category (example below presented at the category level)
Consumer Segment
Table 4-32 lists the measures available in this view.
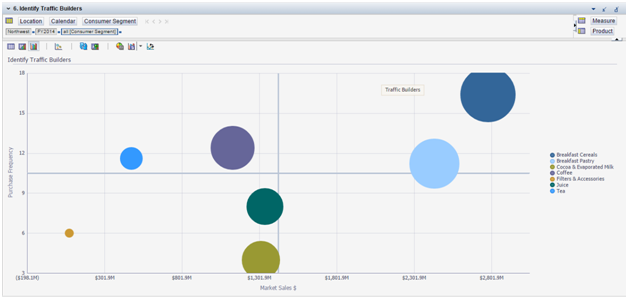
Use this view to create a bubble chart to plot market sales versus purchase frequency:
Sub-categories in the top-right segment and large bubble are considered ideally suited.
Based on fit, categories are classified as excellent, possible, or poor.
This information is best viewed as a bubble chart.This view exists at the following levels:
Sub-Category (example below presented at the category level)
Consumer Segment
Table 4-33 lists the measures available in this view.
Table 4-33 6. Identify Traffic Builders Measures
| Label | Definition |
|---|---|
|
WP Sales contrib to Market Sales by Consumer Seg R |
Category Planning Working Plan Sales contribution to Market Sales by Consumer Segment Retail Percent. |
|
Purchase Frequency |
The total number of times an item or an item from a specific product segment such as a sub-category or category is purchased in a given time period. It is presented at the sub-category or category level in the application. |
|
WP Sales by Consumer Seg R |
The sales retail contribution in percentage points by a consumer segment to the overall sales retail in the working plan. It is used to identify excitement generators, a type of strategy assignment, sub-categories in Category Planning. |
|
Fc Sales R |
Forecasted sales retail value for a specific time period. It is generated in RCM by using AutoES libraries sourced from RDF. AutoES libraries are embedded in RCM. AutoES uses historic data to generate these forecasts. It can be scheduled periodically through batch jobs. |
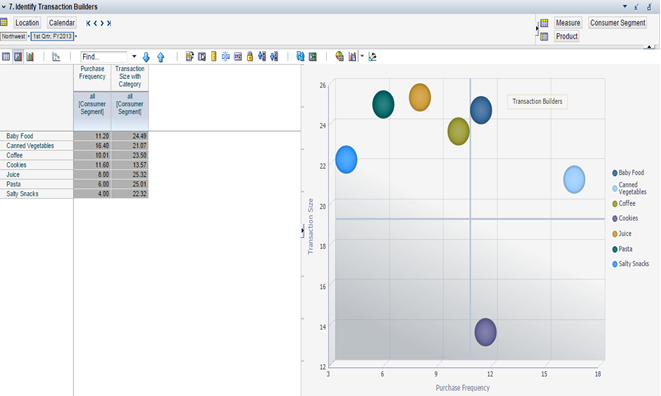
Use this view to create a bubble chart to plot shopping frequency versus basket value. Sub-categories, with a large bubble in the top right corner, qualify for this strategy. This information is best viewed as a scatter chart.This view exists at the following levels:
Category
Consumer Segment
Table 4-34 lists the measures available in this view.
Table 4-34 7. Identify Transaction Builders Measures
| Label | Definition |
|---|---|
|
Purchase Frequency |
The total number of times an item or an item from a specific product segment such as a sub-category or category is purchased in a given time period. It is presented at the sub-category or category level in the application. It can be viewed at the consumer segment level. |
|
Transaction Size with Category |
The average basket share value for a particular product category in a customer's basket. |
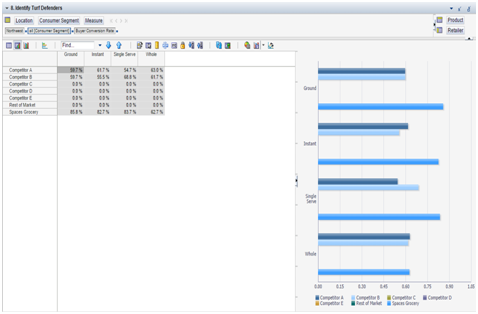
Use this view to plot the retailer's buyer conversion rates against that of the competition. Any sub-categories where the retailer is lagging may be flagged as potentially turf-defending. This information is best viewed as a column chart.
This view exists at the following levels:
Sub-category
Retailer, representing the retailer and its competitors
Consumer Segment
Table 4-35 lists the measure available in this view.
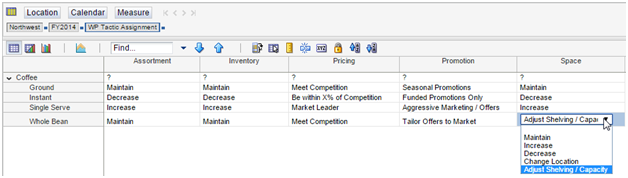
Tactics are a set of activities used to attain the set strategy to a sub-category/category. Tactics are assigned at the sub-category level in a product hierarchy.
If the role to a category is a vision to a business unit and strategy is like a mission to the business unit, then tactics are set of goals to be put to action. They are key guidelines to derive an assortment plan.
Tactics, along with roles, strategies, tactics, and category plan targets, are shared with assortment planning and MSO. They are used as a reference or a set of guidelines in assortment planning and MSO.
Use this step to assess the business from an assortment, space, price, promotion, and inventory perspective. The analytics within this step enable retailers to identify and prioritize opportunities. This step is also used to assign tactics, view historical tactics, and seed tactics from historical views. Tactics are assigned for each of the tactical areas per the sub-category and trading area. There are five tactical areas:
Assortment
Inventory
Pricing
Promotion
Space
Other than category tactics assignment, this step provides analyses, which answer the key questions such as:
How does pricing compare to the competition?
How does promotional activity compare?
What is the average movement of merchandise at the week level?
What are the returns on space in the form of sales and gross profit?
The following data is required for this task:
Market scan data
Micro and macro space data
Pricing data
This step has the following tabs and views:
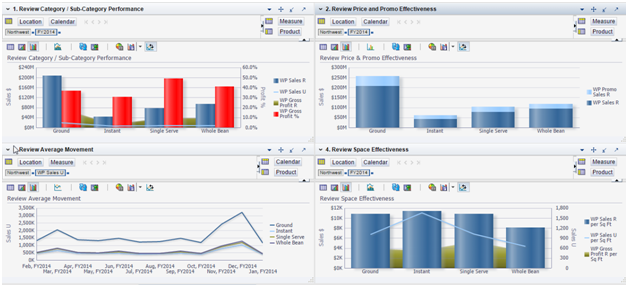
Review Category Performance to Role Tab:
1. Review Category / Sub-Category Performance View
2. Review Price and Promo Effectiveness View
This tab is used to review category performance. Figure 4-44 shows the views for this tab.
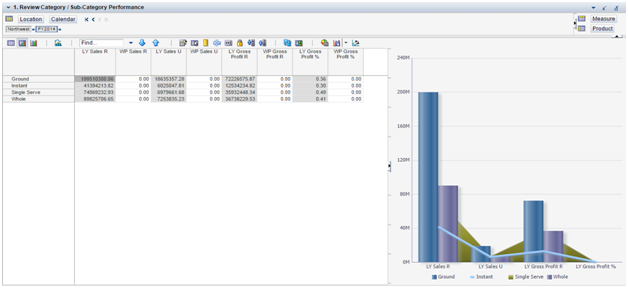
Use this view to review the performance of the assortment.
Table 4-36 lists the measures available in this view.
Table 4-36 1. Review Category / Sub-Category Performance Measures
| Label | Definition |
|---|---|
|
LY Sales R |
Last year's sales retail value (actuals) from the merchandise. |
|
WP Sales R |
Sales retail value from the merchandise in category plan's working plan version. |
|
LY Sales U |
Last year's sales retail value (actuals) from the merchandise. |
|
WP Sales U |
Sales units from the merchandise in category plan's working plan version. |
|
LY Gross Profit R |
Last year's gross profit retail value (actuals) from the merchandise. |
|
WP Gross Profit R |
The gross profit retail value from the merchandise in category plan's working plan version. |
|
LY Gross Profit % |
Last year's gross profit percentage from the merchandise. |
|
WP Gross Profit % |
The gross profit percentage from the merchandise in category plan's working plan version. |
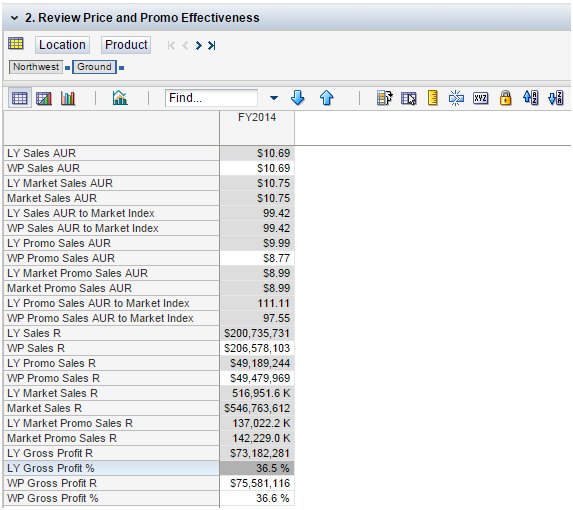
Use this view to determine how base pricing compares to promotional pricing for the retailer and market. This helps to identify whether the retailer regular sales and promotional sales spread is comparable to or different from the market.
The view exists at the following levels:
Sub-category
Trading Area
Quarter (lowest level on calendar hierarchy)
Table 4-37 lists the measures available in this view.
Table 4-37 2. Review Price and Promo Effectiveness Measures
| Label | Definition |
|---|---|
|
LY Sales AUR |
Last year's actual average unit retail value of a SKU. It reflects the average selling price of a SKU at a specific product hierarchy level based on last year's actual sales. |
|
WP Sales AUR |
Average unit retail value for an item (all items included) in a working plan version of the category plan. It reflects the average selling price of a SKU at different product hierarchy levels in the working plan assortment. |
|
LY Market Sales AUR |
Last year's average unit retail value of the merchandise calculated from market sales actuals (typically for a trading area). It is typically sourced from third parties providing syndicated data such as Nielsen, IRI, and so on, on a quarterly basis. |
|
Market Sales AUR |
Average unit retail value of the merchandise calculated from market sales actuals (typically for a trading area). It is typically sourced from third parties providing syndicated data such as Nielsen, IRI, and so on, on a quarterly basis. |
|
LY Sales AUR to Market Index |
An index value based on the ratio of retail sales' Average Unit Retail to market sales' Average Unit Retail for last year's assortment. |
|
WP Sales AUR to Market Index |
An index value based on the ratio of Retail Sales' Average Unit Retail to Market Sales' Average Unit Retail for the working plan assortment. |
|
LY Promo Sales AUR |
The average unit retail value for the promotional sales in a last year's assortment. |
|
WP Promo Sales AUR |
The average unit retail value for the promotional sales in a working plan assortment. |
|
LY Market Promo Sales AUR |
Average Unit Retail for the promotional sales in Last Year's Plan. This data is sourced from third-party syndicate data suppliers. |
|
Market Promo Sales AUR |
Average unit retail value of a SKU based on promotional sales actuals in the market as a whole (typically trading area). It is typically sourced from third parties providing syndicated data such as Nielsen, IRI, and so on, on a quarterly basis. |
|
LY Promo Sales AUR to Market Index |
An index value based on the ratio of promotional sales' Average Unit Retail to Market Sales Average Unit Retail for last year's assortment. |
|
WP Promo Sales AUR to Market Index |
An index value based on the ratio of Promotional Sales' Average Unit Retail to Market Sales Average Unit Retail for the working plan assortment. |
|
LY Sales R |
Sales retail value, for a category or sub-category, per last year's actuals. |
|
WP Sales R |
Sales retail value from the merchandise in category plan's working plan version. |
|
LY Promo Sales R |
Last year's sales retail value (actuals) from the merchandise. |
|
WP Promo Sales R |
Promotional sales retail in the working plan version of the category plan. |
|
LY Market Sales R |
Last year's sales retail value of the merchandise in the market, typically at the trading area level or above. This information is sourced from third parties providing syndicated data such as Nielsen, IRI, and so on, on a quarterly basis. |
|
Market Sales R |
The sales retail value of the merchandise in the market, typically at the trading area level or above. This information is sourced from third parties providing syndicated data such as Nielsen, IRI, and so on, on a quarterly basis. |
|
LY Market Promo Sales R |
Last year's promotional sales retail for the market, typically at the trading area level or above. This information is sourced from third parties providing syndicated data such as Nielsen, IRI, and so on, on a quarterly basis. |
|
Market Promo Sales R |
Promotional sales retail for the market, typically at the trading area level or above. This information is sourced from third parties providing syndicated data such as Nielsen, IRI, and so on, on a quarterly basis. |
|
LY Gross Profit R |
Last year's gross profit retail value (actuals) from the merchandise. |
|
LY Gross Profit % |
Last year's gross profit percentage from the merchandise. |
|
WP Gross Profit R |
The gross profit retail value from the merchandise in the category plan's working plan version. |
|
WP Gross Profit % |
The gross profit percentage from the merchandise in the category plan's working plan version. |
This view is related to promotional effectiveness and shows the sales units for a category over time. It can be used to identify and review seasonality. This information is best displayed as a line chart.
Table 4-38 lists the measure available in this view.
Use this view to review the effectiveness of the planned space. The measure information in this view must be sourced from a space planning solution like MSM or BI solution like RA.
Table 4-39 lists the measures available in this view.
Table 4-39 4. Review Space Effectiveness Measures
| Label | Definition |
|---|---|
|
Total Square Footage |
The total store selling space, expressed in square feet, allocated to a sub-category or a category. |
|
Total #of Facings |
The number of facings allocated to a sub-category or a category in the store layout. |
|
Total Shelf Capacity |
The total quantity of a sub-category's or a category's merchandise that can fit into the overall space allocated to it. |
|
WP Sales R per Sq Ft |
The working plan assortment's sales retail return per square feet. It is calculated by dividing sales retail value by the area (or space in square feet) allocated to that particular merchandise. |
|
WP Sales U per Sq Ft |
The working plan assortment's sales units return per square feet. It is calculated by dividing sales units from the merchandise by the area (or space in square feet) allocated to that particular merchandise. |
|
WP Gross Profit R per Sq Ft |
The gross profit retail return per square feet from the merchandise in the working plan assortment. It is calculated by dividing Gross Profit Retail Value from the merchandise by the area (or space, in square feet) allocated to the merchandise. |
|
WP Sales contrib to Total Category R |
The contribution, in percentage points, of a sub-category's sales retail value to the overall category sales retail value. |
|
WP Sales contrib to Total Category U |
The contribution, in percentage points, of a sub-category's units' value to the overall category sales units value. |
|
WP Gross Profit contrib to Total Category R |
The percentage contribution of a sub-category to category's gross profit retail. |
This tab is used to assign category tactics.
Use this view to assign tactics for each of the tactical areas per category, market, and consumer segment. Depending upon the role and strategy assigned to product category and sub-category, tactics are assigned.
Tactics are a set of actions to be implemented to achieve the set role and strategy. These actions are assigned specific to sub-category and can be in the form of assortment or product-mix changes, inventory-holding, pricing of products, type of promotions to be run, and the space that needs to be allocated. A thorough implementation of tactics determines the alignment of a sub-category to the role and strategy assignment and the overall category plan of the retailer.
Table 4-40 lists the measure available in this view.
Table 4-40 Assign Category Tactic Measure
| Label | Definition |
|---|---|
|
WP Tactic Assignment |
Used to assign the tactics' value to a sub-category with due consideration to roles and strategies assigned at the respective category and sub-category level. Tactics reflect an action or an approach that must be implemented for a sub-category in the planning period in terms of assortment range, inventory levels, pricing, promotion, space, and so on. |
This is the final step in the Category Planning task and it consists of setting the final targets in terms of various retail business measures (such as sales, gross profit, and inventory parameters) at the category and sub-category level and approving them. On approval, the category plan is shared with assortment planning and the MSO task in the form of target (Tgt) measures. In Category Planning, the final plan is stored as an Original Plan (OP). These final targets are further defined as Private Label Targets and Promo Sales Targets.
This step also contains a dashboard view to see performance against targets and LY data during in-season and pre-season planning periods. This step also provides a facility to initially seed the category plan sales using LY data using the Seed Sales custom menu option. Use this step to derive the final category plan.
This step contains the following tabs and views:
Set Sales and Profit Targets Tab:
1. Set Sales and Profit Targets View
This step also contains the following custom menu option options:
Seed Sales
Approve OP
This step has one view, Scorecard Summary. Use this view to see the summary of the scorecard.
The Scorecard Summary view also contains three measure profiles:
Sales
Promo Sales
Private Label
Table 4-41 lists the measures available in the Sales Measure Profile View.
Table 4-41 Scorecard Summary Sales Measure Profile Measures
| Label | Definition |
|---|---|
|
LY Sales R |
Last year's sales retail value (actuals) from the merchandise. |
|
WP Sales R |
Sales retail value from the merchandise in category plan's working plan version. |
|
WP Sales var to LY R |
The working plan's sales retail value's variance to the same in last year's actuals. |
|
OP Sales R |
Approved category plan's (referred to as original plan) sales retail value. It is shared as a target with assortment planning and MSO. |
|
OP Sales var to LY R |
The original plan's sales retail value's variance to the same in last year's actuals. |
|
LY Gross Profit R |
Last year's gross profit retail value (actuals) from the merchandise. |
|
LY Gross Profit % |
Last year's gross profit percentage from the merchandise. |
|
WP Gross Profit R |
The gross profit retail value from the merchandise in category plan's working plan version. |
|
WP Gross Profit % |
The gross profit percentage from the merchandise in category plan's working plan version. |
|
WP Gross Profit var to LY R |
The working plan's gross profit retail value's variance to last year's gross profit retail value actuals. |
|
OP Gross Profit R |
Approved category plan's (referred to as original plan) gross profit retail value. It is shared as a target with assortment planning and MSO. |
|
OP Gross Profit % |
Approved category plan's (referred to as original plan) gross profit percentage. It is shared as a target with assortment planning and MSO. |
|
OP Gross Profit var to LY |
The original plan's gross profit value's variance to the same in last year's actuals. |
|
LY Avg Inv R |
Average inventory retail value or stock retail value carried by the category or sub-category per last year's actuals. Average inventory retail value represents an average retail value of merchandise bought, received, and carried by the retailer before it gets sold at any point in time. This average inventory retail value is generally calculated on a weekly basis or a monthly basis to get an understanding of the money invested in inventory or buying merchandise. |
|
WP Avg Inv R |
Average inventory retail value to be carried by a category or sub-category in given planning period per the category plan's working plan version. |
|
OP Avg Inv R |
Average inventory retail value to be carried by a category or sub-category per the approved category plan or the original plan. |
|
LY Turn |
Inventory turns in last year's assortment. It reflects the number of times the carried inventory was sold in an LY time period. |
|
WP Turn |
Inventory turns in the working plan version of the category plan. It is the number of times the average inventory carried can be sold over a specified period of time. In other words, it reflects the speed of inventory movement. |
|
OP Turn |
Inventory turns in the original plan. It reflects the number of times the carried inventory can be rolled over in a specified period of time. |
Table 4-42 lists the measures available in the Promo Sales Measure Profile View.
Table 4-42 Scorecard Summary Promo Sales Measure Profile Measures
| Label | Definition |
|---|---|
|
LY Sales R |
Last year's sales retail value (actuals) from the merchandise. |
|
WP Sales R |
Sales retail value from the merchandise in category plan's working plan version. |
|
WP Sales var to LY R |
The working plan's sales retail value's variance to the same in last year's actuals. |
|
OP Sales R |
Approved category plan's (referred to as original plan) sales retail value. It is shared as a target with assortment planning and MSO. |
|
OP Sales var to LY R |
The original plan's sales retail value's variance to the same in last year's actuals. |
|
LY Promo Sales R |
Last year's promotional sales retail value actuals. |
|
LY Promo Sales contrib to LY R |
Promotional sales retail contribution, in percentage points, to the overall sales retail of last year's assortment. |
|
WP Promo Sales R |
Promotional sales retail in the working plan version of the category plan. |
|
WP Promo Sales contrib to WP Sales R |
The promotional sales retail contribution, in percentage points, to the overall sales retail of the working plan assortment. |
|
WP Promo Sales var to LY R |
The working plan's promotional sales retail value's variance to the same in last year plan's actuals. |
|
OP Promo Sales R |
Promotional sales retail in the original plan assortment. |
|
OP Promo Sales contrib to OP Sales R |
The original plan's promotional sales retail value's variance to the same in last year plan's actuals. |
|
OP Promo Sales var to LY R |
The original plan's promotional sales retail value's variance to the same in last year's actuals. |
|
LY Gross Profit R |
Last year's gross profit retail value (actuals) from the merchandise. |
|
LY Gross Profit % |
Last year's gross profit percentage from the merchandise. |
|
WP Gross Profit R |
The gross profit retail value from the merchandise in category plan's working plan version. |
|
WP Gross Profit % |
The gross profit percentage from the merchandise in category plan's working plan version. |
|
WP Gross Profit var to LY R |
The working plan's gross profit retail value's variance to last year's gross profit retail value actuals. |
|
OP Gross Profit R |
Approved category plan's (referred to as original plan) gross profit retail value. It is shared as a target with assortment planning and MSO. |
|
OP Gross Profit % |
Approved category plan's (referred to as original plan) gross profit percentage. It is shared as a target with assortment planning and MSO. |
|
OP Gross Profit var to LY |
The original plan's gross profit value's variance to the same in last year's actuals. |
Table 4-43 lists the measures available in the Private Label Measure Profile View.
Table 4-43 Scorecard Summary Private Label Measure Profile Measures
| Label | Definition |
|---|---|
|
LY Sales R |
Last year's sales retail value (actuals) from the merchandise. |
|
WP Sales R |
Sales retail value from the merchandise in category plan's working plan version. |
|
WP Sales var to LY R |
The working plan's sales retail value's variance to the same in last year's actuals. |
|
OP Sales R |
Approved category plan's (referred to as original plan) sales retail value. It is shared as a target with assortment planning and MSO. |
|
OP Sales var to LY R |
The original plan's sales retail value's variance to the same in last year's actuals. |
|
LY Private Label Sales R |
Sales retail value from private label merchandise, for a category or sub-category, per last year's actuals. |
|
LY Private Label Sales contrib to LY Sales R |
Sales retail contribution of private label items to the overall sales retail of last year's assortment expressed in percentage points. |
|
WP Private Label Sales R |
The private label items' sales retail value in a working plan assortment. |
|
WP Private Label Sales contrib to WP Sales R |
The sales retail contribution of private label items to the overall sales retail of the working plan assortment expressed in percentage points. |
|
WP Private Label Sales var to LY R |
The working plan's private label items' sales retail variance to the same in last year plan's actuals. |
|
OP Private Label Sales R |
The private label items' sales retail value in the pre-season original plan assortment. |
|
OP Private Label Sales contrib to OP Sales R |
The original plan's private label sales retail value's contribution to the overall sales retail value in the original plan. |
|
OP Private Label Sales var to LY R |
The original plan's private label items' sales retail variance to the same in last year plan's actuals. |
|
LY Gross Profit R |
Last year's gross profit retail value (actuals) from the merchandise. |
|
LY Gross Profit % |
Last year's gross profit percentage from the merchandise. |
|
WP Gross Profit R |
The gross profit retail value from the merchandise in category plan's working plan version |
|
WP Gross Profit % |
The gross profit percentage from the merchandise in category plan's working plan version. |
|
WP Gross Profit var to LY R |
The working plan's gross profit retail value's variance to last year's gross profit retail value actuals. |
|
OP Gross Profit R |
Approved category plan's (referred to as original plan) gross profit retail value. It is shared as a target with assortment planning and MSO. |
|
OP Gross Profit % |
Approved category plan's (referred to as original plan) gross profit percentage. It is shared as a target with assortment planning and MSO. |
|
OP Gross Profit var to LY |
The original plan's gross profit value's variance to the same in last year's actuals. |
|
LY Private Label Gross Profit R |
Gross profit retail of private label items in a last year's assortment for the cluster. |
|
LY Private Label Gross Profit % |
Gross profit percentage of private label items in last year's assortment for the cluster. |
|
WP Private Label Gross Profit R |
The gross profit retail of private label items in a working plan version of the category plan. |
|
WP Private Label Gross Profit % |
The gross profit percentage of private label items in a working plan version of the category plan. |
|
WP Private Label Gross Profit var to LY R |
Variance of private label merchandise's gross profit retail value in the working plan version of the category plan to the same in last year's actuals. |
|
OP Private Label Gross Profit R |
Gross profit retail value from private label merchandise in approved category plan (Original Plan). |
|
OP Private Label Gross Profit % |
Gross profit percentage from private label merchandise in approved category plan (Original Plan). |
|
OP Private Label Gross Profit var to LY |
Variance of private label merchandise's gross profit retail value in approved category plan (Original Plan) to the same in last year's actuals. |
This tab is used to seed and review plan sales.
The Seed Sales custom menu is used to populate the WP version of the category plan with LY data. LY sales data is copied to the respective WP Sales Units and Sales Retail measures.
Use this view to review LY Sales against the WP Sales. However, WP Sales are set only in the next few views. This view presents LY and WP measures for Sales U and Sales R at the overall sales level, Private Label level and Promo Sales level.
Table 4-44 lists the measures available in this view.
Table 4-44 Review Sales Measures
| Label | Definition |
|---|---|
|
LY Sales R |
Last year's sales retail value (actuals) from the merchandise. |
|
LY Sales U |
Last year's sales retail value (actuals) from the merchandise. |
|
LY Private Label Sales R |
Sales retail value from private label merchandise, for a category or sub-category, per last year's actuals. |
|
LY Private Label Sales U |
Sales units from private label merchandise in last year's actuals. |
|
LY Promo Sales R |
Last year's promotional sales retail value actuals. |
|
LY Promo Sales U |
Promotional sales units in last year's assortment. |
Use this view to seed the initial WP plan with LY plan used to derive the final category plan as an Original Plan (OP).
Table 4-45 lists the measures available in this view.
Table 4-45 Seed Sales Measures
| Label | Definition |
|---|---|
|
WP Seed Sales |
A Boolean measure, at the category level, which needs to be checked before running the Seed Sales custom menu to populate the Category Plan with LY data for the required categories. |
|
WP Seed Sales Comments |
Free text field available to the user to add comments while seeding sales. |
|
WP Seed Sales Date |
The date on which sales were seeded. |
|
WP Seed Sales By |
The user ID that was used to seed sales. |
This tab has three views:
1. Set Sales and Profit Targets View
2. Set Promo Sales Targets View
3. Set Private Label Targets View
Use this view to set the sales and profit targets at the category level.
Table 4-46 lists the measures available in this view.
Table 4-46 1. Set Sales and Profit Targets Measures
| Label | Definition |
|---|---|
|
FC Sales R |
Forecasted sales retail value for a specific time period. It is generated in RCM by using AutoES libraries sourced from RDF. AutoES libraries are embedded in RCM. AutoES uses historic data to generate these forecasts. It can be scheduled periodically through batch jobs. |
|
WP Sales R |
Sales retail value from the merchandise in category plan's working plan version. |
|
LY Sales R |
Last year's sales retail value (actuals) from the merchandise. |
|
WP Sales var to LY R |
The working plan's sales retail value's variance to the same in last year's actuals. |
|
WP Sales var to Fc R |
The working plan's sales retail value's variance to the same in the forecast. |
|
LY Sales contrib to Product R |
The contribution percentage of a sub-category's sales retail to the category's (or higher level product hierarchy) overall sales retail in last year's assortment. |
|
WP Sales contrib to Product R |
The sales retail contribution percentage of a specific set of merchandise to a category's (or higher level product hierarchy) overall sales retail in the working plan assortment. |
|
LY Sales contrib to Location R |
The sales retail contribution percentage of a specific set of merchandise to a location's (on the location hierarchy) overall sales retail in last year's assortment. |
|
WP Sales contrib to Location R |
The sales retail contribution percentage of a specific set of merchandise to a location's (on the location hierarchy) overall sales retail in the working plan assortment. |
|
LY Sales U |
Last year's sales retail value (actuals) from the merchandise. |
|
LY Sales AUR |
Last year's actual average unit retail value of a SKU. It reflects the average selling price of a SKU at a specific product hierarchy level based on last year's actual sales. |
|
WP Sales U |
Sales units from the merchandise in category plan's working plan version |
|
WP Sales AUR |
Average unit retail value for an item (all items included) in a working plan version of the category plan. It reflects the average selling price of a SKU at different product hierarchy levels in the working plan assortment. |
|
WP Sales Var to LY U |
The working plan's sales units' variance to the same in last year's actuals. |
|
Fc Sales U |
Forecasted sales retail units for a specific time period. It is generated in RCM by using AutoES libraries sourced from RDF. AutoES libraries are embedded in RCM. AutoES uses historic data to generate these forecasts. It can be scheduled periodically through batch jobs. |
|
Fc Sales AUR |
Forecasted average unit retail value of a SKU. It reflects the average selling price of a SKU at a specific product hierarchy level based on the forecast. |
|
LY Gross Profit R |
Last year's gross profit retail value (actuals) from the merchandise. |
|
LY Gross Profit % |
Last year's gross profit percentage from the merchandise. |
|
WP Gross Profit R |
The gross profit retail value from the merchandise in category plan's working plan version. |
|
WP Gross Profit % |
The gross profit percentage from the merchandise in category plan's working plan version. |
|
WP Gross Profit var to LY R |
The working plan's gross profit retail value's variance to last year's gross profit retail value actuals. |
|
LY Sales R per Sq Ft |
Last year's sales retail return, expressed in square feet, presented at the sub-category or category level. It is calculated by dividing sales retail from the merchandise by the space (in square feet) allocated to it. |
|
WP Sales R per Sq Ft |
Sales retail return per square feet in the working plan version of the category plan. It is calculated by dividing the respective sales retail value by the area (or space in square feet) allocated to that particular merchandise. |
|
LY Gross Profit R per Sq Ft |
The gross profit retail return per square feet from the merchandise in last year's assortment. It is calculated by dividing the gross profit retail value from the merchandise by the area (or space, in square feet) allocated to the merchandise. |
|
WP Gross Profit R per Sq Ft |
The gross profit retail return per square feet from the merchandise in the working plan assortment. It is calculated by dividing the gross profit retail value from the merchandise by the area (or space, in square feet) allocated to the merchandise. |
Use this view to set the promotional sales targets.
Table 4-47 lists the measures available in this view.
Table 4-47 2. Set Promo Sales Targets Measures
| Label | Definition |
|---|---|
|
LY Sales R |
Last year's sales retail value (actuals) from the merchandise. |
|
LY Promo Sales R |
Last year's promotional sales retail value actuals. |
|
LY Promo Sales contrib to LY Sales R |
Promotional sales retail contribution, in percentage points, to the overall sales retail of last year's assortment. |
|
Fc Sales R |
Forecasted sales retail value for a specific time period. It is generated in RCM by using AutoES libraries sourced from RDF. AutoES libraries are embedded in RCM. AutoES uses historic data to generate these forecasts. It can be scheduled periodically through batch jobs. |
|
WP Sales R |
Sales retail value from the merchandise in category plan's working plan version. |
|
WP Promo Sales R |
Promotional sales retail in the working plan version of the category plan. |
|
WP Promo Sales contrib to WP Sales R |
The promotional sales retail contribution, in percentage points, to the overall sales retail of the working plan assortment. |
|
WP Promo Sales var to LY R |
The working plan's promotional sales retail value's variance to the same in last year plan's actuals. |
|
LY Sales U |
Last year's sales retail value (actuals) from the merchandise. |
|
LY Sales AUR |
Last year's actual average unit retail value of a SKU. It reflects the average selling price of a SKU at a specific product hierarchy level based on last year's actual sales. |
|
LY Promo Sales U |
Promotional sales units in last year's assortment. |
|
Fc Sales U |
Forecasted sales retail units for a specific time period. It is generated in RCM by using AutoES libraries sourced from RDF. AutoES libraries are embedded in RCM. AutoES uses historic data to generate these forecasts. It can be scheduled periodically through batch jobs. |
|
Fc Sales AUR |
Forecasted average unit retail value of a SKU. It reflects the average selling price of a SKU at a specific product hierarchy level based on the forecast. |
|
WP Sales U |
Sales units from the merchandise in category plan's working plan version. |
|
LY Promo Sales AUR |
The average unit retail value for the promotional sales in a last year's assortment. |
|
WP Sales AUR |
Average unit retail value for an item (all items included) in a working plan version of the category plan. It reflects the average selling price of a SKU at different product hierarchy levels in the working plan assortment. |
|
WP Promo Sales U |
Promotional sales units in the working plan assortment. |
|
WP Promo Sales AUR |
The average unit retail value for the promotional sales in a working plan assortment. |
|
LY Gross Profit R |
Last year's gross profit retail value (actuals) from the merchandise |
|
LY Gross Profit % |
Last year's gross profit percentage from the merchandise at the category and sub-category levels. |
|
WP Gross Profit R |
The gross profit retail value from the merchandise in category plan's working plan version |
|
WP Gross Profit % |
The gross profit percentage from the merchandise in category plan's working plan version. |
|
LY Assort SKU Count |
The total number of SKUs in last year's assortment. |
|
LY Assort Promo SKU Count |
The number of SKUs put on promotion in last year's assortment for the cluster. |
|
LY Assort Promo SKU contrib to LY Assort SKU Count |
The number of SKUs put on promotion in last year's assortment relative to the total number of SKUs in last year's assortment expressed in percentage points. |
|
WP Assort SKU Count |
The total number of SKUs in the working plan's assortment for the cluster. |
|
WP Assort Promo SKU Count |
The number of SKUs put on promotion in the working plan's assortment for the cluster. |
|
WP Assort Promo SKU contrib to WP Assort SKU Count |
The number of SKUs put on promotion in the working plan assortment relative to the total number of SKUs in the working plan assortment expressed in percentage points. |
|
CP Assort SKU Count |
The total number of SKUs in the current plan's assortment for the cluster. |
|
CP Assort Promo SKU Count |
The number of SKUs put on promotion in the current plan assortment for the cluster. |
|
CP Assort Promo SKU contrib to CP Assort SKU Count |
The number of SKUs put on promotion in the current plan assortment relative to the total number of SKUs in the current plan assortment expressed in percentage points. |
Use this view to set the category-specific sales and profit targets for the private label.
Table 4-48 lists the measures available in this view.
Table 4-48 3. Set Private Label Targets Measures
| Label | Definition |
|---|---|
|
LY Sales R |
Last year's sales retail value (actuals) from the merchandise. |
|
LY Private Label Sales R |
Sales retail value from private label merchandise, for a category or sub-category, per last year's actuals. |
|
LY Private Label Sales contrib to LY Sales R |
Sales retail contribution of private label items to the overall sales retail of last year's assortment expressed in percentage points. |
|
Fc Sales R |
Forecasted sales retail value for a specific time period. It is generated in RCM by using AutoES libraries sourced from RDF. AutoES libraries are embedded in RCM. AutoES uses historic data to generate these forecasts. It can be scheduled periodically through batch jobs. |
|
WP Sales R |
Sales retail value from the merchandise in category plan's working plan version. |
|
WP Private Label Sales R |
The private label items' sales retail value in a working plan assortment. |
|
WP Private Label Sales contrib to WP Sales R |
The sales retail contribution of private label items to the overall sales retail of the working plan assortment expressed in percentage points. |
|
WP Private Label Sales var to LY R |
Variance in sales retail value from private label merchandise in working plan version of the category plan to last year's actuals. |
|
LY Sales U |
Last year's sales retail value (actuals) from the merchandise. |
|
LY Sales AUR |
Last year's actual average unit retail value of a SKU. It reflects the average selling price of a SKU at a specific product hierarchy level based on last year's actual sales. |
|
LY Private Label Sales U |
Sales units from private label merchandise in last year's actuals. |
|
Fc Sales U |
Forecasted sales retail units value for a specific time period. It is generated in RCM by using AutoES libraries sourced from RDF. AutoES libraries are embedded in RCM. AutoES uses historic data to generate these forecasts. It can be scheduled periodically through batch jobs. |
|
Fc Sales AUR |
Forecasted average unit retail value of a SKU. It reflects the average selling price of a SKU at a specific product hierarchy level based on the forecast. |
|
WP Sales U |
Sales units from the merchandise in category plan's working plan version. |
|
LY Private Label Sales AUR |
Average unit retail value of private label merchandise in last year's actuals. |
|
WP Sales AUR |
Average unit retail value for an item (all items included) in a working plan version of the category plan. It reflects the average selling price of an SKU at different product hierarchy levels in the working plan. |
|
WP Private Label Sales U |
Sales units, for a category or sub-category, from private label merchandise in the working plan version of the category plan. |
|
WP Private Label Sales AUR |
Average unit retail value of the private label merchandise in a working plan version of the category plan. |
|
LY Gross Profit R |
Last year's gross profit retail value (actuals) from the merchandise. |
|
LY Gross Profit % |
Last year's gross profit percentage from the merchandise. |
|
LY Private Label Gross Profit R |
Gross profit retail from private label merchandise in a last year's actuals presented at the category or sub-category level. |
|
LY Private Label Gross Profit % |
Gross profit percentage from private label merchandise in a last year's actuals presented at the category or sub-category level. |
|
WP Gross Profit R |
The gross profit retail value from the merchandise in category plan's working plan version. |
|
LY Private Label Gross Profit contrib to LY Gross Profit R |
Gross profit retail contribution of private label items to the overall gross profit retail of last year's assortment expressed in percentage points. |
|
WP Gross Profit % |
The gross profit percentage from the merchandise in category plan's working plan version. |
|
WP Private Label Gross Profit R |
Gross profit retail value of private label merchandise in the working plan version of the category plan. |
|
WP Private Label Gross Profit % |
Gross profit retail percentage of private label merchandise in the working plan version of the category plan. |
|
WP Private Label Gross Profit contrib to WP Gross Profit R |
The gross profit retail contribution of private label items to the overall gross profit retail of the working plan expressed in percentage points. |
|
WP Private Label Gross Profit var to LY R |
The working plan's private label items' gross profit retail's variance to the same in last year plan's actuals. |
|
LY Assort SKU Count |
The total number of SKUs in last year's assortment. |
|
LY Assort Private Label SKU Count |
The number of private label SKUs in the last year's assortment for the cluster. |
|
LY Assort Private Label SKU contrib to LY Assort SKU Count |
The number of private label SKUs in last year's assortment relative to the total number of SKUs in last year's assortment expressed in percentage points. |
|
WP Assort SKU Count |
The total number of SKUs in the working plan's assortment for the cluster. |
|
WP Assort Private Label SKU Count |
The number of private label SKUs in the working plan's assortment for the cluster. |
|
WP Assort Private Label SKU contrib to WP Assort SKU Count |
The number of private label SKUs in the working plan assortment relative to the total number of SKUs in the working plan assortment expressed in percentage points. |
|
CP Assort SKU Count |
The total number of SKUs in the current plan's assortment for the cluster. |
|
CP Assort Private Label SKU Count |
The number of private label SKUs in the current plan assortment for the cluster. |
|
CP Assort Private Label SKU contrib to CP Assort SKU Count |
The number of private label SKUs in the current plan assortment relative to the total number of SKUs in the current plan assortment expressed in percentage points. |
This tab has one view.
Use this view to set the targets for inventory.
Table 4-49 lists the measures available in this view.
Table 4-49 Set Inventory Targets Measures
| Label | Definition |
|---|---|
|
LY Avg Inv R |
Average inventory retail value or stock retail value carried by the category or sub-category per last year's actuals. Average inventory retail value represents an average retail value of merchandise bought, received, and carried by the retailer before it gets sold at any point in time. This average inventory retail value is generally calculated on a weekly basis or monthly basis to get an understanding of the money invested in inventory or buying merchandise. |
|
WP Avg Inv R |
Average inventory retail value to be carried by a category or sub-category in given planning period, per the category plan's working plan version. |
|
OP Avg Inv R |
Average inventory retail value to be carried by a category or sub-category per the approved category plan or original plan. |
|
LY Turn |
Inventory turns per last year's actuals. It reflects the number of times the average inventory carried can be sold over a specified period of time. |
|
WP Turn |
Inventory turns in the working plan version of the category plan. It is the number of times the average inventory carried can be sold over a specified period of time. In other words, it reflects the speed of inventory movement. |
|
OP Turn |
Inventory turns in the approved category plan or original plan. It reflects the number of times the average inventory carried can be sold over a specified period of time. |
Use this tab to approve the category plan. On approval, the category plan targets, roles, strategies, and tactics are shared with assortment planning and MSO. Also on approval, the working plan (WP) numbers are copied to original plan (OP). Once approved, the original plan (OP) is directly committed to the database.
The original plan is then communicated to assortment planning process in the form of targets. The plan is time-stamped and includes user information.
To approve the roles, strategies, tactics, and category plan targets, check the box next to the respective category. Use the Approve OP custom menu to approve working plan (WP) version of category plan to original plan (OP). Enter any approval comments. Click the Approve custom menu option to approve. Commit the workbook changes.
This view contains the Approve custom menu option.
This view exists at the following hierarchy levels or higher:
Category
Trading Area
Quarter
Table 4-50 lists the measures available in this view.
Table 4-50 Approve Assortment Strategies, Tactics, and Scorecard Measures
| Label | Definition |
|---|---|
|
WP Approve to OP |
Category Planning Working Plan Approve to Original Plan Boolean. Boolean mask measure to control what is approved and not approved as the Original Plan. |
|
WP Approve to OP Comment |
Category Planning Working Plan Approve to Original Plan Comments. The comments made by the approver at the time of approving a specific category plan for the approval seeker to take a note of while executing the plan or working on other plans. |
|
WP Approve OP Date |
The date of approval of a working plan to an original plan. |
|
WP Approve to OP By |
The approver's ID that is used to approve a working plan to an original plan. |