| Oracle® Retail Category Management User Guide for the RPAS Fusion Client Release 14.1.1 E62413-01 |
|

 Previous |
 Next |
| Oracle® Retail Category Management User Guide for the RPAS Fusion Client Release 14.1.1 E62413-01 |
|
Previous |
Next |
Category Management practice in the retail industry is a key business process that determines the success of a retailer's business. It involves managing individual product categories as independent strategic business units (SBU) in a systematic and disciplined way, with each product category playing a specific role in the retailer's goal to achieve larger, established business objectives. It determines the variety, nature, and presentation of merchandise and the retailer's offers, which define a customer's in-store, in-channel experience. This is of the utmost importance in determining the retailer's success.
Conceptually, Category Management practice consists of the following actions:
Understand and assess the retailer's business:
Marketplace analysis: Market analysis involving the assessment of consumer demographics, psychographics, market structure, and key market forces to gauge the business potential of individual product categories and business as a whole.
Product and consumer analysis: Category level and cross-category performance analysis with consumer segment level insights at various points to understand the intricacies of the retailer's business, identify the target consumer segments contributing to the retailer's business, and shape the category plans and assortment plans accordingly.
Competitor analysis: Assessment of the retailer's standing in the market in comparison with the competition.
Review the retailer's macro-strategy and assign roles, strategies, and tactics to product categories across the retail chain.
Create sales, gross profit, and inventory plans for national brands and private labels. Determine pricing, promotion, and supplier strategies for product categories in the form of category plans.
Allocate optimal space at the macro (department/category/sub-category level) and micro-levels (SKU level) per the retailer's macro-strategy.
Create assortment plans that define the product-mix and business targets for product categories.
Oracle Retail Category Management (RCM) supports category planning, macro space optimization, assortment planning, and space optimization of assortments. It broadly follows the traditional Category Management business process, with the inclusion of the consumer segment perspective across various points in the process flow. Most importantly, the application provides a structured, measured set of activities designed to achieve specific business objectives.
The Category Planning task enables the retailer to create high-level qualitative and quantitative business plans at the trading area level. Macro Space Optimization tasks facilitate optimal store space allocation at a macro product hierarchy level for improved space productivity. Assortment Planning tasks facilitate the creation of SKU-level assortment plans at the cluster and store level across the retail chain.
The RCM application consists of the following specific tasks:
Category Planning: Used to analyze a retailer's business across product categories and within a category, from a market, competition, and consumer perspective. Category Planning is used to set business targets and assign roles, strategies, and tactics for individual product categories at the trading area level.
Macro Space Optimization @Dept: Used to allocate optimal space to different departments based on the historical relationship between space and profit. This helps determine the macro-space plan at the department level, specifications for store layouts, shelves, and fixtures, and merchandising techniques. This facilitates the efficient use of the available space by the retailer.
Macro Space Optimization @Sub-Category: Used to allocate optimal space to different sub-categories under a department to efficiently use the available space at this level. This helps in determining the planogram design and merchandising method at the sub-category level.
Assortment Planning Analysis: Used to analyze an assortment's historical performance from a market, competition, and consumer perspective at an item level. It also provides insight into the trends, market composition, and market structure from a competition and consumer segment perspective. It is used to review roles, strategies, and tactics from the category plan and targets from both the category plan and merchandise financial plan. Visibility to roles, strategies, tactics, and financial targets in assortment planning ensures that SKU/item level assortments align with the overall category-level objectives.
Assortment Planning @ Cluster: Used to create, analyze, adjust, and finalize assortment plans at the cluster level. Assortment plans are created using Item Priority Index (IPI) and market coverage-based methods. The functionality of demand transference, assortment improvement, and incremental curve are used to fine tune and optimize draft assortments. Integration with Assortment and Space Optimization (ASO), an Oracle Retail Advanced Science (ORASE) solution, is used to align assortments to the space available for optimal space productivity.
Assortment Planning @ Store: Used to create, adjust, review, and approve custom assortment plans at the store level utilizing IPI-based assortments, demand transference, and integration with ASO.
Here are the key highlights of the application:
Provides a platform to analyze consumer and market insights available in the form of syndicated data provided by third parties, such as Nielsen and IRI. Consumer segment level insights for the retailer's business can be also be sourced from the retailer's loyalty program data.
Analysis of market structure by viewing the consumer segments among the shoppers and evaluating the business opportunity in a trading area.
Performance analysis of individual product categories, based on various retail business parameters, as compared to the market in general and the competition in particular.
Creation of category plans with business targets in terms of different sales, gross profit, inventory parameters with role assignments to individual product categories, and a blueprint for strategic and tactical action within a category and across categories.
Macro Space Optimization, at the department and sub-category level, to allocate optimum space to different product categories and improve space productivity.
Integration with ORASE to source optimized store clusters (assortment clusters), Consumer Decision Trees (CDTs), product attributes, and demand transference insights. CDTs can also be sourced from an external source, such as a supplier or third-party vendor. Consumer segmentation, clustering of stores, and CDTs are used to tailor assortments to specific markets across geographies and channels.
System-recommended target-focused assortments can be generated using IPI and market coverage-based approaches through user-defined constraints.
Creation of assortment plans, at the cluster and store level, in alignment with category plans and merchandise financial plans created through user-defined target-constrained assortment generation.
Demand Transference, based on advanced science insights, to manually fine tune and refine assortment plans by reviewing demand shifts between SKUs with changes in assortment.
The functionality of incremental curves, to arrive at an appropriate assortment range for product categories by identifying the point at which the cannibalization of sales between products in an assortment begins.
Assortment Improvement, based on the concept of demand transference, automates the refinement of sales retail, sales units, or gross profit based on user-defined constraints.
Space optimization of assortments through the integration with ASO to generate actionable and optimal assortments per the available space at the stores.
Publication of final assortment plans for execution and implementation.
Note that the previously mentioned activities, part of the Category Management application, are performed at different levels of the product and location hierarchies. This facilitates customized Category Management planning across the retail chain.
|
Note: Product Category or Merchandise Category refers to Class in Oracle Retail Merchandising System (RMS) terminology. Similarly, Sub-Category refers to Sub-Class. |
The following Category Management activities and tasks are described in this guide:
Category Management Planning Activity:
Category Planning Task
For more information, see Chapter 4.
Macro Space Optimization @ Dept Task
For more information, see Chapter 5.
Macro Space Optimization @ Sub-Category Task
For more information, see Chapter 6.
Assortment Planning Analysis Task
For more information see Chapter 7.
Assortment Planning @ Cluster task
For more information, see Chapter 8.
Assortment Planning @ Store Task
For more information, see Chapter 9.
Category Management Administration Activity:
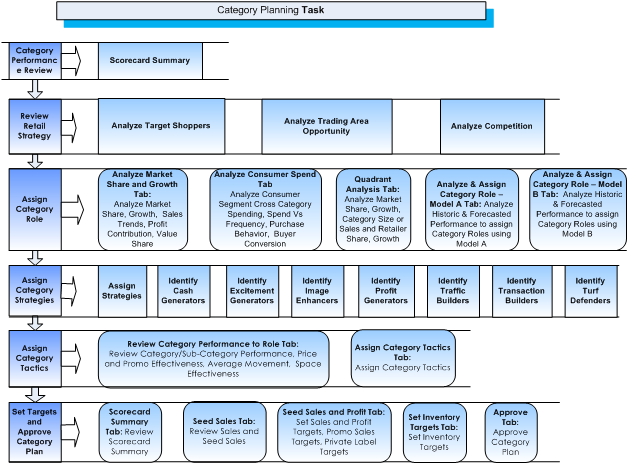
Figure 1-1 illustrates the task flow for the Category Planning task. The Category Planning task facilitates the creation of a category business plan at the sub-category level along with roles, strategies, and tactics assignment to product categories. It also presents various views for consumer, market, and competitor analysis.
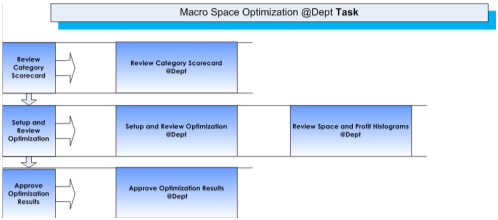
Figure 1-2 illustrates the task flow for the Macro Space Optimization @Dept task. This task presents category scorecard review, setup and review of optimization results, and approval of MSO results at the department level.
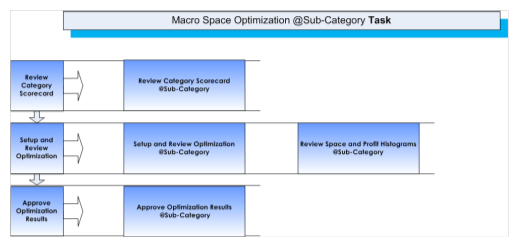
Figure 1-3 illustrates the task flow for the Macro Space Optimization @Sub-Category task. This task presents category scorecard review, setup and review of optimization results, and approval of MSO results at the POG sub-category level.
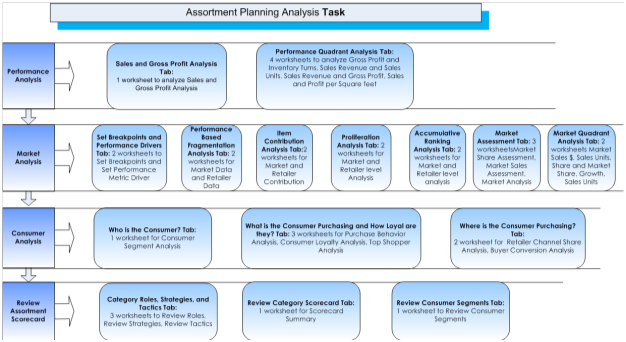
Figure 1-4 illustrates the task flow for the Assortment Planning Analysis task. This task presents performance, market, and consumer analysis at the item level. It also presents roles, strategies, tactics, and targets from the category plan and targets from the merchandise financial plan for the assortment planning to begin.
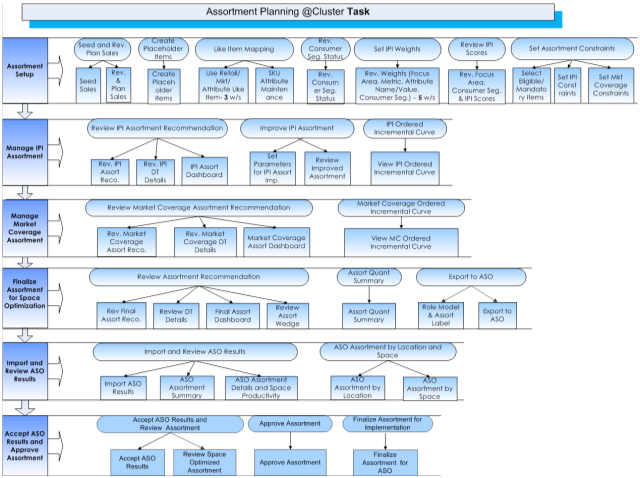
Figure 1-5 illustrates the task flow for the Assortment Planning @ Cluster task. This task begins with the assortment setup for the assortment planning, which involves the seeding of working plans, setting assortment eligible and mandatory items, and the defining of the assortment constraints to generate system-recommended assortments using:
IPI-based assortment method
Market coverage-based assortment method
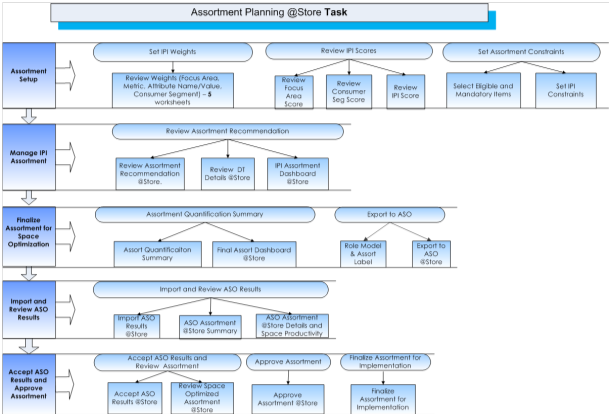
Figure 1-6 illustrates the task flow for the Assortment Planning @ Store task. Store level assortment plans can be created using the IPI-based assortment generation method and space optimized assortments derived under this task.
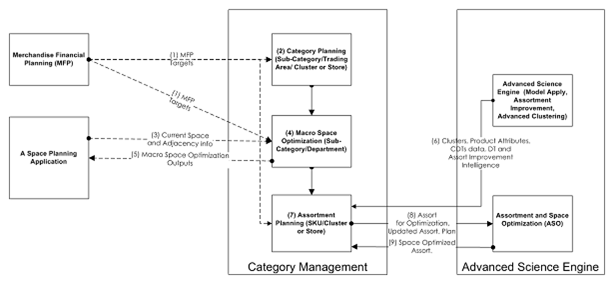
Figure 1-7 depicts the overall process flow in Category Management and data exchange with other applications. Broadly, the process flow consists of the following steps:
Create and approve category plans and share them with Macro Space Optimization and Assortment Planning.
Import current space and adjacency information from a space management system like Macro Space Management (MSM). This integration is not currently available in the version 14.1 release.
Import MFP targets into Assortment Planning and MSM modules. The integration is not currently available in the version 14.1 release.
Perform Macro Space Optimization.
Share the MSM outputs with a space management system and Assortment Planning. Integration with MSM is not currently available in the version 14.1 release.
Import clusters, product attributes, CDTs, Demand Transference (DT), and Assortment Improvement intelligence from ORASE.
Create Assortment Plans.
Export Assortment Plans to ASO.
Import space optimized assortments from ASO. Review, accept, approve, and finalize the assortment plans.
Space profit tables form the basis of MSO and are maintained by an administrator. These tables are used to store a relationship between allocated space and the respective gross profit returns at the retailer, based on historic data. Space profit tables are also referred to as space profit elasticity curves, which are derived using advanced science algorithms.
Macro Space Optimization can be conducted at the store level, cluster level, or trading area level. It uses an algorithm, which runs at the store level, to recommend optimum space to a department and sub-category. At the cluster and trading area levels, the recommendations are presented by aggregating data from the store level.
This section covers RCM's integration with ORASE. RCM is integrated with the ORASE and sources key information, which is used in the Category Management process flow. ORASE is also referred to Advanced Science or Science.
ORASE is the umbrella name for all the Advanced Science solutions. In Category Management, it is used for the following functionality:
Used to generate assortment clusters, CDTs, and DT science parameters. The Advanced Clustering (AC) solution is used to generate assortment clusters.
Used for assortment space optimization.
ORASE, through its specialized set of applications, derives key insights data by deep data mining rich historical business data. Imports from ORASE provide powerful insights about the retail business, bring efficiencies into the assortment planning process, and facilitate quick and effective decision making. In effect, RCM's integration with ORASE sets the stage for advanced science-based category management practice.
Key integration points with ORASE include the following:
Import of Assortment Cluster Data: Stores are grouped into assortment clusters or store clusters to be used to create Assortment Plans at the cluster level. A prerequisite for RCM to source assortment clusters from ORASE is that both the applications must be sharing a common location hierarchy, that is, in terms of stores to trading areas mapping. ORASE provides retailers with a flexible, user-friendly clustering solution that uses advanced clustering methodology, where clusters can be generated based on various parameters such as seasonality, consumer segment profiles, store attributes, performance attributes, and product attributes. Other than ORASE, assortment clusters can also be sourced from the retailer's legacy system or any other external application.
Import and Export of Product Attributes: Product attributes, or simply attributes, consist of attribute names and attribute values at the SKU/item level. RCM sources attributes from ORASE that in turn sources this information from Oracle Retail Analytics (RA). RA extracts this information from RMS through Oracle Retail Extract, Transform, and Load (RETL) procedures. This import is a prerequisite for importing CDTs from ORASE, as CDTs are based on product attributes. RCM and ORASE must be in synch in terms of product attributes. RCM provides the facility to add and modify attribute values that map to SKUs/items. An export facility is available to communicate the changes to the master data management system, such as RMS and RA, and eventually to ORASE. This is to keep both the applications in synch in terms of product attributes.
Import of Consumer Decision Trees: CDTs are used to understand the consumer buying process and identify key product attributes that influence consumer buying decisions from a consumer segment profile perspective. CDTs can be leveraged within the Assortment Planning process as an alternate product/merchandise hierarchy to analyze the assortment to ensure the presence of key items for target consumer segments in the planned assortment, reduce product attributes duplication beyond the required number of options in the assortment, and avoid dropping of unique items that can result in lost customers.
CDTs are generated in ORASE by using customer purchase history data and conducting deep data mining using advanced science methods. Customer purchase history can be internally sourced from point-of-sale (POS) or loyalty solutions and externally from home-scan data providers. CDTs can also be fed to RCM directly from a legacy system or application at the retailer. These CDTs can be directly sourced from third-party sources such as suppliers or providers of syndicated market data.
Import of Demand Transference Data: DT is used within the assortment planning process to understand the shift in sales between items within an assortment with changes to the assortment. This enables the assortment planner to assess the assortment as a whole and evaluate the effectiveness of each item within the assortment. ORASE mines historical customer purchase data and generates DT parameters that are leveraged interactively, through an application programming interface (API), in the Assortment Planning and Optimization process.
Integration with ASO: ASO is a specialized application of ORASE used for optimizing assortments to the available space. Unlike other integration points listed above based on flat-file interfaces, this integration is achieved using RPAS-based Hybrid Storage Architecture (HSA) to provide a near real-time round-trip integration between RCM and ASO. The Oracle Database schema, RPAS Data Mart (RDM), is used to store data being exchanged between RCM and ASO. RCM exports assortment plan and category plan data to ASO with a space optimization request. ASO optimizes the assortment to the available space at the retailer and allocates a suitable number of facings and linear feet, taking into consideration the planograms (POGs) used, demand transference, and supply chain factors. Three types of exports are available:
An export of assortment plan and category plan data to ASO with a space optimization request.
An export of an updated assortment plan for an existing space optimization request.
An export to ASO with an update on assortment finalization for implementation.
Once the assortment's space optimization is complete, ASO results in the form of a recommended assortment plan and space productivity information are exported back to RCM.
For detailed information on these exports, see the Oracle Retail Category Management Implementation Guide.
The Category Management application has special data requirements that factor consumer-centricity and the retailer's market standing into the Category Management practice. A lot of this data is sourced from third-party syndicated data suppliers, also referred to as external market data providers. Examples of external market data providers include AC Nielsen, Symphony IRI, Axciom, and FICO.
Some of this data is also sourced internally from other applications such as point-of-sale (POS), loyalty program applications, and analytic applications such as RA.
All of this data is imported into Category Management as part of the implementation process or, as needed. Table 1-1 describes the types of data entered and used for Category Management.
Table 1-1 Types of Data
| Data | Description |
|---|---|
|
Market Syndicated Data |
Third-party syndicated data suppliers have an agreement with most retailers (including both the retailers and their competitors) competing in the market to share their POS data with them. They combine and analyze this data to provide market syndicated data with rich insights to the retailer. This data reflects most retailers as a whole and the retailer's standing in the market or a trading area. |
|
Household Panel Data |
Also referred to as home-scan data. Third-party syndicated data suppliers collect this data from customers in the market by registering them for scanning their purchases from the retailers and sharing it with them. They use this data to identify key patterns for different consumer segments. This provides a sample representation of the market for different trading areas at the consumer segment level. |
|
Market Basket Data |
Market basket refers to customer purchase data at the retailer. Customer purchases refer to market basket or the customer's basket or basket in general. The concept of market basket deals with analyzing the product (SKU) mix, number of baskets over a period of time, value of the basket bought, and category/sub-category contribution's in a customer's basket. Market basket is a focus area in IPI calculations used to derive an assortment plan. This type of information provides insight into the halo/cannibalization effect of items that are purchased, which items are typically found in high basket rings, and so on. |
|
Customer and Market Loyalty Data |
Customer loyalty data represents loyalty metrics associated with consumers within a particular trading area towards specific retailers or a particular retailer. Market loyalty data is more product-focused loyalty information. Brand loyalty is an example of market loyalty data that represents the percent of the category dollar volume that is satisfied by the brand among brand buyers within a particular trading area. Customer and market loyalty data is supplied to retailers by syndicated data suppliers, such as Nielsen, Symphony IRI, and NPD. |
|
Loyalty Card/Program Data |
Data captured through loyalty programs for a particular retailer. This is the retailer's internal data from its Customer Relationship Management (CRM) applications. Retailers mine the data of their loyalty card holders in order to understand who their profitable customers are, what they buy, how often they buy, and which products and attributes they buy. Customer loyalty data is a useful component in assortment planning and the category management process, as retailers must ensure that they are carrying products that appeal to their most profitable customers. This data is also referred to as frequent shopper data. |
The data described in Table 1-1 is required to leverage the full functionality of the RCM application, particularly category planning and assortment planning tasks. It is possible to leverage the Category Management solution without all of the data, but access to some key and relevant pieces of functionality would be unavailable in the absence of such data. For example, without market syndicated data, you cannot perform a market focused analysis of categories and assortments. For more information, see the Oracle Retail Category Management Implementation Guide.
For the list of data requirements for advanced science-based features such as CDT, DT, and ASO, see the Oracle Retail Advanced Science Engine Implementation Guide.
This section lists all of the data that is required, along with its source, before a user can begin the category planning process.
The following data is required for category planning:
Product hierarchies defined for each retail vertical such as grocery, hardliners, general merchandise, and so on
Formalized products for each product category
Consumer segments defined for each retail vertical
Location hierarchy and trading areas
Trading area is a new concept in Oracle Retail Planning and Optimization applications and is defined as a specific geographic area demarcated by a retail chain to view, plan, and manage its business and compare it with the competitors' business. It is sometimes referred to as market. For the geographic area being demarcated to qualify as a trading area, it must be generating a threshold volume of business (sales) neither too large nor too small, but contributing to a significant chunk of the business in that region. The value of threshold volume of business is based on the retailer's discretion, for example, Atlanta, Jacksonville, Greater Mumbai area, and so on.
Trading areas are also defined on the basis of traditional geographical boundaries such as a city or town, census survey reports, governmental directions, common understanding among different retailers and market research companies in the industry, and the retailer's own business requirements. Trading area definition may differ from retailer to retailer competing in the same region, state, country, and so on. There can also be a common agreement in the industry on the trading areas definition and division among retailers and third-party market research companies collecting and providing syndicated data to the retailers for everyone's benefit.
For example, the U.S. market is conventionally divided into 52 trading areas by market research, largely following state-level demarcations.
The preceding data requirements are met by importing the following:
Store clusters
In the generally available version of the solution, store clusters or assortment clusters are imported from ORASE.
Product hierarchies
Location hierarchies
CDTs
Product attribute names and attribute values
In the generally available version of the solution, this product attribute information is imported from ORASE.
Market scan data
Retailer POS data
Space-related data
Retailer loyalty data
Market basket data
DT input parameters from ORASE
A key take away is a free-form text field that enables the user to enter notes pertinent to a specific line-item in a view:
The notes can be any important points the user wants to capture, such as additional information (quick insights such as supplier insights, competition insights, consumer insights, product insights, and so on) used in arriving at a decision highlighting the rationale or perhaps a point that led them to their final decision.
Key take aways can be used for saving notes from findings derived from different analyses.
Key take aways can be used by the owner of a step to provide notes to other users who have lower privileges.
Users are typically assigned to specific roles based on organizational structure.
|
Note: Access to tasks is controlled by security permissions. If you do not have the permission to access a task, that task does not appear in your task list. |
Table 1-2 shows an example list of roles and their functions and areas of responsibility:
Table 1-2 Example of Roles
| Role | Application | Description |
|---|---|---|
|
Category Manager |
Category Planning |
Analyzes category performance and compares with competition. Determines the roles, strategies, and tactics. Responsible for meeting financial targets. |
|
Buyer / Assortment Planner |
Assortment Planning |
Selects the optimal assortment for each store, taking into account sales performance, forecast, budget, and space constraints. |
|
Merchandising Analyst |
Category Planning and Assortment Planning |
Analytical support for Nielsen/IRI syndicated data, product attributes validation, ORASE administration, CDT Analytics, DT, and assortment optimization. |
|
Planogrammer |
ORASE and POG Software |
Ensures that the assortment can fit within the allocated space, and adds the art to the planogram. |
|
Floor Planner |
MSO, a space management system |
Uses space targets to define department sizes. |
|
Merchandiser |
MSO, a space management system |
Uses category/sub-category space targets to determine what length of planograms to place. |
|
Administrator |
NA |
Application installation, administration, and support, data imports, and user ID creation. |
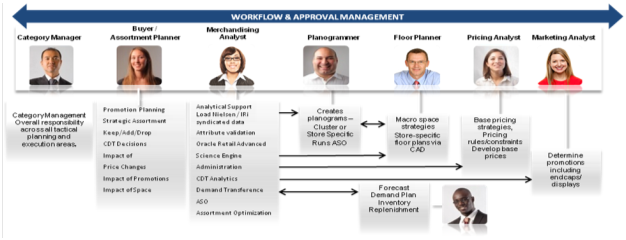
Figure 1-8 presents various business roles involved in the end-to-end category management process. Note that not all the standard user roles defined in this figure are directly working on the RCM application.
The measures in the RCM product are composed of a Role, Version, Metric, and Unit of Measure. Each component is designed to carry a particular piece of information that, when taken together, indicates the purpose of the measure. Table 1-3 lists a description of each component.
Table 1-3 Description of Measure Components
| Component | Description |
|---|---|
|
Role |
The role describes an anticipated type of user who will use the system. Workbooks are tailored to meet the needs of these different types of users, so it also generally indicates where the measure is expected to be found in RCM. |
|
Version |
The version tells at what stage in the planning process the measure's data represents. Examples of this are this year (TY) versus last year (LY), or working plan (WP) versus original plan (OP) or target (Tgt). It can also indicate that a measure is intended to be an intermediate measure. |
|
Metric |
This component describes the nature of the information in a measure. Typical examples are sales, profit, inventory turn, and so on. |
|
Unit of Measure |
The unit of measure represents the data format, integer, decimal number, date, text, and so on. |
Some of the commonly used roles are listed in Table 1-4.
Table 1-4 Category Management Roles
| Role | Description | Notes |
|---|---|---|
|
AC |
Assortment Planning @ Cluster |
Measures with this role are almost all found in the Assortment Planning @ Cluster workbook. |
|
AD |
Administrator |
Measures with this role are mostly found in the administration workbook. They are occasionally found in other workbooks, and often are loaded with an initial set of default values. |
|
CM |
Category Planning |
Measures with this role are usually found in the Category Planning workbook. Some CM measures are also shown in the Assortment Planning Analysis workbook for reference. |
|
DR |
Default Role |
This role usually indicates that the measure is for raw, loaded data. This data is usually processed before appearing in any other workbook. It also is used for utility purposes, for example, for the role for a measure whose only purpose is to provide white-space on a view. |
|
CE |
CDT Editor |
This role indicates that the measure is associated with the CDT Editor workbook. There are relatively few of these. |
|
AS |
Assortment Planning @ Store |
Measures with this role are found in the Assortment Planning @ Store workbook. |
|
MD |
Macro Space Optimization @Dept |
Measures with this role are found at the Macro Space Optimization at Department level. |
|
MS |
Macro Space Optimization @Sub-Category |
Measures with this role are found in at Macro Space Optimization at Sub-Category level. |
|
SO |
Assortment Space Optimization |
This role is used for ASO interface database measures stored in the Data Mart in the RPAS HSA. |
Some of the commonly used versions are listed in Table 1-5.
Table 1-5 Category Management Versions
| Version | Description | Notes |
|---|---|---|
|
CP |
Current Plan |
These measures contain the most recently approved assortment plan values. |
|
LP |
Last Plan |
These measures contain a copy of the CP measures, time-shifted into the future by one period. It is used to give users another data set against which to compare the WP information. |
|
OP |
Original Plan |
This denotes information approved in the Category Planning workbook used as target information for the Assortment Planning workbooks. |
|
WP |
Working Plan |
These measures contain data that users are currently working on. |
|
LY |
Last Year |
Time-shifted data used to compare the current plan with last year's values for the same period. |
|
TY |
This Year |
Usually applied to loaded historical data, and rarely shown in workbooks. |
|
Fc |
Forecast |
Only used for measures that store the results of a forecast. |
|
DV |
Default Value |
Data for which there is not yet a defined version in the system. Often used with the default role (DR) to indicate base loaded data. |
|
DB |
Database |
Usually, measures that are part of an intermediate step in a calculation. |
|
DC |
Scalar |
Usually, measures that store a global value, such as labels. |
|
LU |
Lookup |
Usually, measures that are part of an intermediate step in a calculation. |
|
Mf |
Merchandise Financial Planning Targets |
Version used for MFP interface measures. |
|
AI |
Assortment Improvement |
Version used for Assortment Improvement versions of all metrics. |
|
AO |
ASO |
Version used to store level ASO results of all metrics. |
Combined measures are widely used to present the assortment plan information at the cluster level by capturing this information from both cluster level measures and store level measures. Store level measures provide specific information about assortments for stores whose assortments have been planned on an exceptional basis.
If, store level measure values are populated for a store location, then combined measure information is calculated using them; otherwise, cluster level measure values are used to calculate the combined measure value from that location. Combined measure information is aggregated from store/SKU level and presented at the cluster/SKU level and above.
Private label measures are available in assortment planning. Private label measure values are derived using the attribute value maintenance for a SKU. If a private label attribute is maintained for an item, the private label measures values are populated with the corresponding plan data. If the private label measures are directly entered or planned, they are automatically copied to the working plan measures.
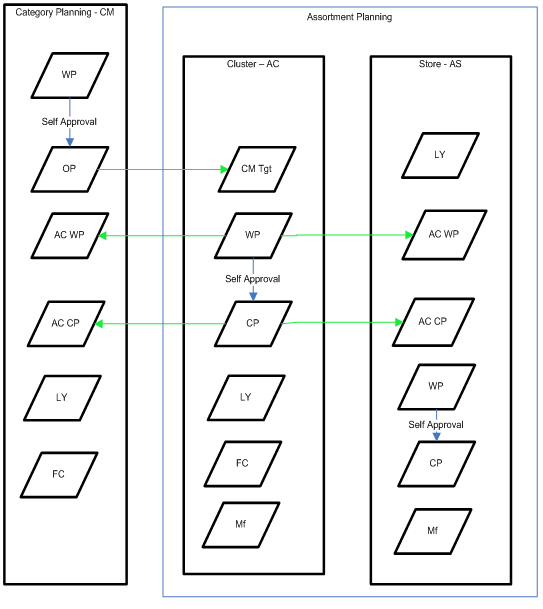
The combined roles and versions of measures indicate how data flows through the system. This is referred to as version flow and is an important part of understanding how Category Management is structured.
Figure 1-9 shows how data flows through the RCM application.
The Category Planning workbook has WP (Working Plan), LY (Last Year), FC (Forecast), and OP (Original Plan) versions of measure available at the trading area level. When a category plan is approved, the current WP measure data is copied to OP versions of the measures. This OP version is shared with Assortment Planning. This is accomplished by again copying the data from a CMOP role/version to corresponding ACOP role/version measures, which are used to present CP targets information at the cluster level. In Figure 1-9, the CM Tgt version is called OP in the application. Note that the CM OP measure versions are only available at the trading area level.
The Assortment Planning workbook has WP, LY, FC, and CP versions of measure. WP is approved to CP, and this CP version is shared to Category Planning and Assortment Planning @ Store. CM is architected so that Assortment Planning @ Cluster and Assortment Planning @ Store tasks are part of a single workbook. This ensures the sharing of version data between the two tasks in real time, as opposed to the sharing of data to Category Planning, which requires building and refreshing of the workbooks between the two.
Assortment Planning @ Cluster and Assortment Planning @ Store share the same base sales metric (that is, ACWPSlsR and ACWPSlsU at Week/SKU/Store). The only replan done in the Assortment Planning @ Store task is the assignment of override for Core/Optional flags that update the final Assort Sales metric at Store in relation to Cluster.
Finally, the Assortment Planning information AC WP and AC CP (Assortment Planning @ Cluster role) is also viewable in the Category Planning workbook. The reason AS WP and AS CP (Assortment Planning @ Store role) are not shown in the diagram is that the cluster and store information is combined and presented in measures called WP AS Combined Assort Sales and CP AS Combined Assort Sales. These measures combine both AC and AS values into AC WP/CP into measures shared to Category Planning. This is done in Assortment Planning as a normal calc rule group.
Macro Space Optimization tasks at the department and sub-category levels are also part of the solution workflow but are not highlighted in the above diagram. CM OP measures representing approved category plan targets are shared with MSO @ Dept and MSO @Sub-Category. They are presented as MD OP (Macro Space Optimization @ Department role) and MS OP (Macro Space Optimization @ Sub-Category role) type measures at the department and sub-category level, respectively.
Approved macro space optimization results (Current Plan - CP version) at the sub-category level - MS CP type measures (for recommended gross profit and space) are shared with Assortment Planning in the form of AC CP measures.
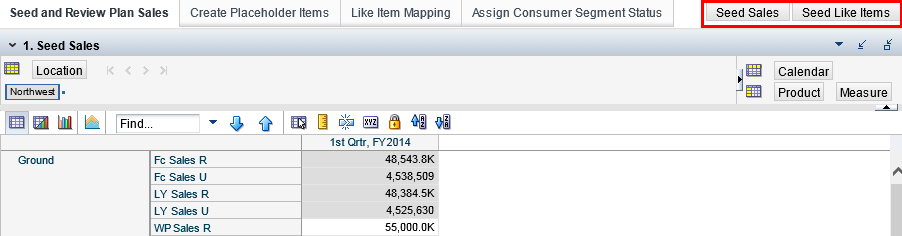
Custom menu buttons are located above the top right corner of the content area for some workbooks. Custom menus are specific to the views under the steps available in different tasks. For example, the Seed Sales custom menu option, shown in Figure 1-10, is applicable to the Seed Sales and Review Sales views in the Set Targets and Approve Category Plan step under the Category Planning task. The WP Seed Sales flag needs to be checked in the Seed Sales view before running the custom menu option. The results of the custom menu option run then appear in the Review Sales view.
Custom menus are used run a batch or a special expression in the background that performs specific calculations, imports, exports, and so on, thereby activating a specific functionality in the application. Figure 1-10 shows an example of a custom menu option.
The Seed and Review Plan Sales and Like Item Mapping tabs (under the Assortment Planning @ Cluster task and Assortment Setup step) have two custom menu options available. Seed Sales and Seed Like Items are available for seeding sales to the new plan and seeding like item sales to new items, respectively. The view is that of Seed Sales, which presents different versions of the plan, including WP (Working Plan) along with LY (Last Year), and Fc (Forecast) plan measures.
In using software solutions, there is often a need for customized views that reflect an individual user's preferences.
Copy view option functionality enables the creation of custom views (worksheets) by copying an existing view, selecting and formatting the measures as required, and saving the custom views in the workflow.
The copy view option can be used by right clicking on any of the view/worksheet labels at the bottom to create a copy of the existing view. The copied view can then be customized as needed. This option is useful in creating custom views per individual requirements.
A key take away is a free-form text field that allows the user to enter notes pertinent to a specific line-item in a view.
The notes can be any important points that must be captured, such as additional information (quick insights. including supplier insights, competition insights, consumer insights, and product insights) used in arriving at a decision, highlighting the rationale or perhaps a point that helped make a decision. They can be used to save notes from findings derived from different analyses.
Key take aways can be used to share notes between different business users working across different sections in RCM workflow.