| Oracle® Retail Category Management User Guide for the RPAS Fusion Client Release 14.1.1 E62413-01 |
|

 Previous |
 Next |
| Oracle® Retail Category Management User Guide for the RPAS Fusion Client Release 14.1.1 E62413-01 |
|
Previous |
Next |
The Macro Space Optimization @Dept task is used to allocate optimum space to the departments in a store.
Macro Space Optimization (MSO) is used in Category Management to allocate optimum space to a department or sub-category. Just as with merchandise buying budgets, space is a key resource in Category Management. It has a cost associated to it and needs to be used efficiently.
In the context of MSO, space refers to the floor area, fixture-space, and shelf-space at the stores used to display merchandise in the selling area. The unit of measure for space can be linear units (feet, meters, and so on), square units (square feet, square meters, and so on), or cubic units (cubic feet, cubic meters, and so on). This must be defined at the time of application installation.
Optimal space allocation is based on the following two principles:
Gross profit maximization from the available space at the retailer.
Optimal space allocation for a fixed gross profit goal.
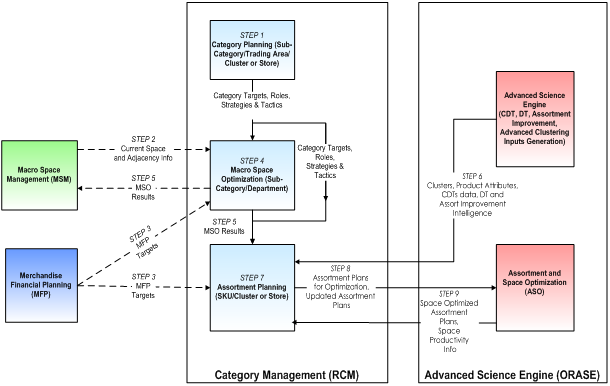
Before beginning MSO, the following requirements should be met. See Figure 5-1 for an illustration of the related process flow.
An approved category plan must be in place.
A merchandise financial plan must be imported from Oracle Retail Merchandise Financial Planning (MFP).
Planograms (POGs) must be prepared.
Current space information must be imported from a space planning application.
Space profit tables must be available.
Space Profit tables form the basis of MSO and are maintained by an administrator. These tables are used to store a relationship between the allocated space and the respective gross profit returns at the retailer, based on historical data. Space Profit tables are also referred to as space profit elasticity curves, which are derived using advanced science algorithms.
MSO can be conducted at the store, cluster, or trading area level. It uses an algorithm that runs at the store level to recommend optimum space to a department and sub-category. At the cluster and trading area levels, the recommendations are presented by aggregating data from the store level.
For more information on Space Profit tables, see "Manage MSO Tables Step" in Chapter 3.
Note that MSO is conducted prior to the ASO activity so that the assortment plans can be made in alignment with the allocated space to sub-categories.
MSO uses the planogram (POG) hierarchy in place of the traditional product (PROD) hierarchy. The POG hierarchy represents the store layout; it is the way a store's selling area is structured and depicts the front-end of the store as presented to the customer. Therefore, there is a need to transform PROD hierarchy-based targets to the POG hierarchy and transform the POG hierarchy-based optimization results to the PROD hierarchy.
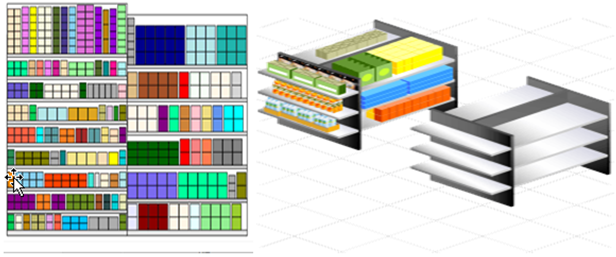
A POG is a visual diagram indicating the placement of products on shelves and fixtures in a store, so as to use the available space optimally and catalyze customer purchases. Planograms are used to define how different products are physically merchandised in a store.
The images in the following figure show a sample POG and actual product shelves used to physically merchandise the products in a store.
The POG hierarchy defines the way products must be physically merchandised in a store. There are three levels of the POG hierarchy defined in the application:
POG Department
POG Category
POG Sub-Category
These levels are synonymous with Department, Category (or Class), and Sub-Category (or Sub-Class) in a product hierarchy.
Retailers tend to use a planogram hierarchy when merchandising a store, as opposed to the product hierarchy, although these are often very similar. For example, within a grocery department, the dairy category may include milk, eggs, and butter, but these are generally merchandised completely separately, owing to the different types of fixture that each requires. Within an electrical retailer, printers and print cartridges are likely different categories, but they are often merchandised in the same planogram.
In effect, the planograms used vary from retailer to retailer. They depend on the type of retail format, customer shopping patterns, type of merchandise, and product packaging.
The POG department represents the distinct department zones in a store, which broadly demarcate different types of merchandise being sold at the store. Department zones help customers to locate the merchandise they want to buy when they enter a store. For example, in a grocery store, the bakery department is segregated in an area within the store that contained all the bakery planograms.
The next two levels in the POG hierarchy, the POG category and POG sub-category, are defined on the basis of planograms used in the store.
Planograms can be defined at either the category or sub-category level. Some retailers define their planograms at sub-category level, which makes it easier to create more assortments for the category, by combining the sub-category planograms. For example, ground coffee and instant coffee can use the same planogram, which means they are represented by a single, combined POG sub-category level.
Others develop their planograms at the category level, which requires more work in creating the various category assortments; however, it does give greater flexibility in merchandising products from different sub-categories in the same planogram without any constraint on the bay boundaries such as in the case of sub-category level planograms. In such scenarios, ORASE comes in handy in optimizing the assortments to the available space or the planograms to come out with actionable assortments.
For example, in the Beverages department, there may be a single planogram being used for the categories tea and coffee. So, in effect there is one combined POG hierarchy level for them.
MSO can optimize at the department level, where it works in square units (square feet or square meters), and at the sub-category level, where it works in linear units (feet or metres). This must be taken into consideration when defining the planogram hierarchy.
The mapping between the PROD and POG hierarchies is defined in the Category Management Administration task. This mapping information is then used in the task flow to transform product hierarchy-based targets (from the Category Planning task and MFP application) into POG hierarchy-based targets.
MSO can be performed at two levels in Category Management:
POG department level using the Macro Space Optimization @Dept task. This task is used to allocate optimum space to the departments from the overall floor area used as selling space at the store. The results here directly impact the layout of the store in terms of which department zone gets how much space, specifications of shelves and fixtures, how broad and wide assortments under a department can be, and so on. Space is measured in square units at the department level.
POG sub-category level using the Macro Space Optimization @Sub-Category task. This task is used to allocate optimum space to the sub-categories under a specific department from the overall space available for the department. The results here directly impact the design and specifications of planograms. Space is measured in linear units at the sub-category level.
Once space allocation has been finalized for the POG departments, optimization is performed at the sub-category level.
In general, the MSO process at both the POG department and POG sub-category levels consists of the following steps:
Review the targets from Category Planning and MFP.
Set the optimization constraints and review the optimization results.
Approve the optimization results.
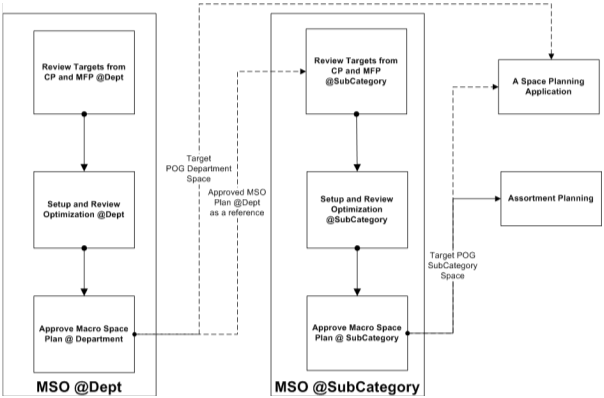
The following flowchart shows the MSO process flow in RCM:
Start with MSO at the department level.
Check the department level optimization results referred by a space management system and MSO @ Sub-Category.
Perform MSO at the sub-category level.
Share the sub-category level optimization results with the ASO process.
This task has the following steps:
To create the workbook:
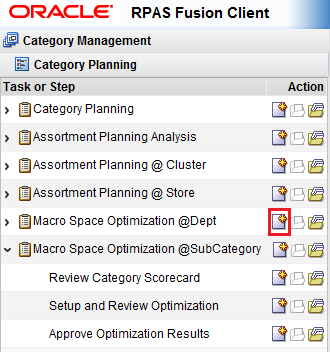
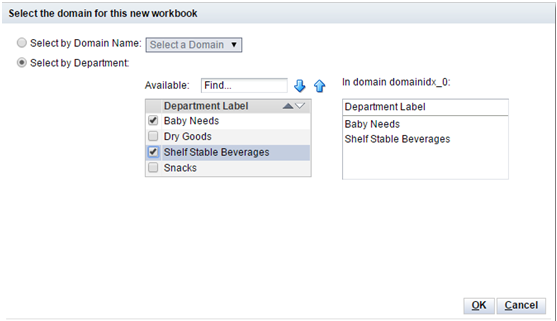
Select the New Workbook icon in the Macro Space Optimization @Dept task.
The workbook wizard opens.
Select the domain name or departments. Click Next.
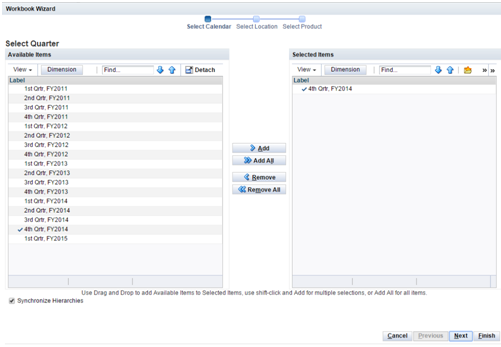
Select the quarters and move them to the Selected Items box. Click Next.
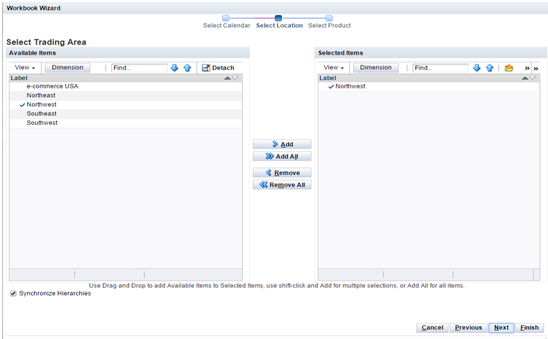
Select the trading areas and move them to the Selected Items box. Click Finish.
The workbook is created.
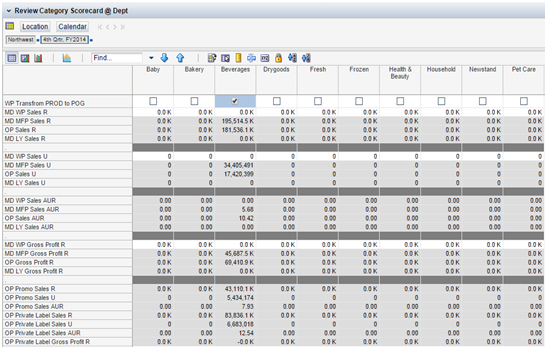
Use this step to review the Category Scorecard. The Category Scorecard presents the Category Plan and Merchandise Financial Plan details.
Use the targets and goals (in the form of sales, gross profit, average inventory, turns, and so on) set as part of Category Planning or Merchandise Financial Planning as a reference while defining the constraints for MSO in order to generate the results at the POG department level.
The Category Scorecard is presented on the POG hierarchy in MSO tasks, unlike in other tasks such as Category Planning and Assortment Planning, where it is presented on the PROD hierarchy. The target plan information available on the PROD hierarchy must be transformed into the POG hierarchy.
The mapping between the PROD and POG hierarchies is maintained in Category Management Administration and is used to transform product hierarchy based targets (from the Category Planning task and MFP application) into POG hierarchy-based targets.
Here is an example of a product to POG hierarchy transformation: In a convenience format store, in the PROD hierarchy, categories or sub-categories, such as butter and cheese, may be mapped to the Dairy Products department, but in the POG hierarchy classification, they are mapped to the Frozen Products POG department or department zone. In such a scenario, the mapping must be defined between the PROD and the POG hierarchies in the Category Management Administration workbook.
Prior to starting this step:
An approved category plan must be available.
A merchandise financial plan must be available and must be imported into RCM.
PROD to POG hierarchy mapping must be defined in Category Management Administration.
Like Sub-Category mapping must be done in Category Management Administration in case new sub-categories are introduced.
After completing this step:
Proceed to the next step, Set Up and Review Optimization, to run MSO.
This step has one view.
Use the Transform PROD to POG Hierarchy custom menu to transform the category plan and merchandise financial plan from the PROD hierarchy to the POG hierarchy to see the targets at the POG Department level.
Note that all the activities in the MSO tasks are done on the POG hierarchy only. Therefore, there is a need to transform (or convert) the PROD hierarchy based targets (received from the Category Planning task and MFP application) to POG hierarchy based targets.
Use this view to review the approved category plan and merchandise financial plan targets. The targets are in the form of Sales R, Sales Units, Gross Profit R, Average Inventory, Turns, and so on, sourced from the Category Planning task (OP measures) and MFP application (MFP measures).
The idea is to align the allocation of space to departments in MSO to these business plans.
The measures constituting a category plan and merchandise financial plan are available on the PROD hierarchy and need to be mapped to the POG hierarchy in this view.
After checking the WP Transform PROD to POG flag measure, run the Transform PROD to POG Hierarchy custom menu to populate the plan measures in this view on the POG hierarchy at the POG Department level.
Figure 5-8 shows an example presenting different measures sourced from the Category Planning task in RCM and MFP application.
Table 5-1 lists the measures available on this view.
Table 5-1 Review Category Scorecard @Dept View Measures
| Label | Description |
|---|---|
|
MD WP Transform PROD to POG |
Flag measure that must be checked prior to running the Transform PROD to POG Hierarchy custom menu. |
|
MD WP Sales R |
Working plan's sales retail value defined on the POG hierarchy for the POG Department. An LY version of this measure (MD LY Sales R) is also available. |
|
MD WP Sales U |
Working plan's sales units defined on the POG hierarchy for the POG Department. An LY version of this measure (MD LY Sales U) is also available. |
|
MD WP Sales AUR |
Working plan's average unit retail value defined on the POG hierarchy for the POG Department. An LY version of this measure (MD LY Sales AUR) is also available. |
|
MD WP Gross Profit R |
Working plan's gross profit value defined on the POG hierarchy for the POG Department. An LY version of this measure (MD LY Gross Profit R) is also available. |
|
OP Sales R |
Approved category plan's (referred to as original plan) sales retail value. It is shared as a target with assortment planning and MSO. |
|
OP Sales U |
Original plan assortment's (approved category plan's) sales units. It is used in assortment planning and MSO as the target sales units. |
|
OP Gross Profit R |
Original plan assortment's (approved category plan's) gross profit value. It is used in assortment planning and MSO as the target gross profit retail value. |
|
OP Sales AUR |
Original plan assortment's (approved category plan's) average unit retail value. It is used in assortment planning and MSO as the target average unit retail value. |
|
OP Promo Sales R |
Original plan's (approved category plan's) promotional sales retail value. It is used in assortment planning and MSO as the target promo sales retail value. |
|
OP Promo Sales U |
Original plan's (approved category plan's) promotional sales units. It is used in assortment planning and MSO as the target promo sales units. |
|
OP Promo Sales AUR |
Original plan's (approved category plan's) average unit retail value. It is used in assortment planning and MSO as the target average unit retail value. |
|
OP Private Label Sales R |
Original plan's (approved category plan's) sales retail value from private label products. It is used in assortment planning and MSO as the target sales retail value for private label products. |
|
OP Private Label Sales U |
Original plan's (approved category plan's) sales units from private label products. It is used in assortment planning and MSO as the target sales units for private label products. |
|
OP Private Label Sales AUR |
Original plan's (approved category plan's) average unit retail value from private label products. It is used in assortment planning and MSO as the target average unit retail value for private label products. |
|
OP Private Label Gross Profit R |
Original plan's (approved category plan's) gross profit retail value from private label products. It is used in assortment planning and MSO as the target gross profit retail value for private label products. |
|
OP Avg Inv R |
Original plan's (approved category plan's) average inventory retail value carried. It is used in assortment planning and MSO as the target average inventory retail value. |
|
OP Turn |
Original plan's (approved category plan's) turns. Turns represent the number of times the average inventory carried can be sold over in a specified period of time. This measure is used in assortment planning and MSO as the target average inventory retail value. |
|
MD WP Sales C |
Working plan's sales cost value defined on the POG hierarchy for the POG Department. An LY version of this measure (MD LY Sales C) is also available. |
Custom Menu
Use the Transform PROD to POG Hierarchy custom menu in this view to transform the PROD hierarchy based plan (Category Plan and Merchandise Financial Plan) measures to the respective POG hierarchy measures at the POG Department level.
This custom menu uses the mapping defined between the PROD and POG hierarchies in Category Management Administration to come up with the POG-based plan measure values.
Note that the measures in this view are only populated after the custom menu runs.
Use this step to run MSO and review the optimization results.
MSO is used to derive and allocate optimum space to department zones or POG departments in a store. An algorithm (in the form of a special expression ASOSpace) is used through a custom menu trigger to identify the appropriate space and corresponding profit, keeping the constraints set in this view under consideration. Space and Profit tables, containing data on space to profit variance (based on historic data), are used by the algorithm and form the basis of the optimization results.
There are two types of MSO:
Space-based: For a given set of space constraints, optimization recommends the maximum profit.
Financial parameter-based: For a given set of gross profit targets, optimization recommends the optimum space.
MSO can be run at the store, store cluster, or trading area level for a set of POG Departments or Department Zones at a store.
To run MSO and review the results:
Set the constraints for optimization mechanics:
Optimization Type and Target Alignment Type: There are two types of optimization: Space-based and financial parameter-based. The space-based optimization type has the target alignment type of Less than or Equal to. For financial parameter-based, the two options include Max Profit Up and Max Profit Down. The combined options include:
Space - Less than or Equal to
Financial - Max Profit Up
Financial - Max Profit Down
Financial Target Metric and Optimization Method: Optimization can be based on the different financial target metrics, which include MFP Gross Profit R and OP Gross Profit R. There is one optimization method available: Optimal.
Set space constraints:
Upper guard rail % or Upper guard rail space: Upper guard rail space is used in optimization to define the upper limit of space allocation for any POG Department, so as to keep the optimization results within an upper bound value of space. It can be defined as a percentage of the current space.
Lower guard rail % or Lower guard rail space: Similar to the upper guard rail, lower guard rail space is defined as the lower limit of space allocation for any POG Department and can also be defined as a percentage of current space.
Max and min space: Max and min space values represent the highest upper limit and lowest limit of space that can be made available to any POG Department. The optimization process picks the lower of the max space and upper guard rail space and the higher of the min space and lower guard rail space as inputs while setting the range of optimization results.
Current space, total available space, and space increments for POG Departments: Current space represents the space allocated to any POG Department in the current store layout. Total available space represents the total selling area of the store. Space increments are based on the shelves and fixtures specifications for different POG Departments, which determine the minimum length by which current space can be changed for a specific POG Department.
Set the optimization scope per the business requirements:
Select the POG departments to be included in the optimization.
Lock the current space for the POG departments, if required.
Select the mandatory POG departments. Mandatory POG departments should definitely be part of the final assortment. Checking the mandatory flag for a POG department ensures that it gets a higher priority in space allocation from the available space.
After setting the constraints, run the Optimize Dept custom menu.
Review the optimization results in the form of recommended space and respective gross profit by comparing them with the set space constraints and targets in the Category Scorecard.
Review the optimization results in the form of histograms.
Prior to starting this step:
Review the targets in the Category Scorecard.
Ensure that the Space Profit tables are populated.
After completing this step:
Proceed to the Approve Optimization Results step to approve the optimization results.
This step has the following views:
Use the Optimize Dept custom menu to run the optimization at the POG department level once all the constraints have been defined.
Use this view to do the following:
Set the constraints for MSO for the POG Departments or departments in the store.
Run MSO using the Optimize Dept custom menu.
Review the results from the optimization in the form of recommended space and gross profit retail.
Define the following constraints:
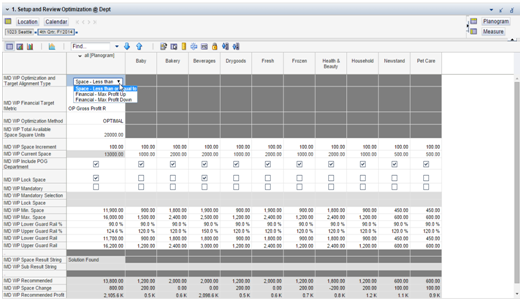
Constraints for Optimization Mechanics: These constraints define the mechanics of the MSO run. The measures that must be defined are: MD WP Optimization and Target Alignment Type, and MD WP Financial Target Metric.
Space constraints: Space constraints define the range (upper and lower limits) of space allocation, current space of a POG Department, and total available selling space at the store. The measure list to be defined here consists of: MD WP Total Available Space Square Units, MD WP Space Increment, MD WP Current Space Square Units, MD WP Min. Space, MD WP Max. Space, MD WP Lower Guard Rail %, MD WP Upper Guard Rail %, MD WP Lower Guard Rail Space, and MD WP Upper Guard Rail Space.
The optimization algorithm triggered by the custom menu picks the following inputs when it comes to determining the range of space allocation:
The lower limit of the space allocation range is the higher value of the two measures: MD WP Max. Space and MD WP Upper Guard Rail Space.
The upper limit of the space allocation range is the lower value of the two measures: MD WP Min. Space and MD WP Lower Guard Rail Space.
Optimization Scope constraints: This set of measures is used to define the scope of MSO for the POG departments in a store. The measures that need to be defined here consist of the following flag measures: MD WP Include POG Department, MD WP Lock Space, and MD WP Mandatory.
For information on the measure definitions, see Table 5-2.
This view must be viewed at the POG Department and all Planogram level in outline view mode. Optimization can be run at the following levels:
Store, cluster, or trading area level on the location hierarchy.
Quarter, Half Year, or Year level.
Figure 5-9 shows an example of this view with the constraints set and optimization results derived at the POG Department level.
Table 5-2 lists the measures available on this view.
Table 5-2 1. Set Up and Review Optimization @ Dept View Measures
| Label | Description |
|---|---|
|
MD WP Optimization Target and Alignment Type |
Used to define the type of MSO and type of target alignment from a drop-down selection. The following options are available for selection: Space - Less than or Equal to, Financial - Max Profit Up, and Financial - Max Profit Down. |
|
MD WP Financial Target Metric |
Used to assign the target metric to be used as the basis for MSO. The options available are: MFP Gross Profit R and OP Gross Profit R. |
|
MD WP Optimization Method |
Method adopted by MSO is defined through this measure. There is one optimization method available: Optimal. |
|
MD WP Total Available Space Square Units |
Represents the total available space of the stores in square units used to allocate space to the POG Departments in the upcoming space plan or working plan. |
|
MD WP Space Increment |
Represents the incremental value of space in square units by which the space should be increased or decreased for a POG Department. This is based, in general, on the shelves and fixture specifications used in the department and store. |
|
MD WP Current Space Square Units |
Represents the current space, in square units, assigned to a POG Department at a store. |
|
MD WP Include POG Department |
Flag measure used to mark the POG Departments which should participate in MSO for space allocation. |
|
MD WP Lock Space |
Flag measure used to lock space for a POG Department in the MSO run. It is used to maintain the current space allotted to the POG Department in the upcoming space plan or working plan. The current space of the locked POG Department is deducted from the total available space to calculate the effective total available space used for allocating space for the rest of the POG Departments participating in MSO. |
|
MD WP Mandatory |
Flag measure used to mark the mandatory POG Departments, which should be given higher priority in space allocation from the total available space by MSO. |
|
MD WP Lock Space Selection Error |
Measure used to present the error messages if the Lock Space measure is checked for a POG Department without including the POG Department (through Include flag measure) for the MSO run. |
|
MD WP Mandatory Selection Error |
Measure used to present the error messages if the Mandatory measure is checked for a POG Department without including the POG Department (through Include flag measure) for the MSO run. |
|
MD WP Min. Space |
Minimum amount of space that can be allocated to a POG Department. |
|
MD WP Max. Space |
Maximum amount of space that can be allocated to a POG Department. |
|
MD WP Lower Guard Rail % |
User-defined lower limit space percentage output for a POG Department required from an optimization run. It is expressed as an absolute percentage of current space of a POG Department. It is used to control the lower limit of recommended space output for a POG Department, from an optimization run, so as to keep it within the range per the business requirements. |
|
MD WP Upper Guard Rail % |
User-defined upper limit space percentage output for a POG Department required from an optimization run. It is expressed as an absolute percentage of the current space of a POG Department. It is used to control the upper limit of recommended space output for a POG Department, from an optimization run, so as to keep it within the range per the business requirements. |
|
MD WP Lower Guard Rail Space |
User-defined lower limit space output for a POG Department required from the optimization run. It can be directly entered or calculated on the basis of MD WP Lower Guard Rail %. It is used to control the lower limit of recommended space output from an optimization run, so as to keep it within the range per the business requirements. |
|
MD WP Upper Guard Rail Space |
User-defined upper limit space output for a POG Department required from the optimization run. It can be directly entered or calculated on the basis of MD WP Upper Guard Rail %. It is used to control the upper limit of recommended space output from an optimization run, so as to keep it within the range per the business requirements. |
|
MD WP Space Result String |
Measure used to present the error messages applicable at the aggregate level in an optimization run. For example: Max Capacity is invalid. |
|
MD WP Sub Result String |
Measure used to present the specific error messages in the optimization run. It specifically points to the POG Department where some user-defined constraints are off-the-mark. For example: Invalid Min Max Constraints for a specific POG Department. |
|
MD WP Recommended Space |
Recommended space output for a POG Department from an MSO run corresponding to the recommended gross profit retail. The CP version of the measure is used to store the approved results. |
|
MD WP Space Change |
Difference between the recommended space and current space for a POG Department. |
|
MD WP Recommended Gross Profit R |
Recommended gross profit retail output for a POG Department from an MSO run corresponding to the recommended space. CP version of the measure is used to store the approved results. |
|
MD WP Gross Profit Change |
Difference between the recommended gross profit and working plan gross profit retail for a POG Department. |
Custom Menu
This view supports the Optimize Dept custom menu, which is used to run MSO at the POG department level. All the POG departments or department zones in the stores are allocated space using this custom menu. This custom menu uses an embedded special expression/API to recommend the most appropriate space and gross profit retail values in-line with the defined constraints and on the basis of the space profit tables.
Once the constraints are set, use this custom menu to run MSO to generate recommended space and gross profit retail values for the POG Departments.
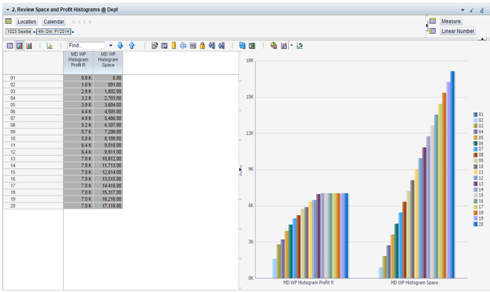
Use this view to review the MSO results in the form of histograms. Histograms represent a series of results in the form of cumulative recommended space and cumulative recommended gross profit retail values, while the optimization process allocates space to POG departments step by step. These results are derived by the special expression/API while allocating space to the individual POG departments from the total available space.
The histograms graphically represent the relation and variation between allocated space and respective gross profit retail return for the POG Departments in a store.
Figure 5-10 represents a sample histogram for a set of optimization results.
Table 5-3 lists the measures available on this view.
Table 5-3 2. Review Space and Profit Histograms @Dept View Measures
| Label | Description |
|---|---|
|
MD WP Histogram Space |
Cumulative recommended space output from an MSO run while allocating space to individual POG departments in the store. |
|
MD WP Histogram Profit R |
Cumulative recommended gross profit retail output corresponding to the recommended space from an MSO run while allocating space to individual POG departments in the store. |
Use this step to approve the MSO results. Optimization results consist of the recommended space and gross profit retail values. Once approved, the optimization results for the POG departments should be shared with a space management system for the new store layouts to be worked out. These results are also used as a reference for MSO at the POG sub-category level.
Prior to starting this step:
MSO must be conducted and the results obtained from it, in-line with the targets.
After completing this step:
This is the last step in the MSO process at the POG department level. With the approval of the MSO results at the POG department level, the next step is to perform MSO at the POG sub-category level.
This step has one view.
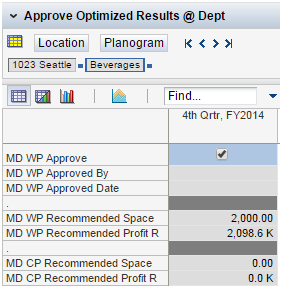
Use the Approve Dept custom menu to approve the optimization results for the POG departments.
Use this view to approve the optimization results from an MSO run. Optimization results consist of the recommended space and recommended gross profit retail.
Mark the POG departments that must be approved and run the Approve Dept custom menu to complete the approval process. Once approved, the results stored in the working plan measures are copied to the CP version measures. These results must be used as a reference while performing MSO at the POG sub-category level.
Note that the space at the POG department level is measured in square units and at the POG sub-category level it is measured in linear units.
Table 5-4 lists the measures available on this view.
Table 5-4 Approve Optimization Results @Dept View Measures
| Label | Description |
|---|---|
|
MD WP Recommended Space |
Recommended space output for a POG Department from an MSO run corresponding to the recommended gross profit retail. The CP version of the measure (MD CP Recommended Space) is used to store the approved results. |
|
MD WP Recommended Profit R |
Recommended gross profit retail output for a POG department from an MSO run corresponding to the recommended space. the CP version of the measure (MD CP Recommended Profit R) is used to store the approved results. |
|
MD WP Approve |
A Boolean flag measure which needs to be checked before running the Approve Dept custom menu. |
|
MD WP Approved By |
User ID of the approver for the POG Department level optimization results. |
|
MD WP Approved Date |
The date on which the POG Department level optimization results were approved. |
Custom Menu
Use the Approve Dept custom menu to approve the optimization results for POG departments. On approval, the custom menu copies the optimization results stored in the WP measures to the CP version measures.