Performance Analyzer New Features
This section summarizes the new features of the Performance Analyzer and related tools in this release. For more information, see the Help in Performance Analyzer.
-
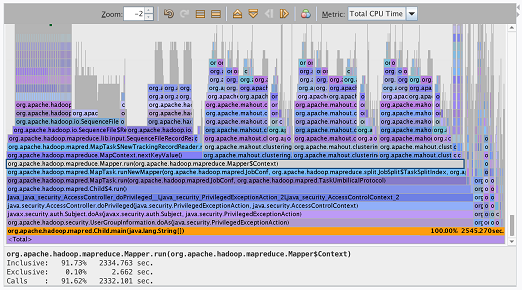
New Visual Call Tree View — A new view, Visual Call Tree, shows the hot paths of execution in a graphical format called a flame graph.

For more information, see Flame Graph View in Oracle Developer Studio 12.6: Performance Analyzer manual.
-
New Support for Scala Applications — The initial support for the analysis of Scala applications has been added.
-
Enhancements to Analyze GNU Inlining — For binaries compiled with GNU compilers, the PCs and Disassembly views will now identify inlined instructions and the source associated with the leaf-most inlined code.
-
Memoryspace Enhancements — The Memoryspace view names have been updated to provide user-level view name and descriptions.
-
Improved Analysis of <no Java callstack recorded> — When a JVM cannot capture the current Java callstack for a given sample, Analyzer will report the sample as <no Java callstack recorded>. In this release, the PCs view will describe the error codes associated with missing Java callstacks. In addition, you can use a filter to isolate <no Java callstack recorded> and switch to Machine Mode to analyse the missing Java callstacks and functions.
-
Large Jar File Support — Java and Scala applications that use large jar files are now supported.
-
Intel Compiler -ipo Support — Performance Analyzer now supports code compiled with the Intel –ipo flag.
-
Navigation Features in View History — New controls support navigation to the previously opened views.