Collecting and Displaying Data
You can use the Code Analyzer tools to collect up to three types of data.
Collecting and Displaying Static Error Data
When you build a binary using the –xprevise compiler option, the compiler automatically extracts static errors and puts the data in a static subdirectory in a binary-name.analyze directory in the same directory as the source code. For a list of the types of static errors found by the compiler, see Static Code Issues.
-
In your sample directory, build the application by typing the following:
Note - The –xprevise option is synonymous with –xanalyze=code, which is deprecated.-
On Oracle Solaris:
$ cc -xprevise main.c previse*.c sample1.c sample2.c sample3.c
-
On Linux:
$ cc -xannotate -xprevise main.c previse*.c sample1.c sample2.c sample3.c
Note - You are not compiling sample4.c for this portion of the tutorial.The static error data is written to the sample/a.out.analyze/static directory.
-
-
Start the Code Analyzer GUI to view the results:
$ code-analyzer a.out &
-
The Code Analyzer GUI opens and the Results tab displays the static code issues found during compilation. The text at the top left of the Results tab indicates that thirteen static code issues were found.
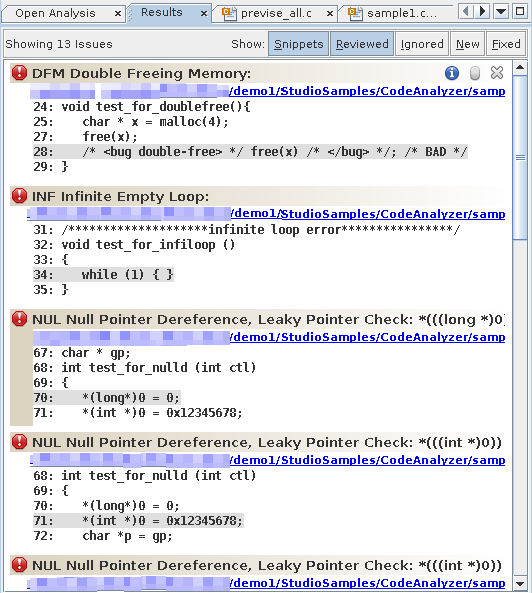
For each issue, the tab displays the issue type, the path name of the source file in which the issue was found, and a code snippet from that file with the relevant source line highlighted.
-
To see more information about the first issue, a Double Freeing Memory error, click the error icon
 .
.The stack trace for the issue opens displaying the error path:
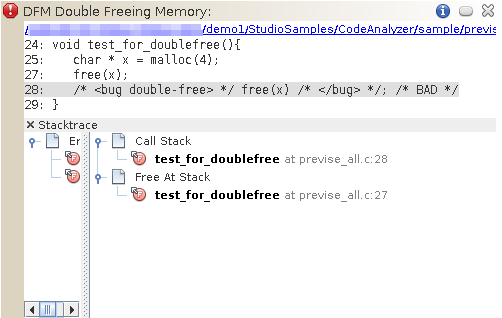
Notice that when you opened the stack trace, the icon in the upper right corner of the issue changed from
 to
to  to indicate that you have reviewed the issue.
Note - You can hide the issues you have reviewed by clicking the Reviewed button at the top of the Results tab. Clicking the button
again unhides the issues.
-
Click the same error icon to close the stack trace.
-
Click the warning icon
 of one of the Uninitialized Memory Read warnings to
open the stack trace.
of one of the Uninitialized Memory Read warnings to
open the stack trace.The error path for this issue contains many more function calls than the one for the Double Freeing Memory issue.
-
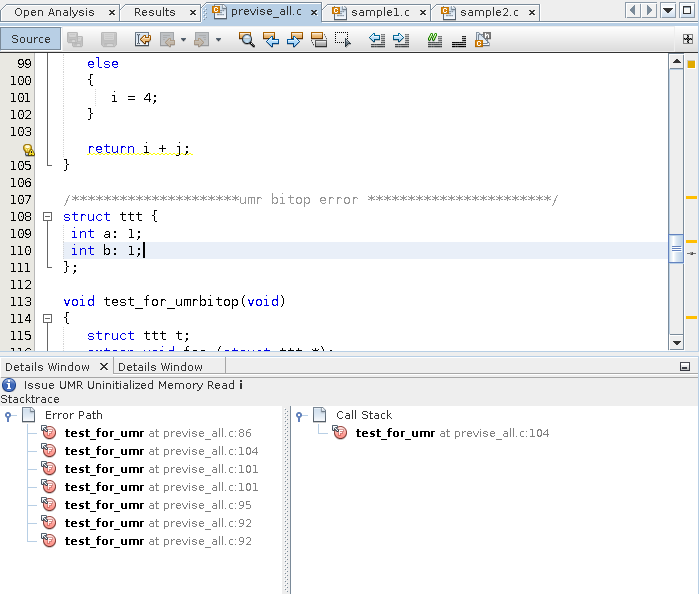
Double click the first function call.
The source file opens with that call highlighted. The error path is displayed in a Details Window below the source code.
-
Double-click the other function calls in the error path to follow the path through the code that leads to the error.
-
Click the Info button
 to the left of the issue description to see more
information about the UMR error type.
 A description of the error type, including a code example and possible causes, is displayed in the online help browser.
-
Close the Code Analyzer GUI by pressing the X in the upper right corner.
Collecting and Displaying Dynamic Memory Usage Data
Regardless of whether you have collected static data, you can compile, instrument, and run your application to collect dynamic memory access data. For a list of the dynamic memory access errors found by instrumenting your application with discover and then running it, see Dynamic Memory Access Issues.
-
In your sample directory, build the sample application with the –g option.
This option generates debug information that enables Code Analyzer to display source code and line number information for errors and warnings.
-
On Oracle Solaris:
$ cc -g main.c previse*.c sample1.c sample2.c sample3.c
-
On Oracle Linux:
$ cc -xannotate -g main.c previse*.c sample1.c sample2.c sample3.c
Note - You are not compiling sample4.c for this portion of the tutorial. -
-
Save a copy of the binary to use when you collect coverage data because you cannot instrument a binary that is already instrumented.
$ cp a.out a.out.save
-
Instrument the binary with discover.
$ discover -a a.out
-
Run the instrumented binary to collect the dynamic memory access data.
$ ./a.out
The dynamic memory access error data is written to the sample/a.out.analyze/dynamic directory.
-
Start the Code Analyzer GUI to view the results.
$ code-analyzer a.out &
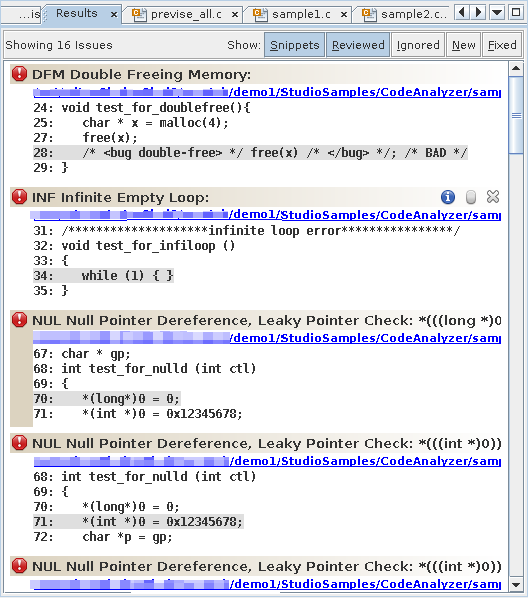
The Results tab shows both static issues and dynamic memory issues. The background color behind an issue description indicates whether it is a static code issue (tan) or a dynamic memory access issue (pale green).
-
To filter the results and show just the dynamic memory issues, select the Dynamic option in the Issues tab.
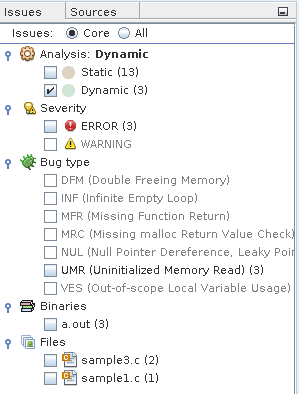
The Results tab now shows just the three core dynamic memory issues.
Note - Core issues are issues that, when fixed, are likely to eliminate the other issues. A core issue usually combines several of the issues listed in the All view because, for example, those issues have a common allocation point or occur at the same data address in the same function. -
To see all of the dynamic memory issues, select the All radio button at the top of the Issues tab. The Results tab now displays six dynamic memory issues.
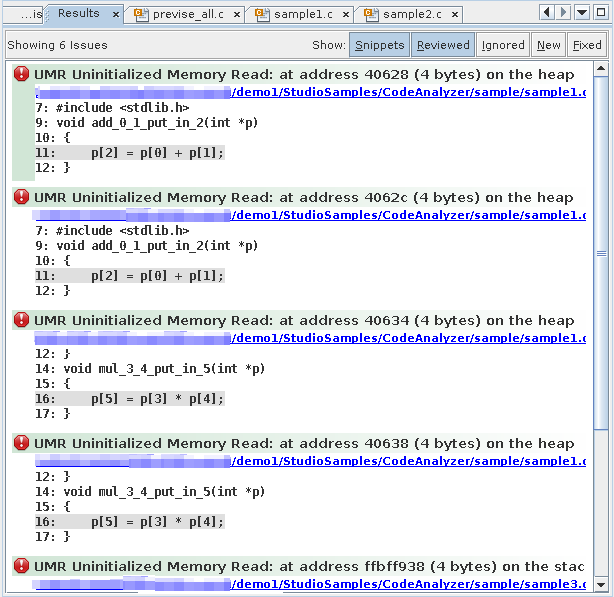
Look at the three issues that were added to the display and see how they are related to the core issues. Fixing the cause of the first issue in the display is likely also to eliminate the second and third issues.
To hide the other dynamic memory access issues while you investigate the first one, click the Ignore button
 for each of the issues.
Note - You can later redisplay the closed issues by clicking the Ignored button at the top of the Results tab. -
Investigate the first issue by clicking the error icon to display the stack trace.
For this issue, the stack trace includes the Call Stack and the Allocated At Stack.
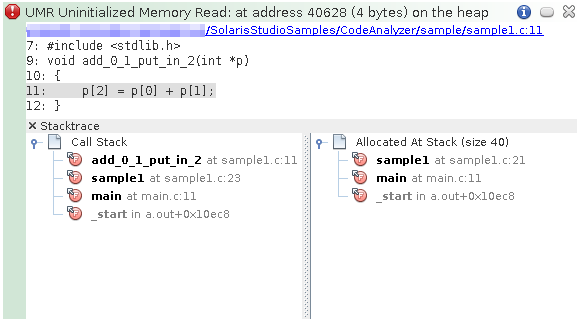
-
Double-click function calls in the stacks to see the associated lines in the source file.
When the source file opens, the stack trace is displayed in a Details window below the file.
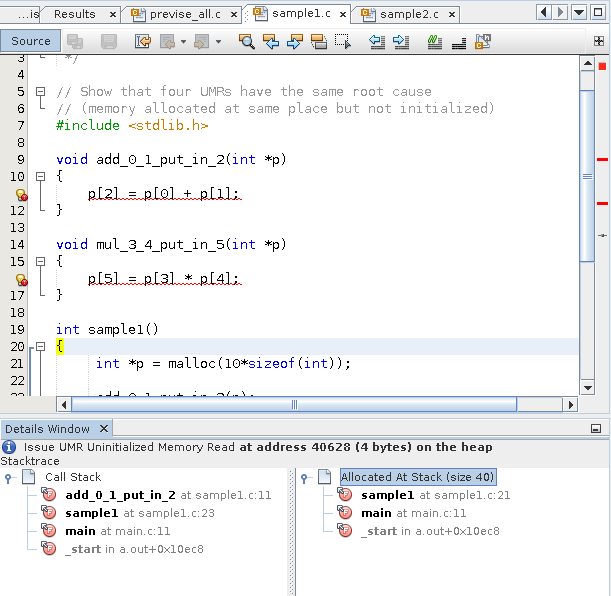
-
Close the Code Analyzer GUI by pressing the X in the upper right corner.
Collecting and Displaying Code Coverage Data
Regardless of whether you have collected static data or dynamic memory access data, you can compile, instrument, and run your application to collect code coverage data. Note that when you built application with the –g option before you collected dynamic memory error data, you saved a copy of the binary before instrumenting it.
-
Copy the saved binary to instrument for coverage data collection.
$ cp a.out.save a.out
-
Instrument the binary with uncover.
$ uncover a.out
-
Run the instrumented binary to collect the code coverage data.
$ ./a.out
The code coverage data is written to an a.out.uc directory in your sample directory.
-
Run uncover on the a.out.uc directory.
$ uncover -a a.out.uc
The code coverage data is written to the sample/a.out.analyze/uncover directory..
-
Start the Code Analyzer GUI to view the results:
$ code-analyzer a.out &
The Results tab shows static issues, dynamic memory issues, and code coverage issues.
-
To filter the results and show just the code coverage issues, select the Coverage option in the Issues tab.
The Results tab now shows just the twelve code coverage issues. The description of each issue includes a potential coverage percentage, which indicates the percentage of coverage that will be added to the total coverage for the application if a test covering the relevant function is added.
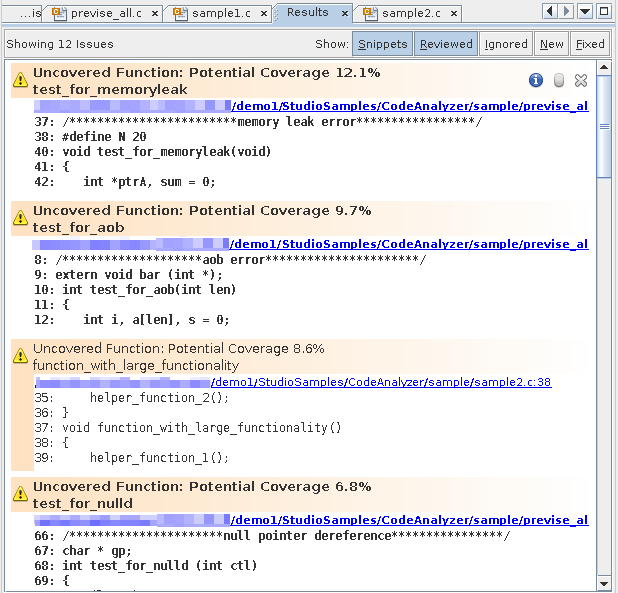
Tip - To see all the issues without scrolling up and down, click the Snippets button at the top of the Results tab to hide the code
snippets.
In the Issues tab, nine of the coverage issues are in the previse_all.c source file, three are in sample2.c, and one is in previse_1.c.
-
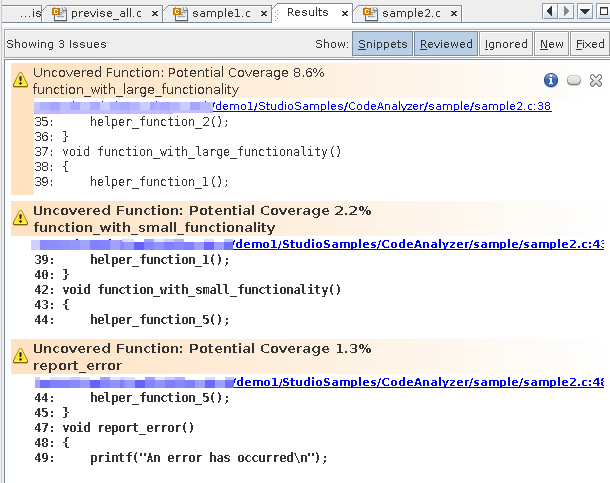
To show just the issues for the sample2.c file, select the option for that file on the Issues tab.
The Results tab now shows just the three code coverage issues found in sample2.c.
-
Open the source file by clicking the source file path link in one of issues. Scroll down in the source file until you see the warning icons in the left margin.
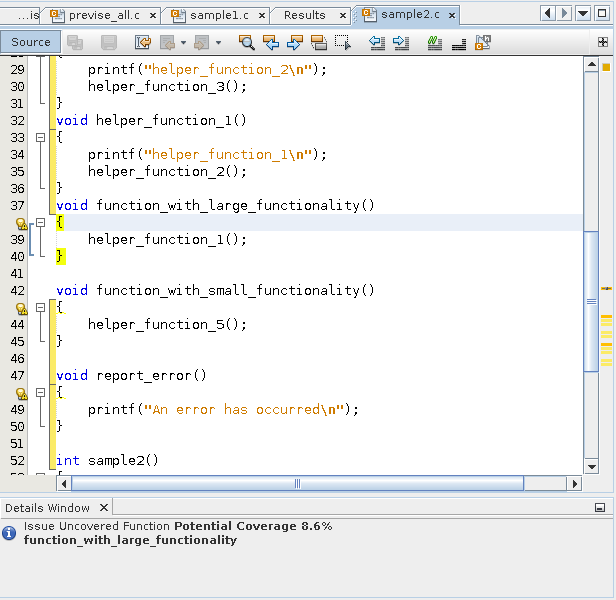
Code that is not covered is marked with a yellow bracket.
The coverage issues found in the file are marked with warning icons
 .
.