Examining Mixed Java and C++ Code
This section features the Call Tree view and Source view, and shows you how to see the relationships between calls from Java and C++ and back again. It also shows how to add the Disassembly view to the navigation panel.
-
Select each of the functions at the top of the list in the Function view in turn, and examine the detailed information in the Selection Details window.
Note that for some functions the Source File is reported as jsynprog.java, while for some others it is reported as cloop.cc. That is because the jsynprog program has loaded a C++ shared object named libcloop.so, which was built from the cloop.cc C++ source file. Performance Analyzer reports calls from Java to C++ and vice-versa seamlessly.
-
Select the Call Tree in the navigation panel.
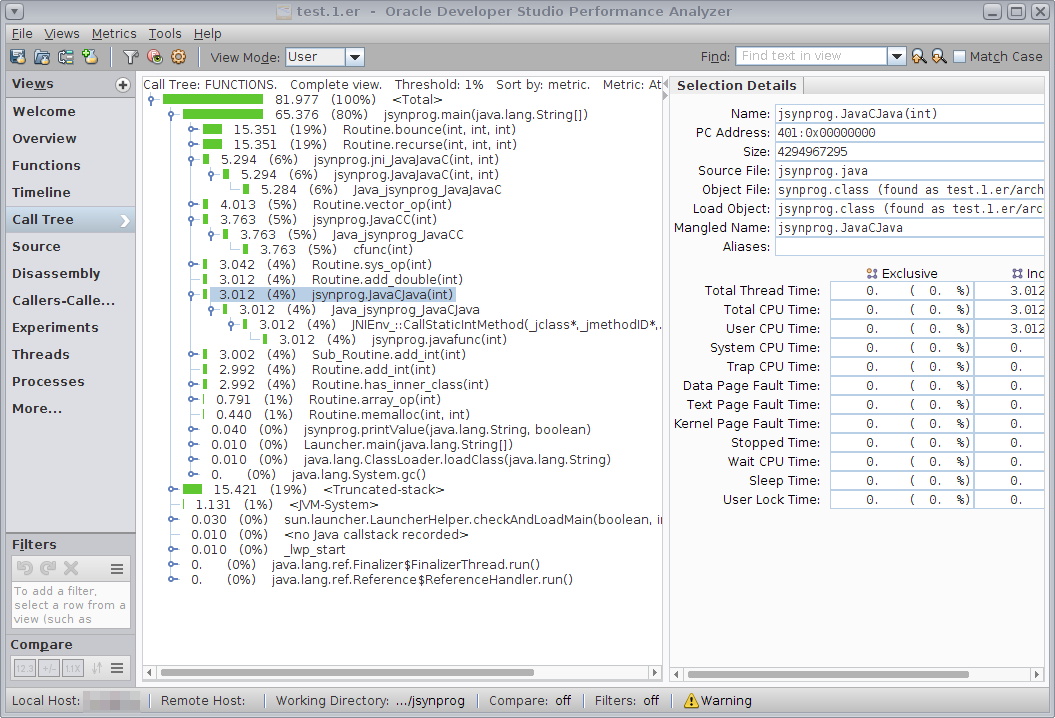
The Call Tree view shows graphically how these calls between Java and C++ are made.
-
In the Call Tree view, do the following to see the calls from Java to C++ and back to Java:
-
Expand the lines referring to the various functions with "C" in their name.
-
Select the line for jsynprog.JavaCC(). This function comes from the Java code, but it calls into Java_jsynprog_JavaCC() which comes from the C++ code.
-
Select the line for jsynprog.JavaCJava(). This function also comes from the Java code but calls Java_jsynprog_JavaCJava() which is C++ code. That function calls into a C++ method of the JNIEnv_::CallStaticIntMethod() which calls back into Java to the method jsynprog.javafunc().
-
-
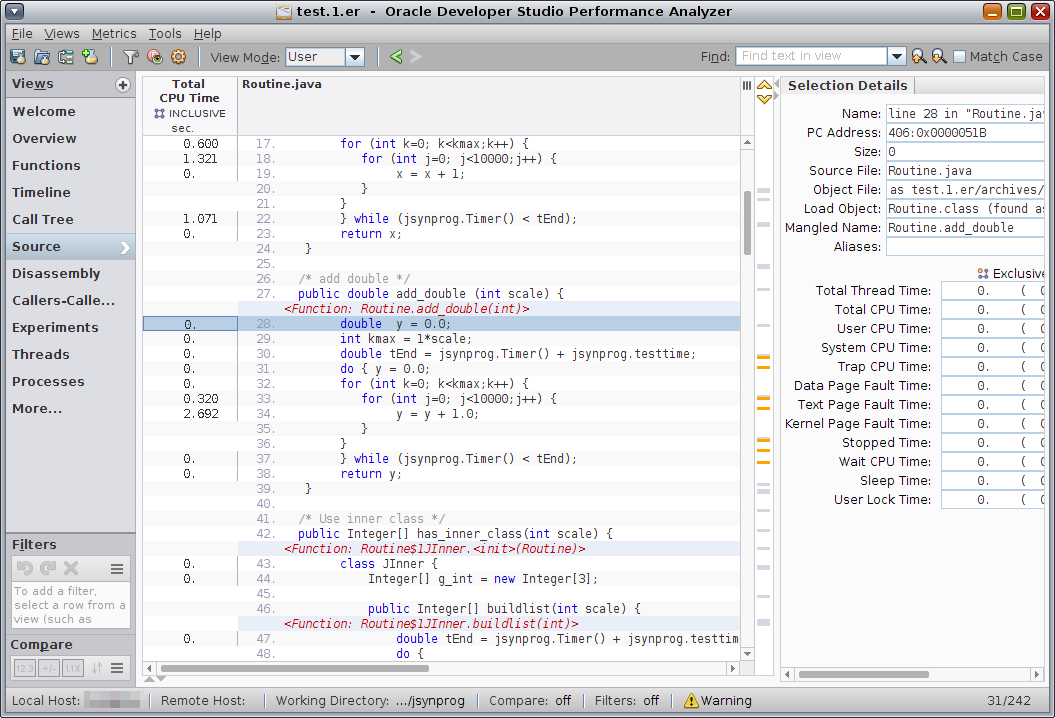
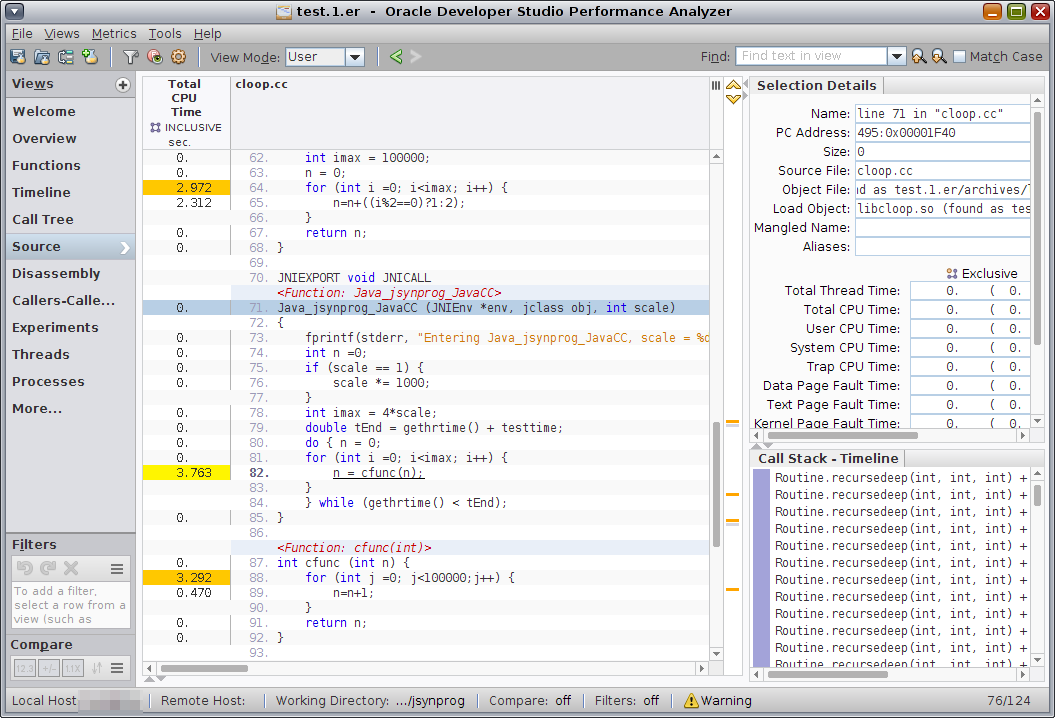
Select a method from either Java or C++ and switch to the Source view to see the source shown in the appropriate language along with performance metrics.
An example of the Source view after selecting a Java method is shown below.
An example of the Source view after selecting a C++ method is shown below.
-
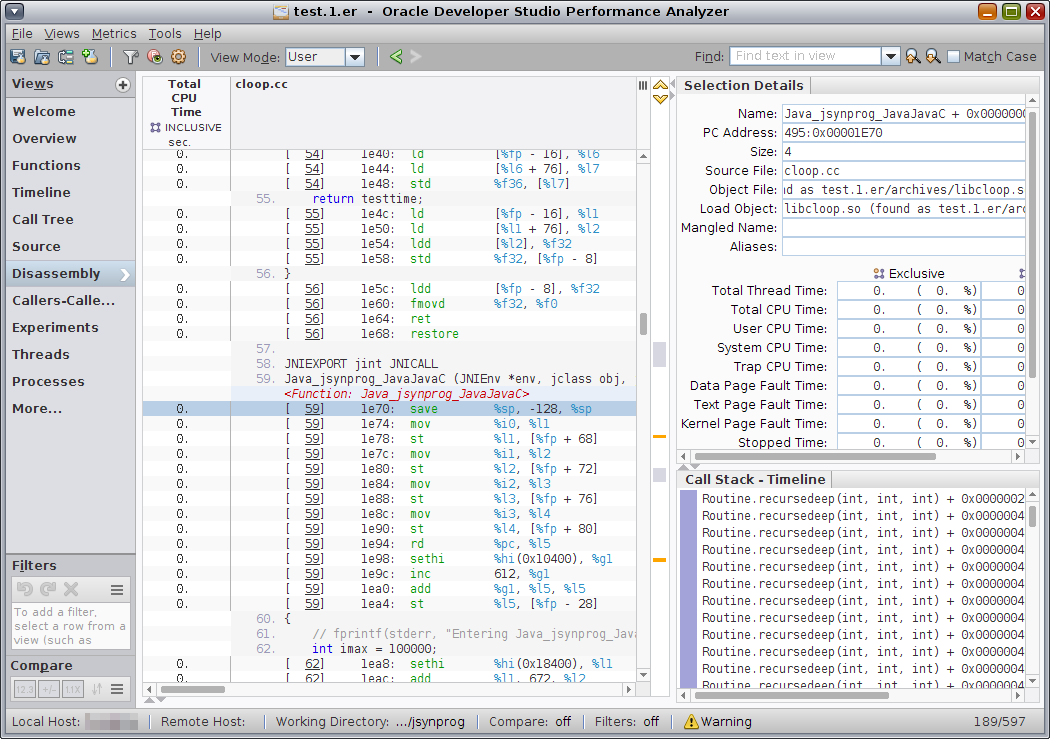
If you don't already see the Disassembly tab in the navigation panel, add the View by clicking the + button next to the Views label at the top of the navigation panel and selecting the check box for Disassembly.
The Disassembly view for the function that you last selected is displayed. For a Java function, the Disassembly view shows Java byte code, as shown in the following screen shot.
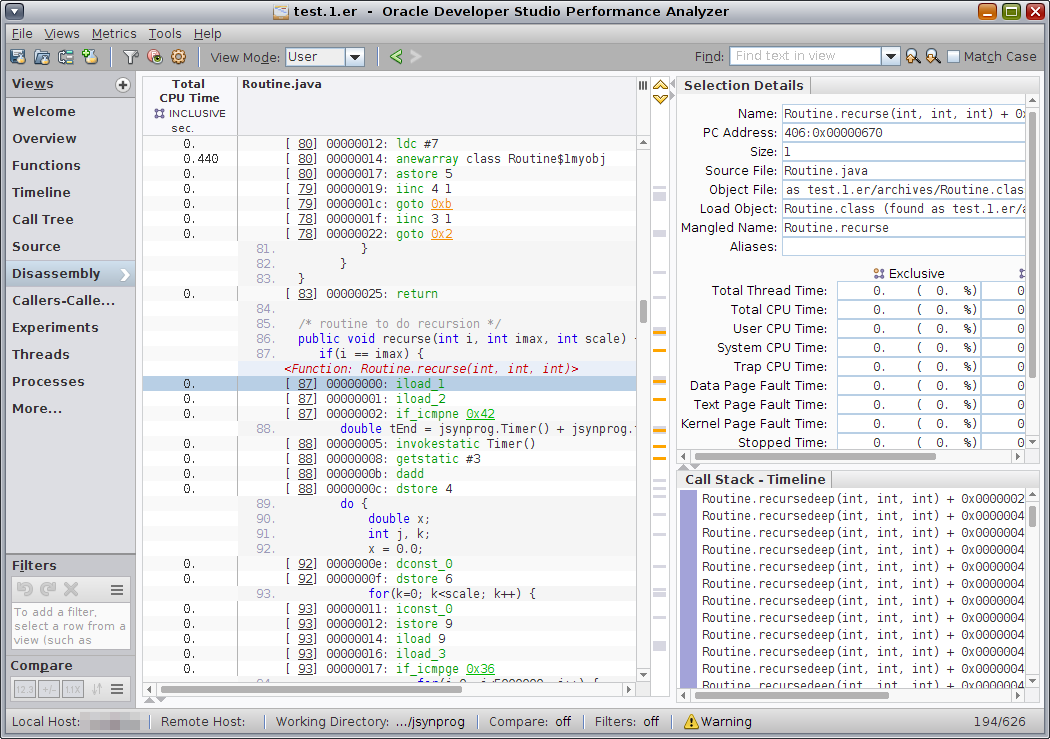
For a C++ function, the Disassembly view shows native machine code, as shown in the following screen shot.
The next section uses the Disassembly view further.