Understanding the JVM Behavior
This section shows how to examine what is occurring in the JVM by using filters, Expert Mode, and Machine Mode.
-
Select the Functions view and find the routine named <JVM-System>.
You can find it very quickly using the Find tool in the tool bar if you type <JVM and press Enter.
In this experiment, <JVM-System> consumed about one second of Total CPU time. Time in the <JVM-System> function represents the workings of the JVM rather than the user code.
-
Right-click on <JVM-System> and select "Add Filter: Include only stacks containing the selected functions".
Notice that the filters panel below the navigation panel previously displayed No Active Filters and now shows 1 Active Filter with the name of the filter that you added. The Functions view refreshes so that only <JVM-System> is remaining.
-
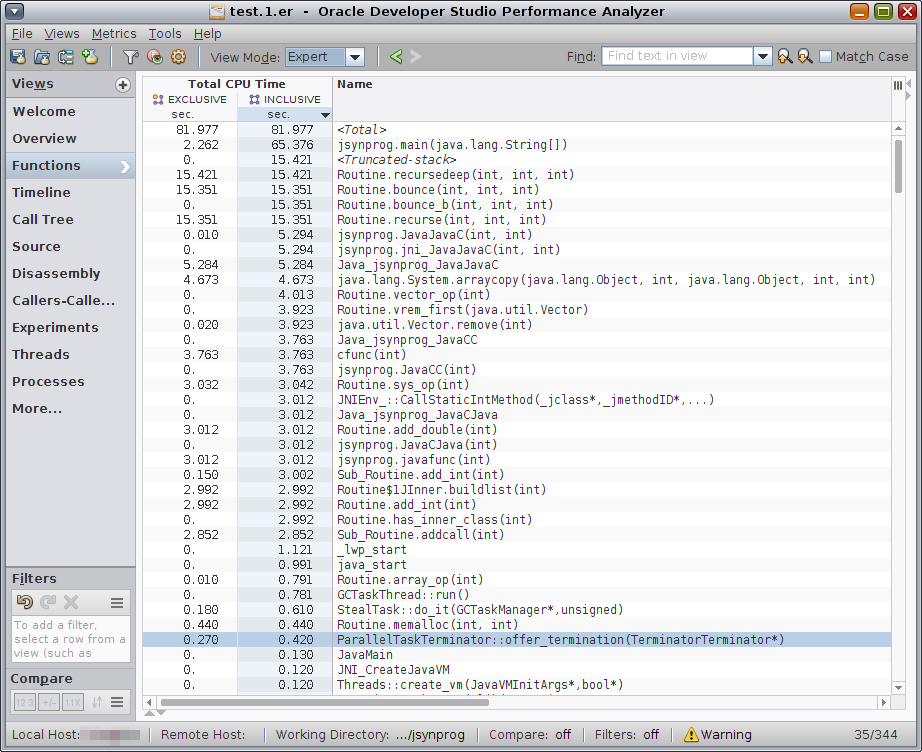
In the Performance Analyzer tool bar, change the view mode selector from User Mode to Expert Mode.
The Functions view refreshes to show many functions that had been represented by <JVM-System> time. The function <JVM-System> itself is no longer visible.
-
Remove the filter by clicking the X in the Active Filters panel.
The Functions view refreshes to show the user functions again, but the functions represented by <JVM-System> are also still visible while the <JVM-System> function is not visible.

Note that you do not need to perform filtering to expand the <JVM-System>. This procedure includes filtering to more easily show the differences between User Mode and Expert Mode.
To summarize: User Mode shows all the user functions but aggregates all the time spent in the JVM into <JVM-System> while Expert Mode expands that <JVM-System> aggregation.
Next you can explore Machine Mode.
-
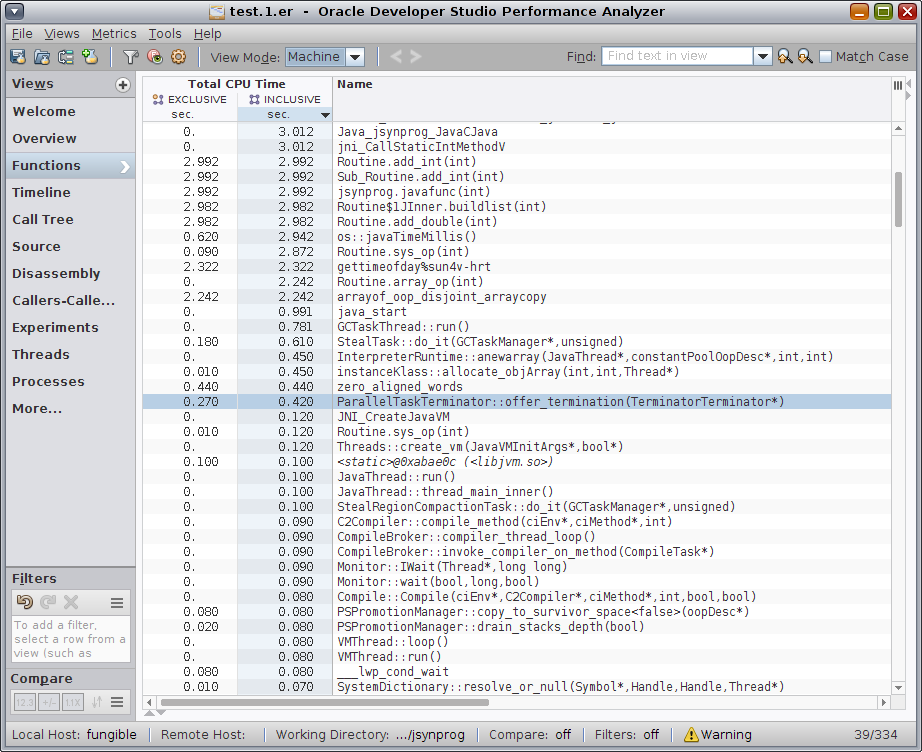
Select Machine Mode in the view mode list.

In Machine Mode, any user methods that are interpreted are not shown by name in the Functions view. The time spent in interpreted methods is aggregated into the Interpreter entry, which represents that part of the JVM that interpretively executes Java byte code.
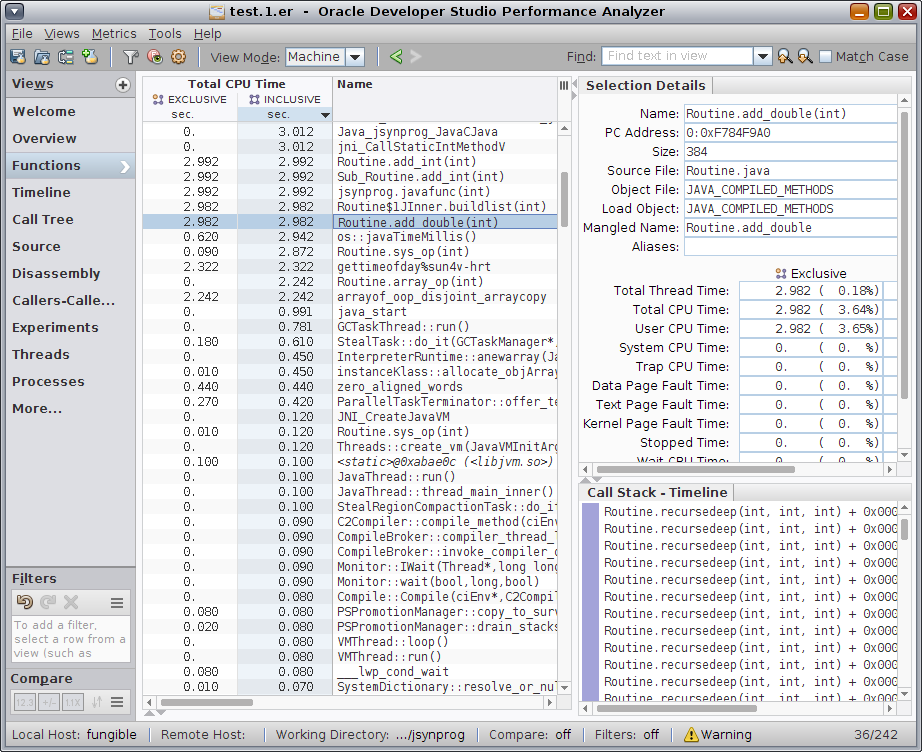
However, in Machine Mode the Functions view displays any user methods that were HotSpot-compiled. If you select a compiled method such as Routine.add_int(), the Selection Details window shows the method's Java source file as the Source File, but the Object File and Load Object are shown as JAVA_COMPILED_METHODS.

-
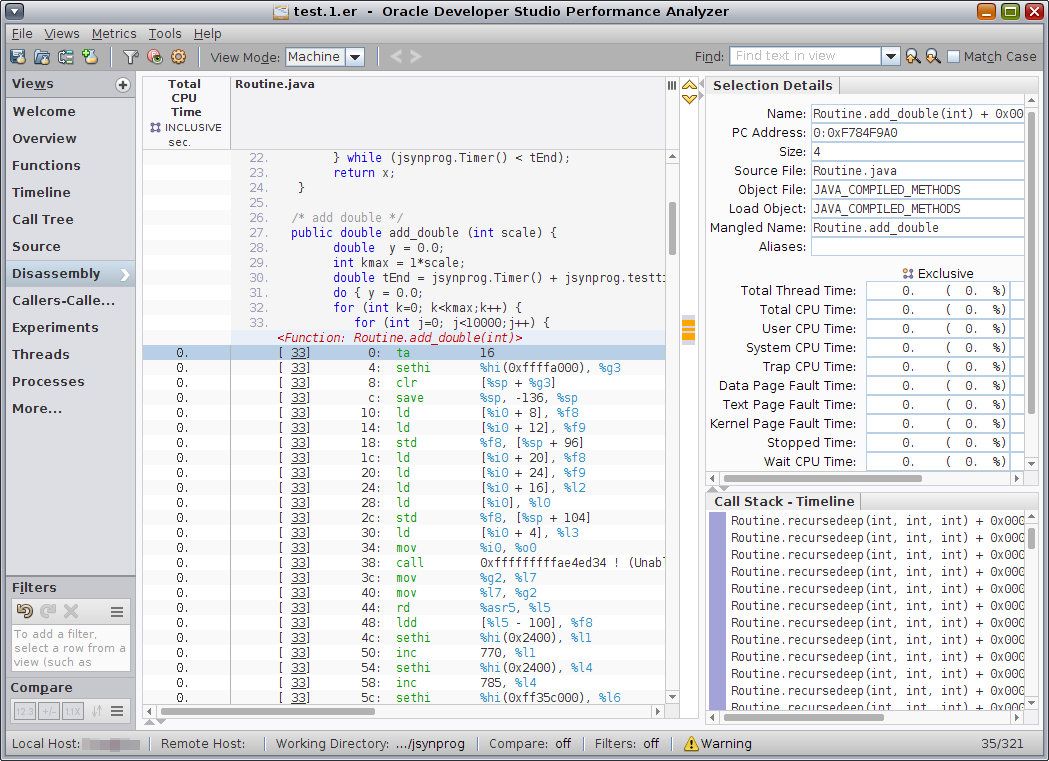
While still in Machine Mode, switch to the Disassembly view while a compiled method is selected in the Functions view.
The Disassembly view shows the machine code generated by the HotSpot Compiler. You can see the Source File, Object File and Load Object names in the column header above the code.

The Total CPU Time shown on most of the visible lines is zero, because most of the work in that function is performed further down in the code.
Continue to the next section.