| Oracle® Retail Service Backbone Retail Integration Console Guide 14.0 E49444-01 |
|

 Previous |
 Next |
| Oracle® Retail Service Backbone Retail Integration Console Guide 14.0 E49444-01 |
|
Previous |
Next |
Performance and diagnostics page shows performance graphs, configuration files, problematic interfaces and logs in addition to the ability to ping services.
The left hand menu allows choosing between RIB and RSB. Depending on the selection RSB or RIB related pages are displayed. By default we show the RSB Performance page.
In this release RIC does not show Performance, Problematic Interfaces, Health Check, System Logs and Trace and Audit logs for RIB. These pages are available only for RSB.
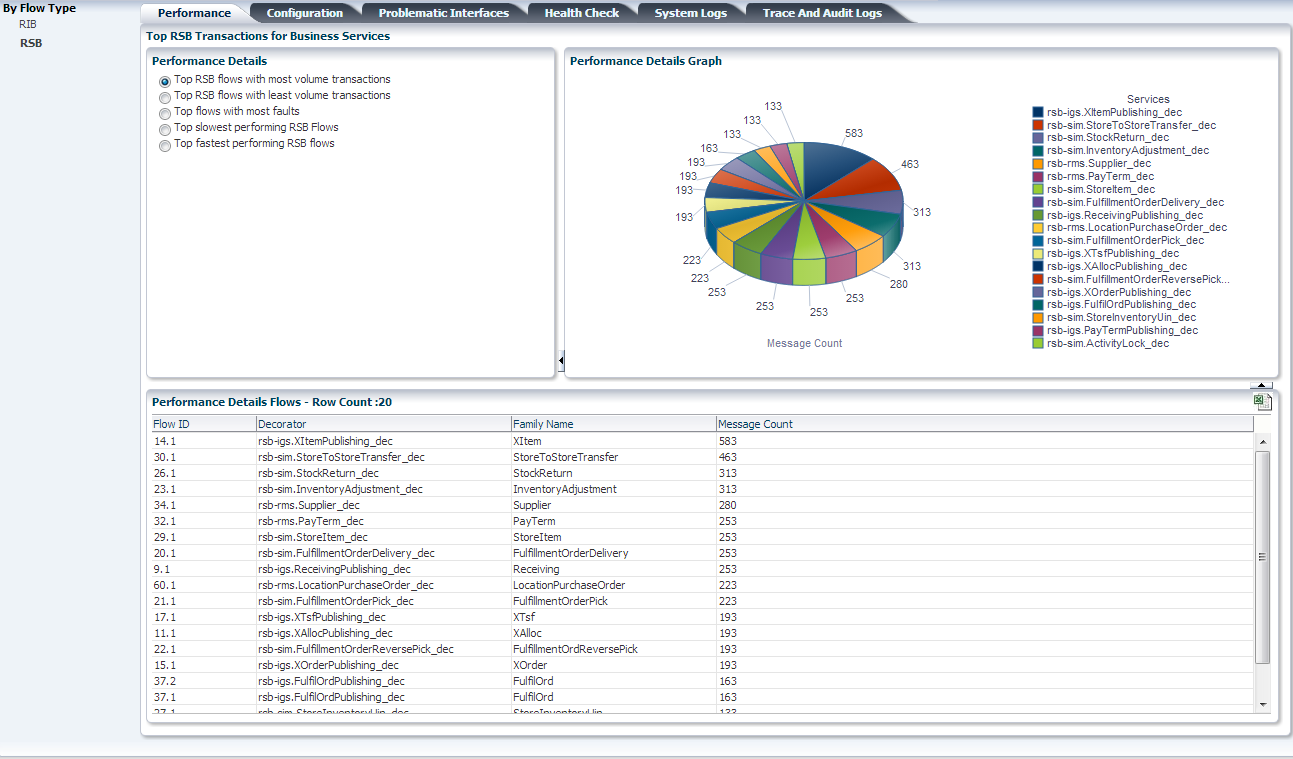
This tab is only for RSB. It contains the performance details for decorator services. Depending on the choice selected, corresponding performance details graph and performance details table are shown.
If all flows have count equal to zero, the table displays all flows. If one flow has message count greater than zero, the table displays only the top 20 flows per choice selected.
Configuration tab is slightly different for RSB and RIB.
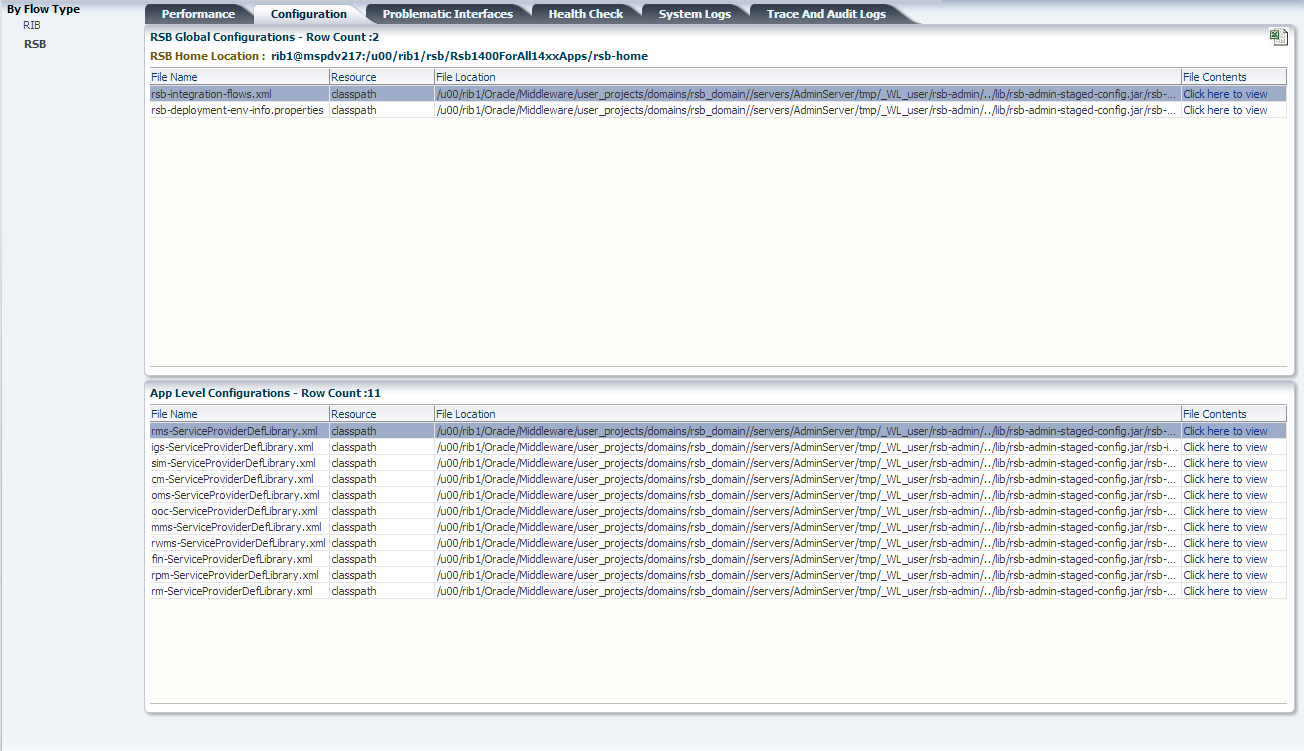
This tab displays the RSB home, where the RSB kernel is located.
RSB Global Configuration: This table displays the global configuration files related to RSB.
Application Level Configurations: This table displays the application specific files for applications that are in scope.
This tab displays the RIB home, where the RIB kernel is located.
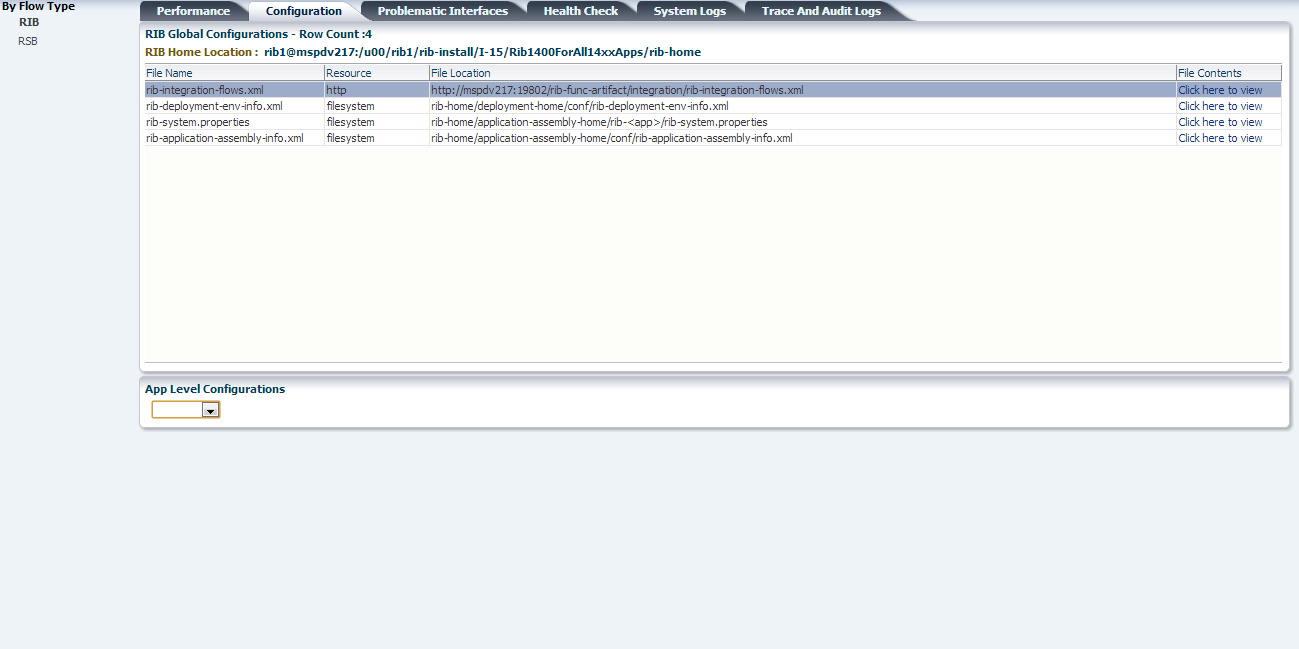
RIB Global Configuration: This table displays the global level files related to RIB.
Application Level Configurations: This table displays the application specific files for applications that are in scope.
There is a dropdown that has list of applications in scope. Depending on the app selected, it displays the files specific to that app. By default nothing is selected.
The columns in the tables are filename, resource, location of the file and a hyperlink which, when clicked on, opens a popup that shows the contents of the file.
This tab is only for RSB. This page shows the flows with most errors or system alerts.
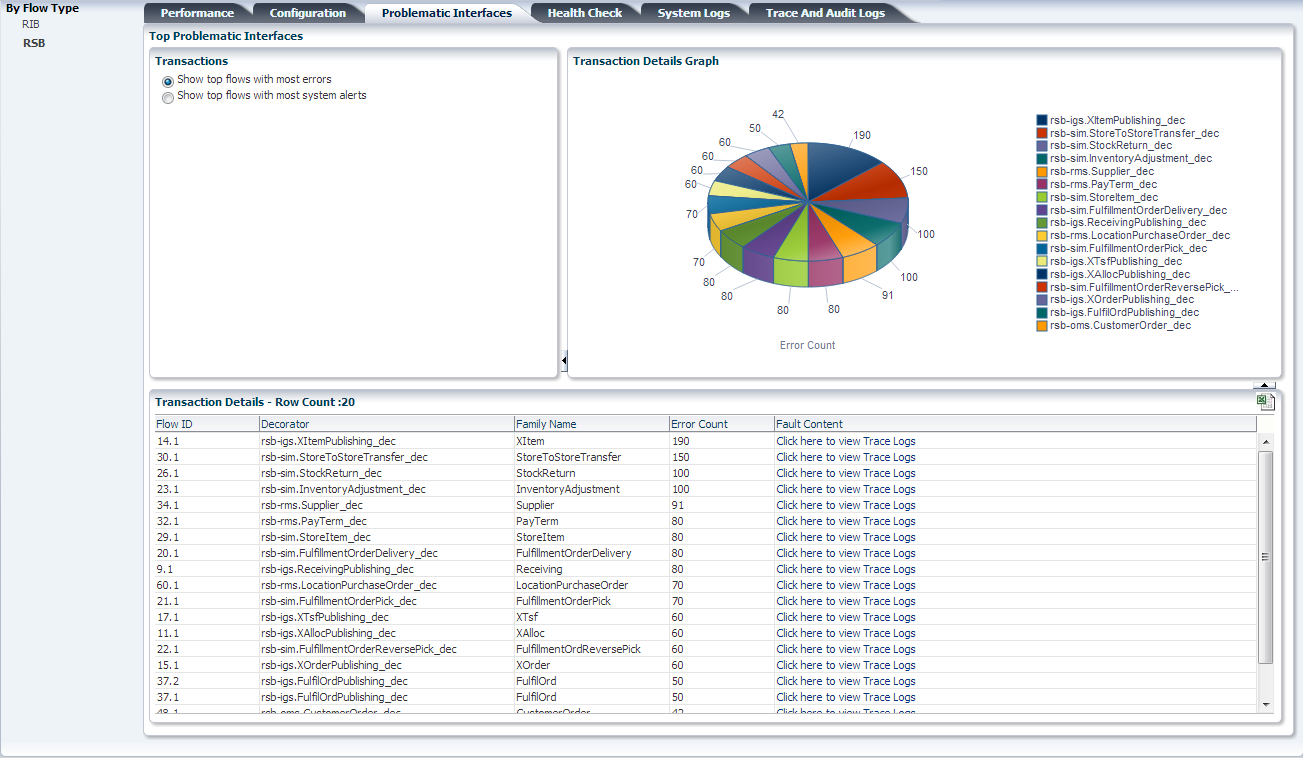
Transactions: Users can choose between two options: top flows with most errors or top flows with most system alerts.
Transaction Details Graph: It shows the errors or system alerts for decorator services in form of pie chart. The services are listed next to the graph.
Transaction Details Table: It shows the columns for flow ID, decorator name, message family name, error count and a link to trace logs. The link takes the user to the Trace and Audit Logs page for the selected decorator.
This tab is only for RSB. This tab allows pinging services as well as database connectivity. When a ping operation is called, the service invocation goes through edge app service through decorator and back. The user can also test database connectivity in this page.
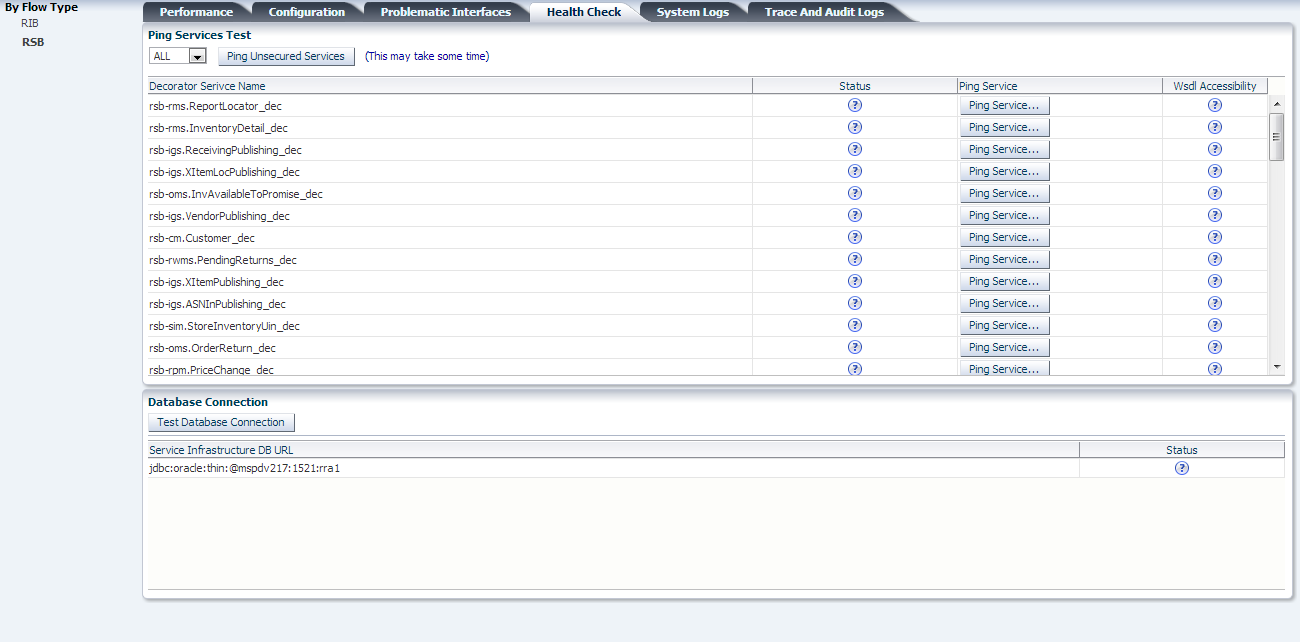
The page has a drop-down list that contains all the applications that are in scope. The default value is ”ALL”. By default, the table shows all the decorator services in scope. When we choose an application from the drop-down list, all the services related to that application are displayed.
Ping Unsecured Services: Invokes ping operation for all the services that are not secured.
The table in the page contains the decorator name, Status, Ping Service button and WSDL Accessibility. Initially the statuses of the service and WSDL are shown as unknown. When the Ping Service button is clicked, a popup screen is displayed. The popup has service details including WSDL URL, decorator name, web service policy name and the input message. If the service is secured, it has additional input fields: edge app service user name and password that are needed to ping that service. The statuses are shown as UP or DOWN depending on whether the services are available or not.
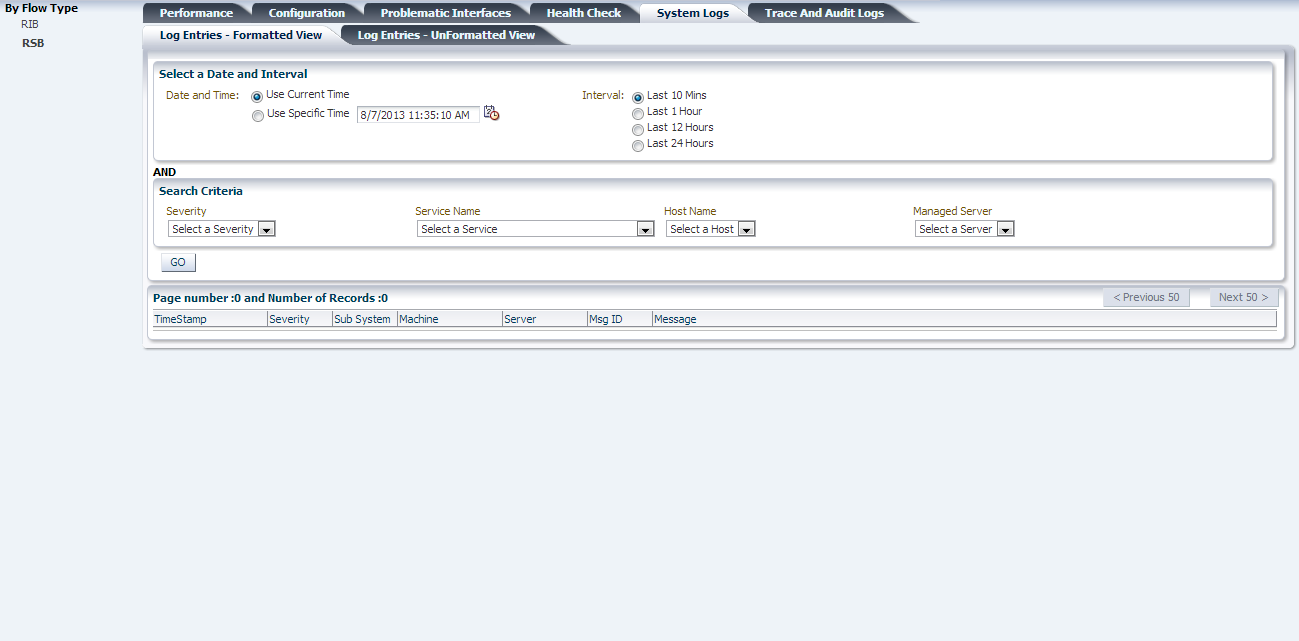
This tab is only for RSB. It displays the system logs retrieved from under <weblogic-home>/<domain-name>/servers/AdminServer/logs/<domain-name>.log.
There are two search panels that can be used as search criteria. Fields in the first search panel are mandatory, current time is the default value for the Date and Time field and Last 10 mins is the default value for the Interval field. The second search panel has Severity, Service Name, Host Name, and Managed Server drop-down lists. These are optional fields to filter the result.
When you click GO, the table displays the data matching the search criteria.
This tab is only for RSB. There are two search panels that can be used as search criteria. Fields in the first search panel are mandatory, Current Time is the default value for Date and Time and Last 10 Mins is the default value for Interval. The second Search panel has Severity, Service Name, Host Name and Managed Server drop-down lists. All these dropdowns are optional fields.
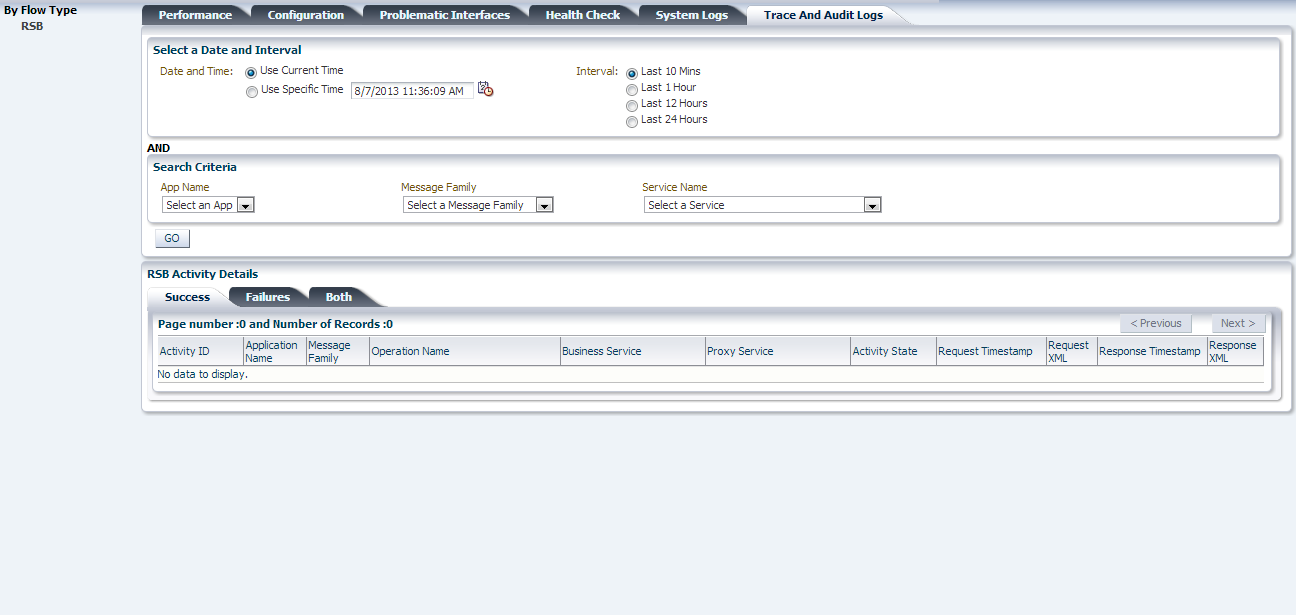
On click of the GO button, the table displays the data matching the search criteria. There are three tabs in the result panel.
Success: This tab shows only the success entries
Failures: This tab displays only failed invocations
Both: This tab displays both the success and failure logs
|
 Copyright © 2013, Oracle and/or its affiliates. All rights reserved. Legal Notices |
|