| Oracle® Retail Service Backbone Retail Integration Console Guide 14.0 E49444-01 |
|

 Previous |
 Next |
| Oracle® Retail Service Backbone Retail Integration Console Guide 14.0 E49444-01 |
|
Previous |
Next |
Historical trend displays the trends for the selected application or message family or services for the last 24 hours, last week, last 3 months, or last year.
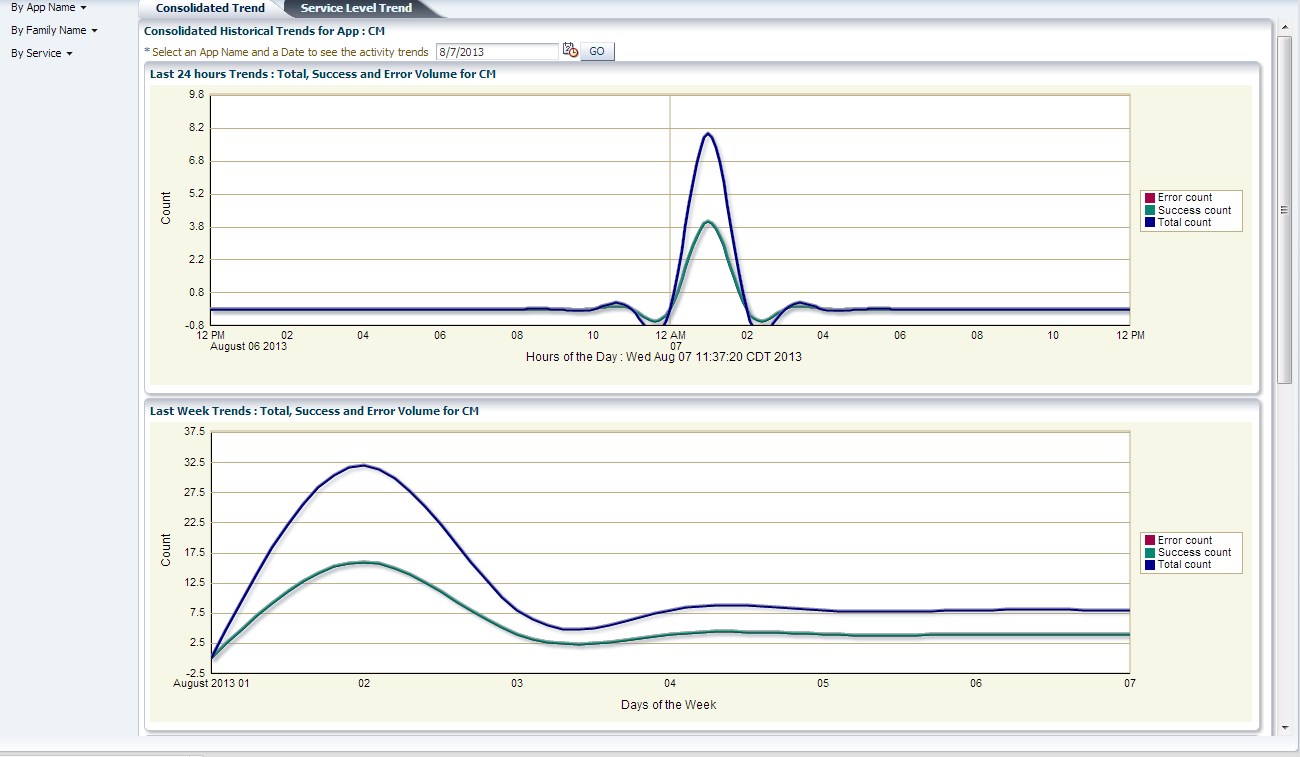
Left side menu has options 'By App Name', 'By Family Name' and 'By Service'.
By App Name: The trends graphs are shown for all the services that belong to the selected application.
By Family Name: The trends graphs are shown for all the services that belong to the selected message family.
By Service: The user needs to pick the services they want to graph the trend.
On the right hand there are two tabs; Consolidated Trend and Service Level Trend.
By default, the consolidated trend for the first app name in the By App Name menu is shown. When the user wants to select a different app name or Family Name or Service, all the graphs are reset to blank. Then the user will have to click on the GO button to generate the graphs for current selection.
Date field is preselected to current date. If the user wants a previous date they can use the date picker to select the date.
Each graph displays the total count (both successes and failure), success count, and failure count for all services that belong to the selected application, family, or service. The page has 4 graphs that have total count, success count and error count lines.
Graph 1 displays the last 24 hours trends from the selected date and time.
Graph 2 displays the last week trends from the selected date and time.
Graph 3 displays the last month trends from the selected date and time.
Graph 4 displays the last year trends from the selected date and time.
This is slightly different from the other two options.
It contains a shuttle box with list of available services. User can pick the 5 services they want and click on GO button. Shuttle box only allows 5 services at a time. If more than 5 are picked, It displays a warning message and GO button is disabled.
The graphs are different too; the graph shows total count, success count and error count for each of the selected services.
Service Level Trends shows the trends for each service in the application, family, or service.
It has search criteria, app name or family name that is selected, the date field that has current date by default and a list of radio buttons (24 hours, last week, last month and last year from the date selected). 24 hours is the default selected interval option. Click GO after the selection is made. Three different graphs are generated.
Graph 1 displays total transaction count
Graph 2 displays total success count
Graph 3 displays total error count
The time intervals vary depending on the radio button selected. If the user selected for last 7 days, all three graphs (total, success and error) display the trends for the last 7 days for each selected service.
|
 Copyright © 2013, Oracle and/or its affiliates. All rights reserved. Legal Notices |
|