12 Oracle Utilities Data Model Sample Reports
This chapter provides Oracle Utilities Data Model sample reports.
Note:
Some of the reports shown may appear incomplete. The sample reports shown use manually generated data, and for data privacy and regulatory reasons, it shows only made up customers (with real data). Hence, if you notice data inconsistency between the reports, this is not due to Oracle Utilities Data Model, but due to the sample data.
The reports shown in this chapter appear as shown when you install Oracle Utilities Data Model with the sample data.
This chapter includes the following sections:
Credit and Collection Sample Reports
Top N Arrear Accounts
This area includes the report:
Top N Arrear Accounts
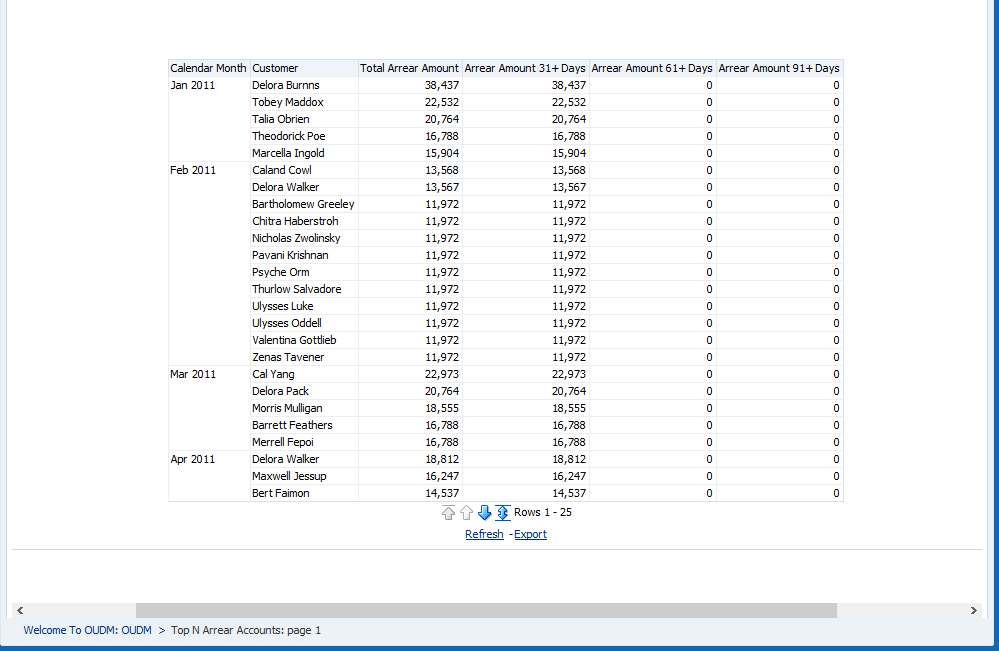
This report, as shown in Figure 12-1 provides the total arrear amounts by month and the top 100 accounts with the highest 31+ days arrears amount in the selected month.
Report dimensions are:
-
Calendar Month
-
Customer
Figure 12-1 Credit and Collection: Top N Arrear Accounts Sample Report (top)
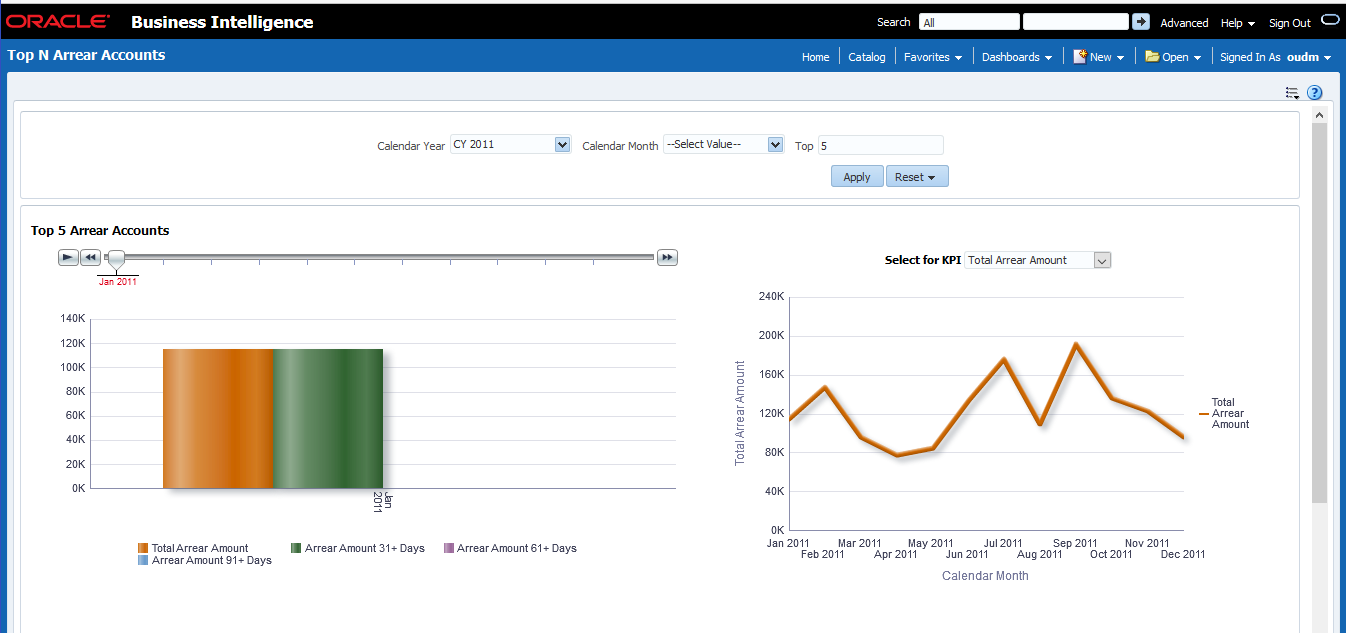
Description of "Figure 12-1 Credit and Collection: Top N Arrear Accounts Sample Report (top)"
Figure 12-2 Credit and Collection: Top N Arrear Accounts Sample Report (bottom)
Description of "Figure 12-2 Credit and Collection: Top N Arrear Accounts Sample Report (bottom)"
Demand Response (DR) Sample Reports
Customer Savings by Demand Response (DR) Program
This area includes the report:
Available Load Reduction by Program
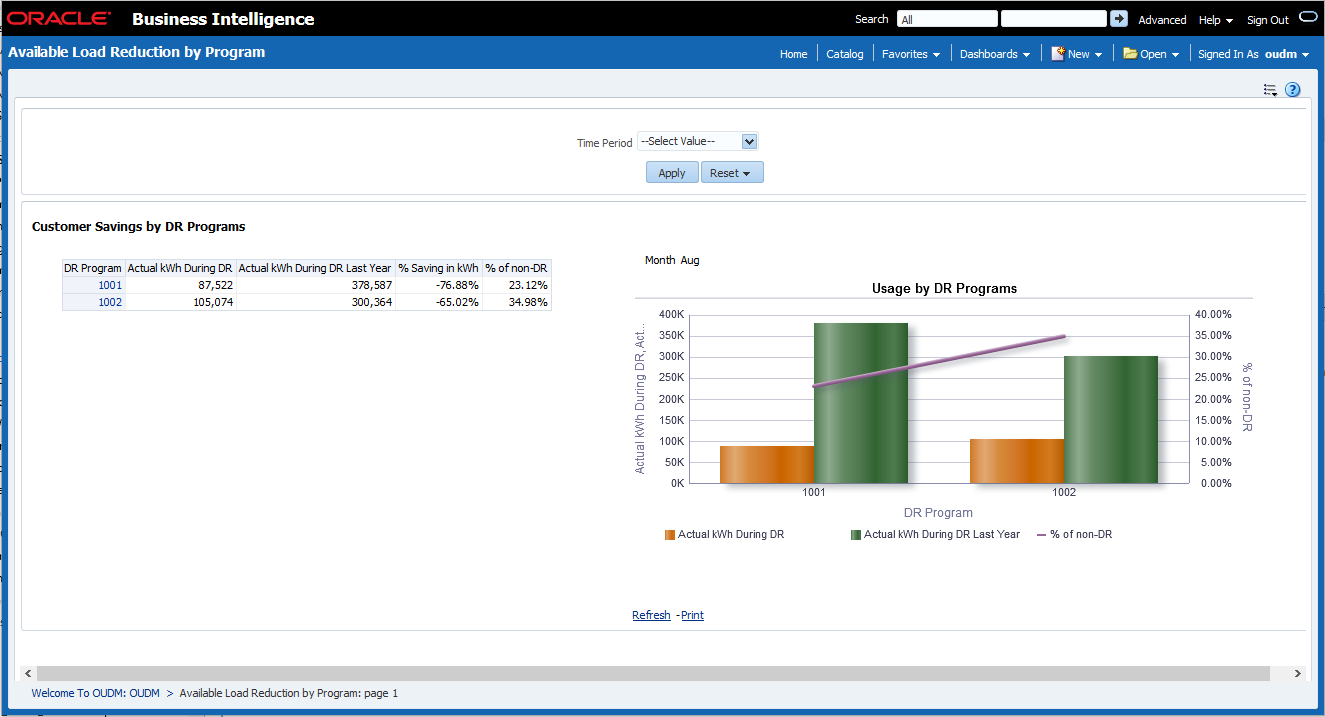
This report, as shown in Figure 12-3 provides the available load reduction for a given time by program.
Report dimensions are:
-
Day
-
Demand Response Program
Figure 12-3 Demand Response: Available Load Reduction by Program Sample Report
Description of "Figure 12-3 Demand Response: Available Load Reduction by Program Sample Report "
Meter Data Analysis Sample Reports
Top N Customer by Usage
Top N Customers by Usage
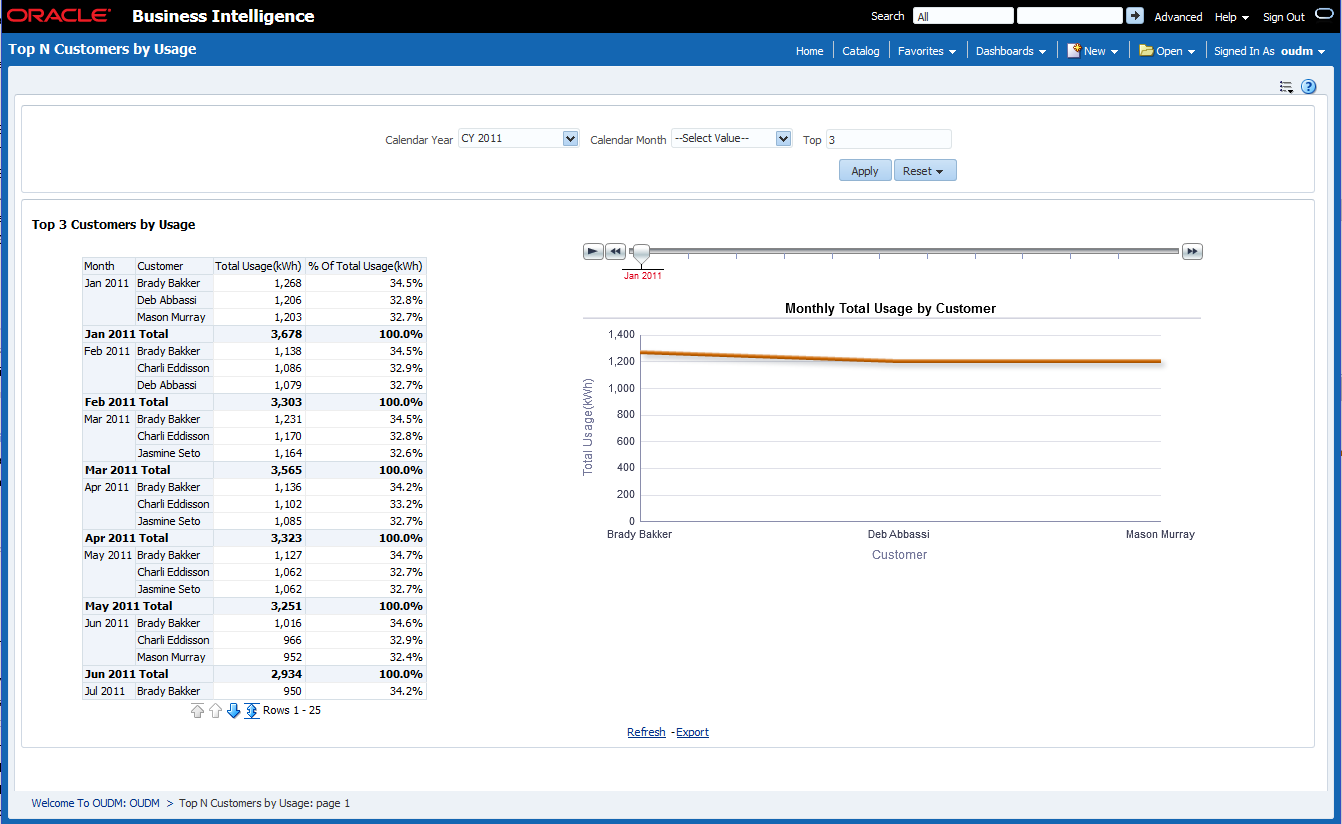
This report, as shown in Figure 12-4 provides the top 50 customers based on total usage in a given time period.
Report dimensions are:
-
Calendar Month
-
Customer
Figure 12-4 Meter Data Analysis: Top N Customers by Usage Sample Report
Description of "Figure 12-4 Meter Data Analysis: Top N Customers by Usage Sample Report"
Monthly Usage Season Profile
Season Monthly Usage by Geographical Zones Report
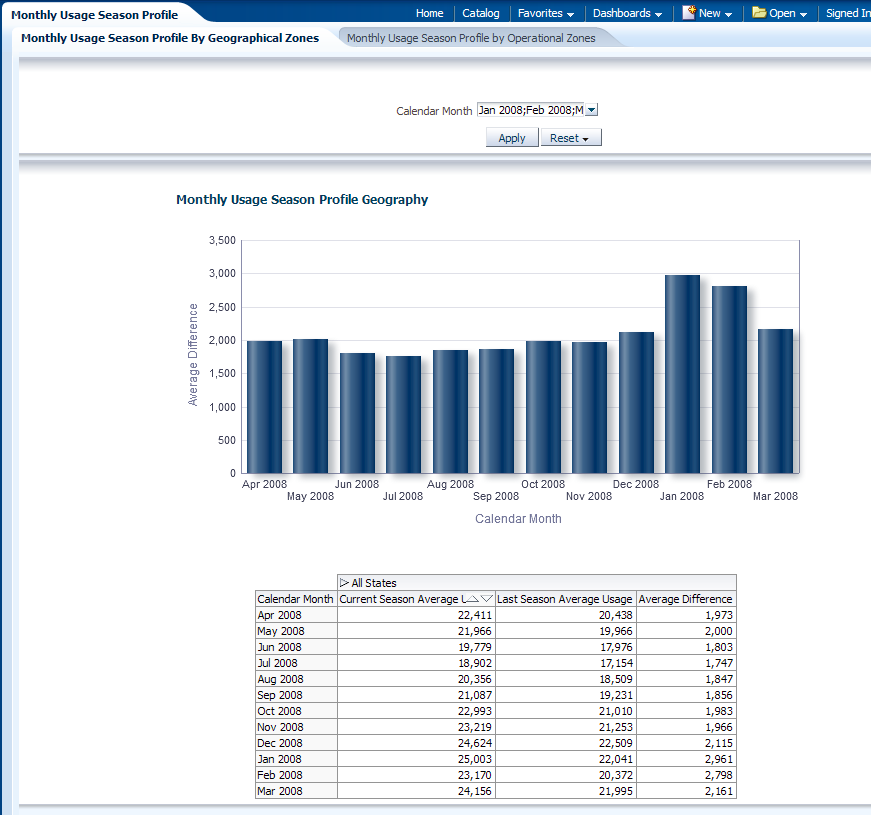
This report as shown in Figure 12-5 shows the average difference between summer and winter monthly usage during the selected year.
Report dimensions are:
-
Calendar Month
-
Geographical Zones
-
Usage Point
-
City
-
State
-
Figure 12-5 Meter Data Analysis: Season Monthly Usage by Geographical Zones
Description of "Figure 12-5 Meter Data Analysis: Season Monthly Usage by Geographical Zones"
Monthly Usage Season Profile by Operational Zones Report
This report as shown in Figure 12-6 shows the average difference between summer and winter monthly usage during the selected year.
Report dimensions are:
-
Calendar Month
-
Operational
-
Usage Point
-
Transformer
-
Feeder
-
Substation
-
Figure 12-6 Meter Data Analysis: Monthly Usage Season Profile by Operational Zones Report
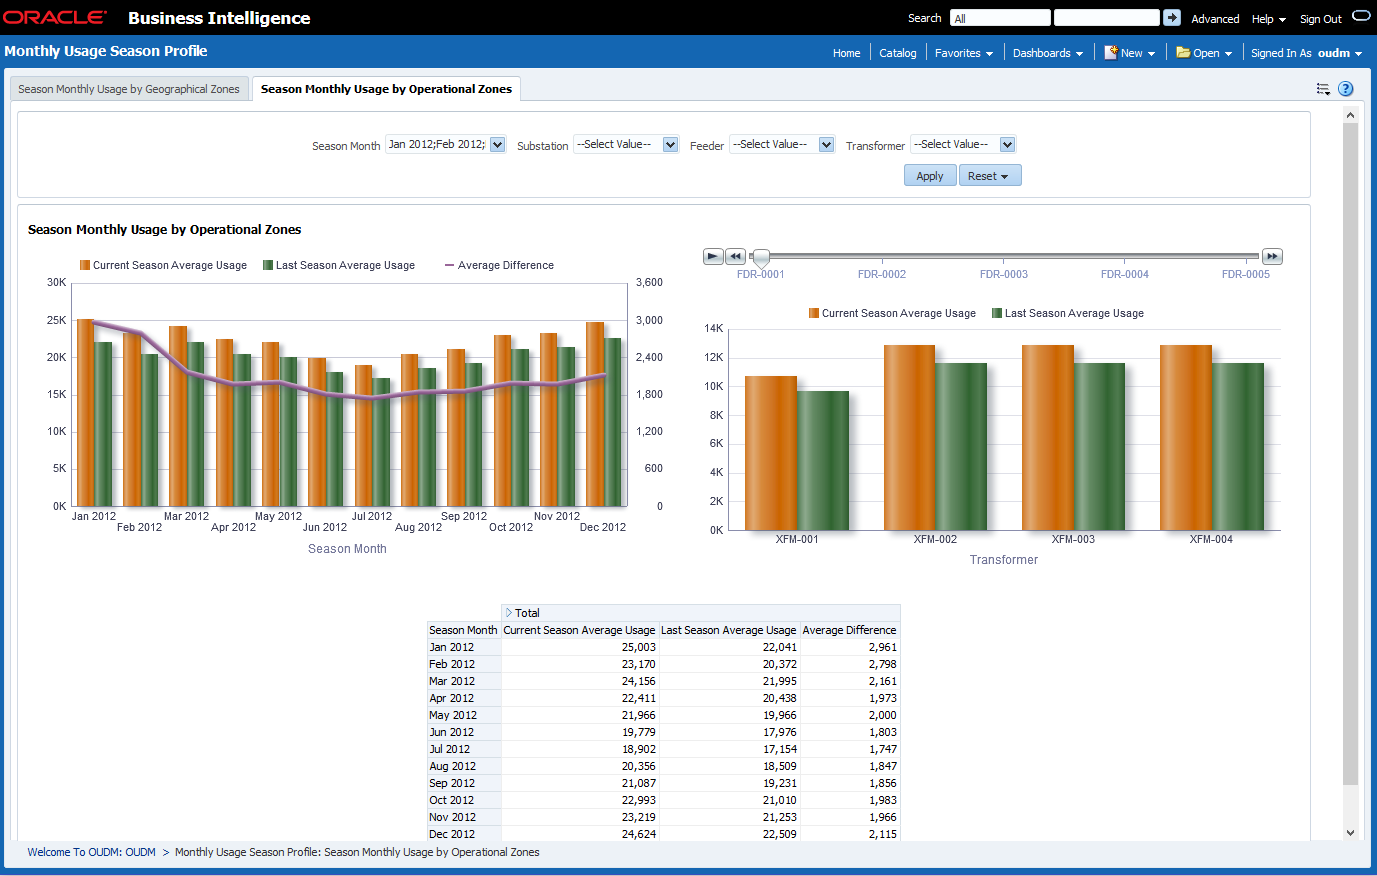
Description of "Figure 12-6 Meter Data Analysis: Monthly Usage Season Profile by Operational Zones Report"
Usage Season Profile
Usage Season Profile by Operational Zones
This report, as shown in Figure 12-7 provides the average difference between summer and winter daily usage during the selected year.
Report dimensions are:
-
Calendar
-
Day
-
Operational
-
Usage Point
-
Transformer
-
Feeder
-
Substation
-
Figure 12-7 Meter Data Analysis: Usage Season Profile by Operational Zones
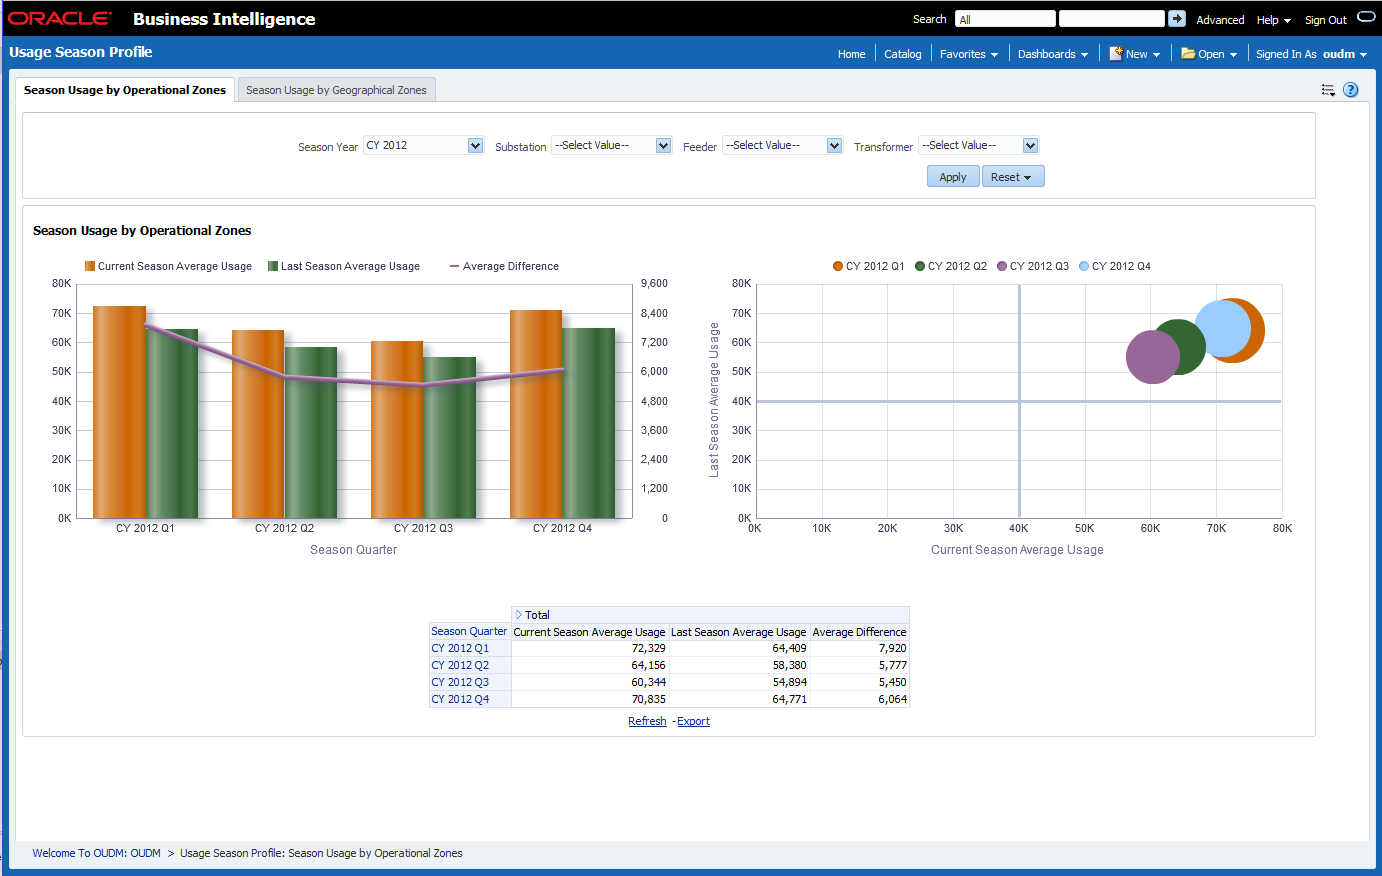
Description of "Figure 12-7 Meter Data Analysis: Usage Season Profile by Operational Zones"
Usage Season Profile by Geographical Zones
This as shown in Figure 12-8 provides the average difference between summer and winter daily usage during the selected year.
Report dimensions are:
-
Calendar Month
-
Day
-
Geographical Zones
-
Usage Point
-
City
-
State
-
Figure 12-8 Meter Data Analysis: Usage Season Profile by Geographical Zones Report
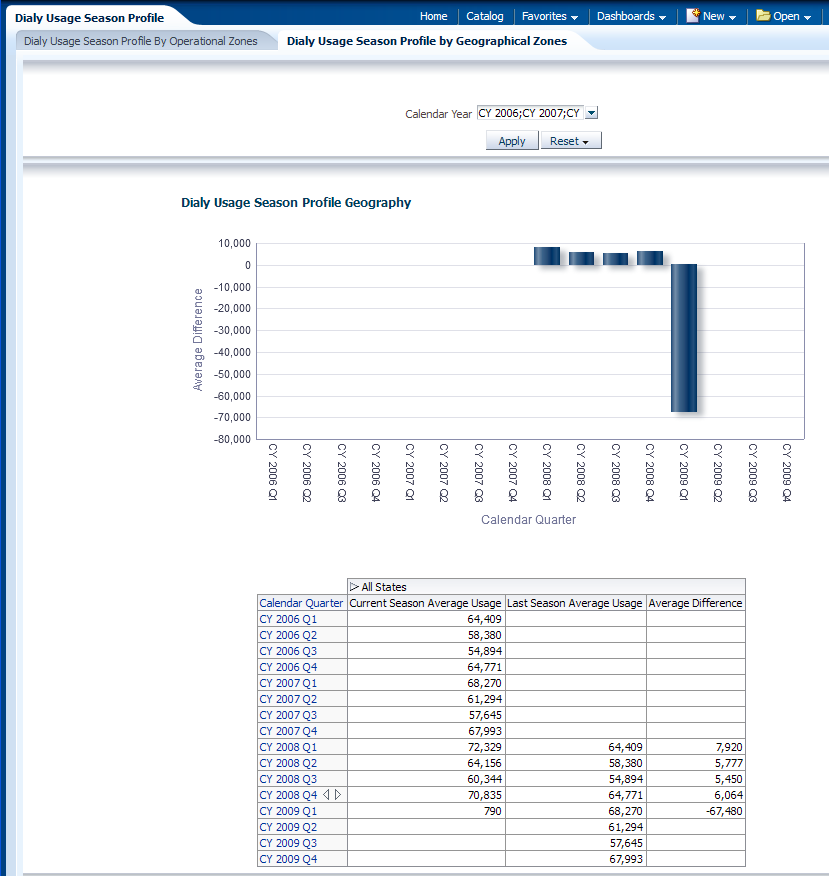
Description of "Figure 12-8 Meter Data Analysis: Usage Season Profile by Geographical Zones Report"
Monthly Total Usage
Operational Monthly Usage
This report, as shown in Figure 12-9 provides monthly total usage.
Report dimensions are:
-
Calendar Month
-
Operational
-
Usage Point
-
Transformer
-
Feeder
-
Substation
-
Figure 12-9 Meter Data Analysis: Monthly Total Usage Operational Monthly Usage Report
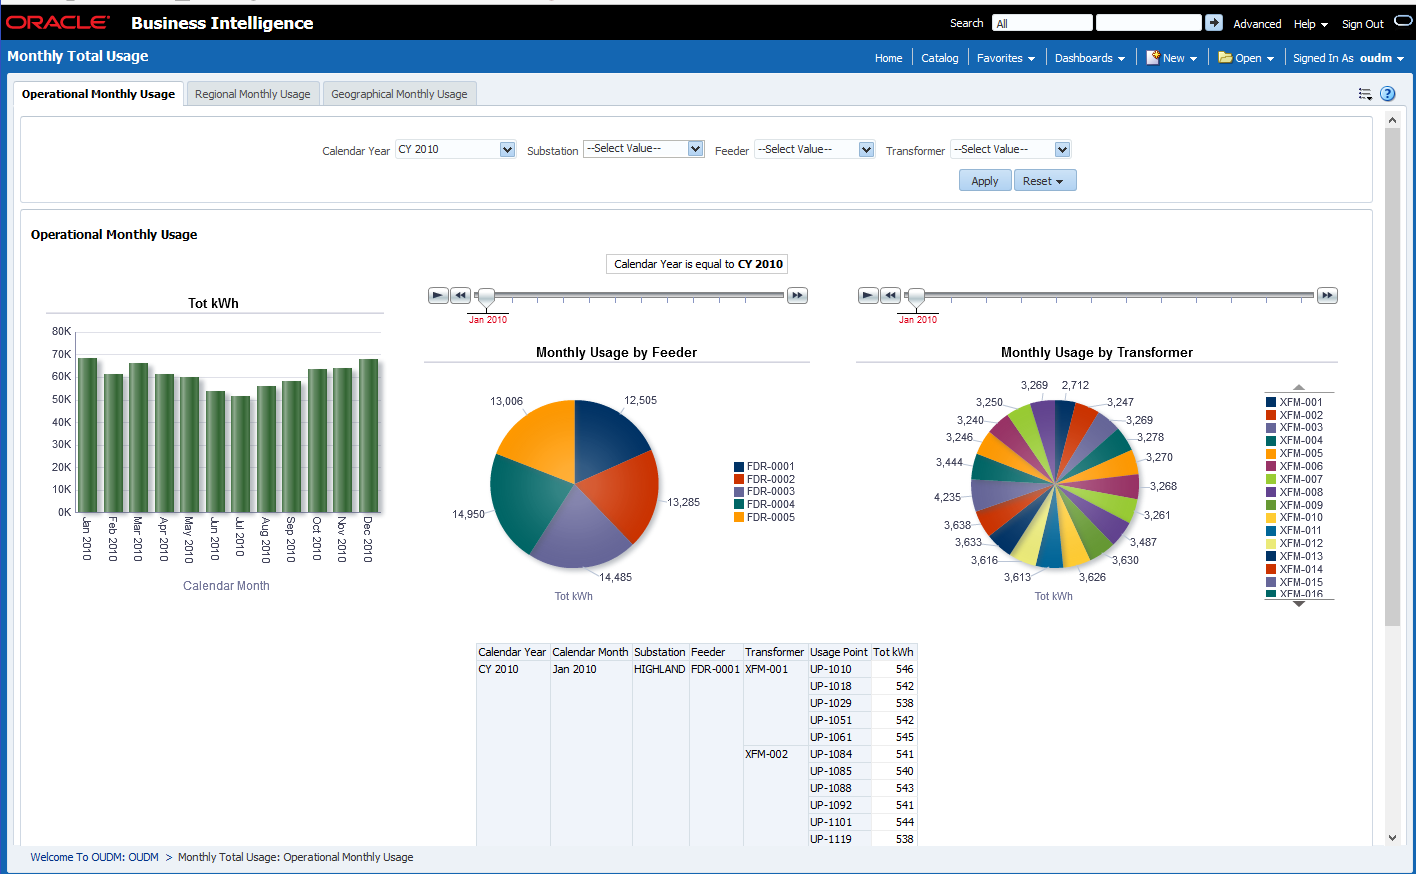
Description of "Figure 12-9 Meter Data Analysis: Monthly Total Usage Operational Monthly Usage Report"
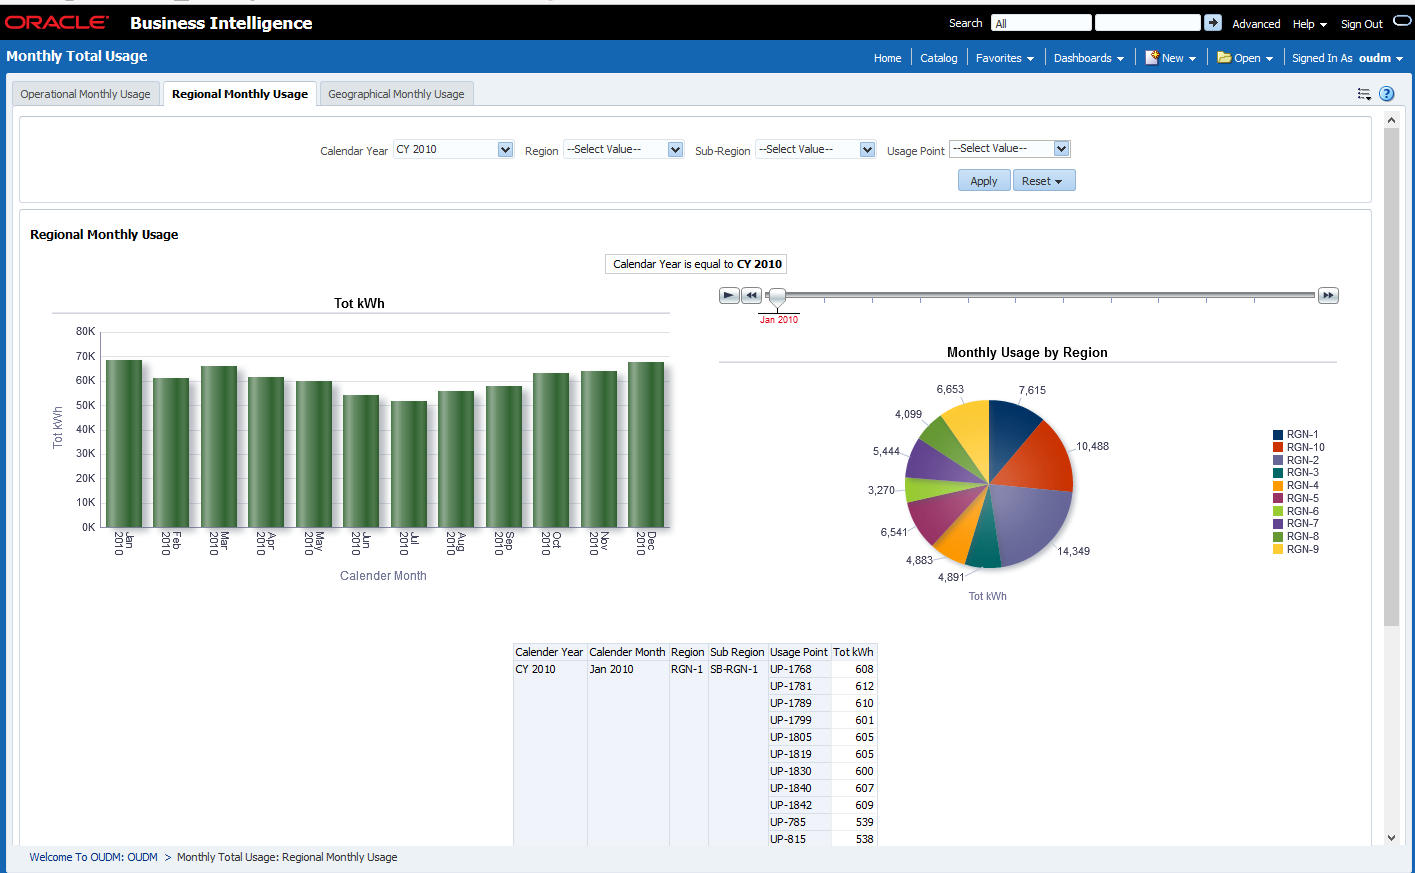
Regional Monthly Usage
This as shown in Figure 12-10 provides monthly total usage.
Report dimensions are:
-
Calendar Month
-
Regional Zones
-
Usage Point
-
Region
-
Subregion
-
Figure 12-10 Meter Data Analysis Monthly Total Usage: Regional Monthly Usage
Description of "Figure 12-10 Meter Data Analysis Monthly Total Usage: Regional Monthly Usage"
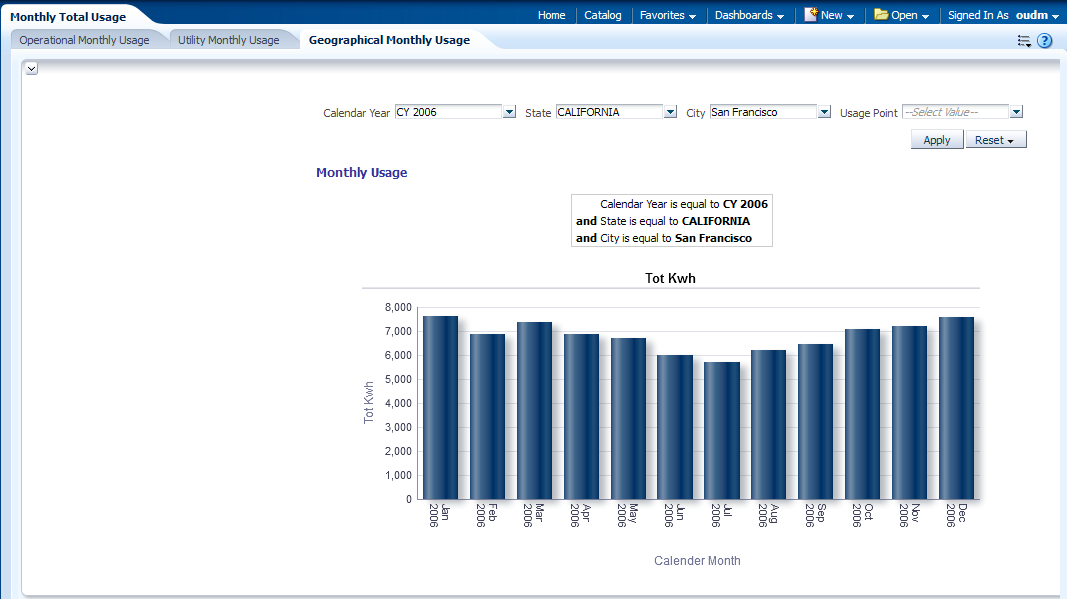
Geographical Monthly Usage
This as shown in Figure 12-11 provides geographical monthly usage.
Report dimensions are:
-
Calendar Month
-
Geographical Zones
-
Usage Point
-
City
-
State
-
Figure 12-11 Meter Data Analysis: Daily Usage Season Profile by Geographical Zones Report
Description of "Figure 12-11 Meter Data Analysis: Daily Usage Season Profile by Geographical Zones Report"
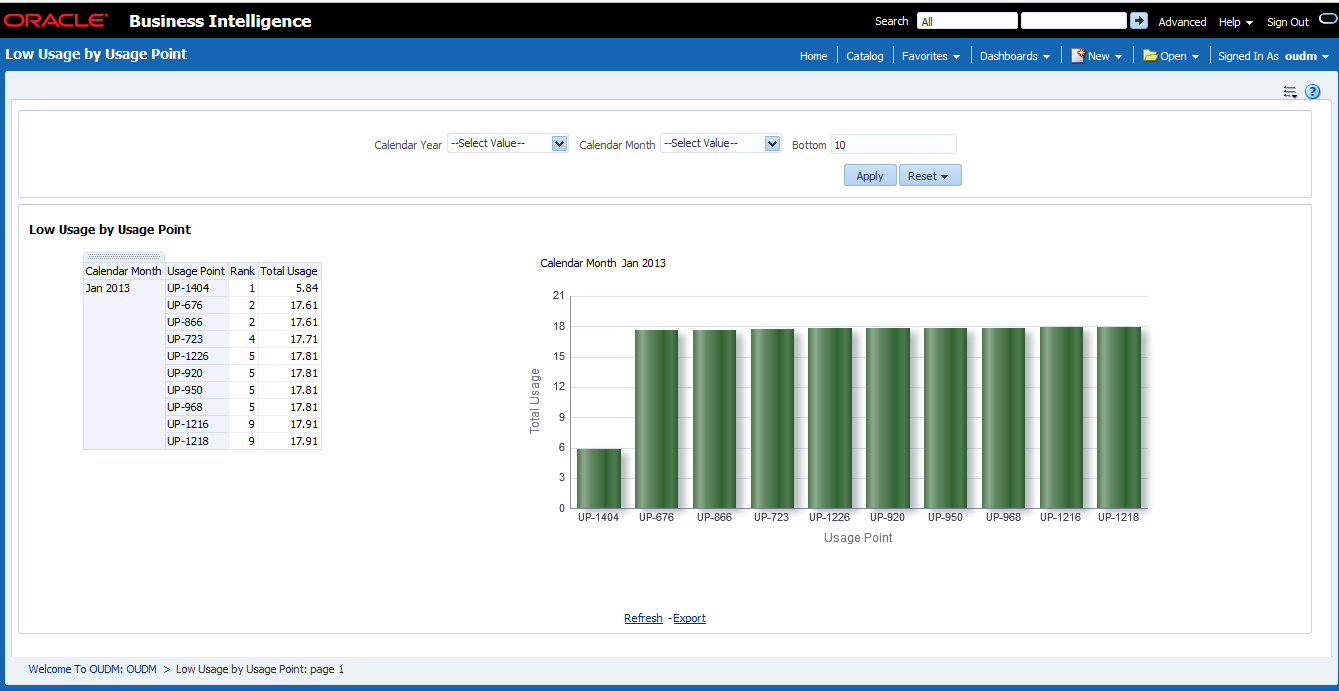
Low Usage by Usage Point
Low Usage by Usage Point
This report, as shown in Figure 12-12 identifies service points with lowest consumption for the selected month.
Report dimensions are:
-
Calendar Month
-
Usage Point
Figure 12-12 Meter Data Analysis: Low Usage by Usage Point
Description of "Figure 12-12 Meter Data Analysis: Low Usage by Usage Point"
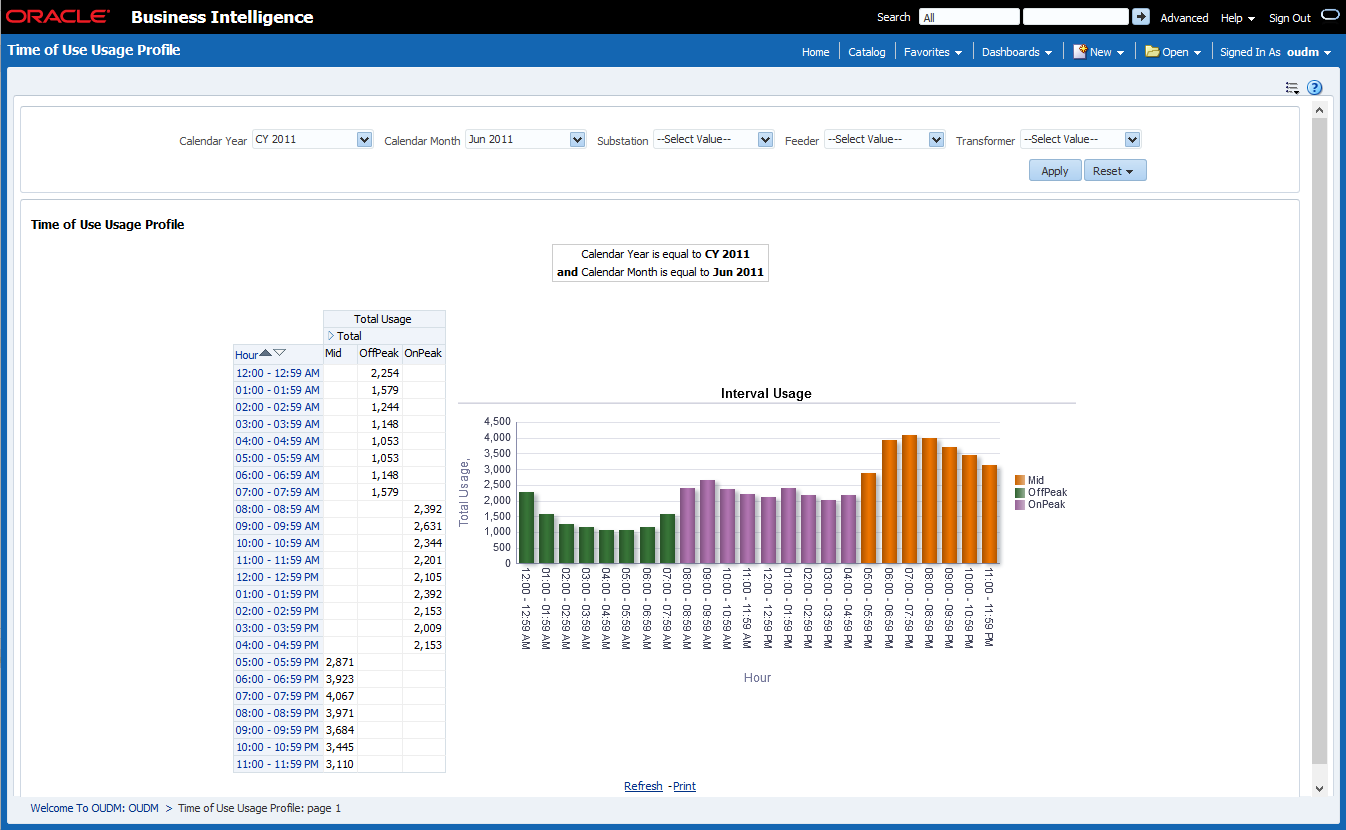
Time of Use Usage Profile
Time of Use Usage Profile
This report, as shown in Figure 12-13 provides Time of Use (TOU) mapped measurement quantities over a given period at interval detail level (Hour).
Report dimensions are:
-
Calendar Month
-
Day
-
Hour
-
Operational
-
Usage Point
-
Transformer
-
Feeder
-
Substation
-
-
Time of Use
Figure 12-13 Meter Data Analysis: Time of Use Usage Profile
Description of "Figure 12-13 Meter Data Analysis: Time of Use Usage Profile"
TOU Usage Trend
Time of Use Usage Trend
This report, as shown in Figure 12-14 month usage trend by TOU period.
Report dimensions are:
-
Calendar Month
-
Operational
-
Usage Point
-
Transformer
-
Feeder
-
Substation
-
-
Time of Use
Figure 12-14 Meter Data Analysis: Time of Use Usage Trend
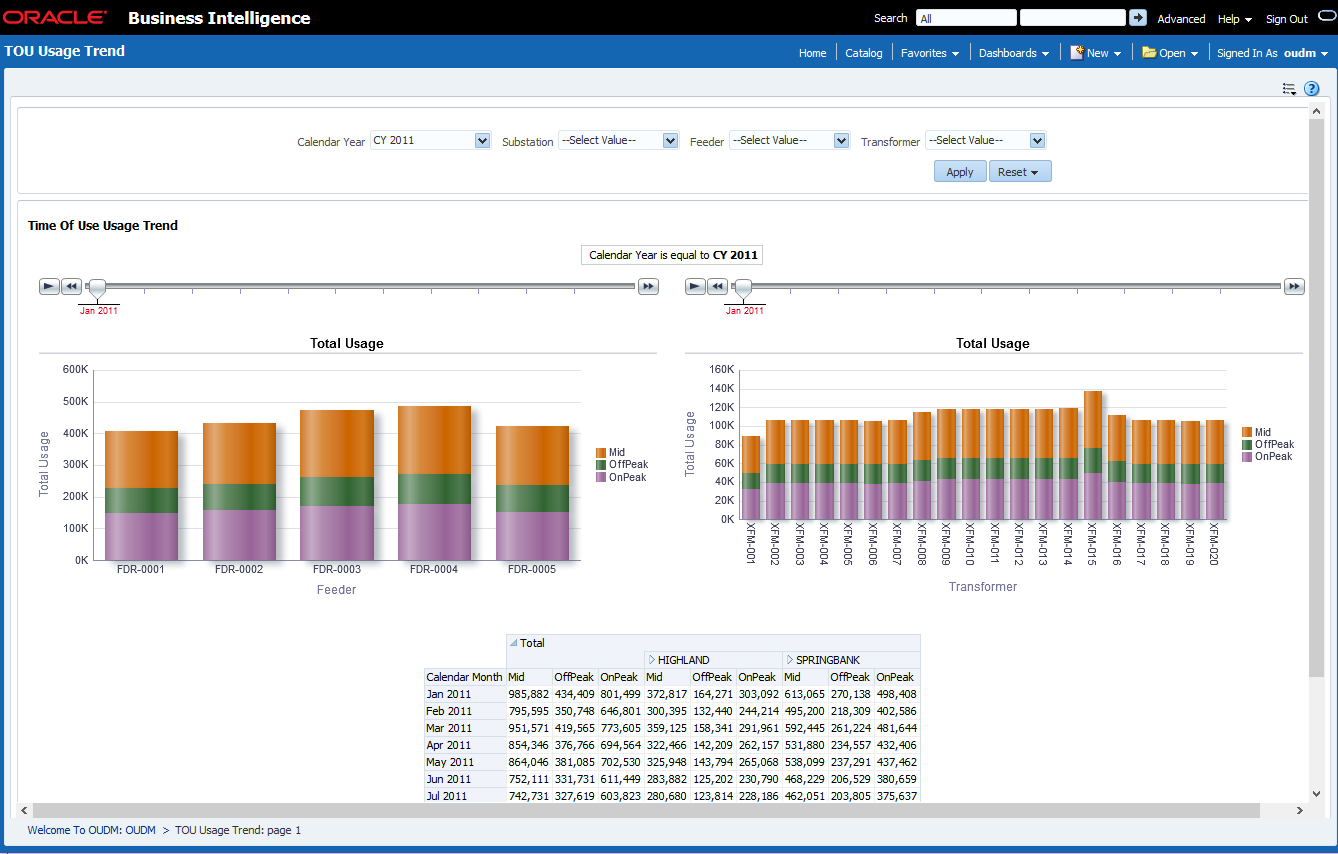
Description of "Figure 12-14 Meter Data Analysis: Time of Use Usage Trend"
Top N Customer with Usage Change
Top N Customer with Usage Change
This report, as shown in Figure 12-15 provides the list of top N customers whose year over year, monthly usage has undergone more than 7% change in at least 5 of the 12 months.
Report dimensions are:
-
Calendar Month
-
Customer
Figure 12-15 Meter Data Analysis: Top N Customer with Usage Change
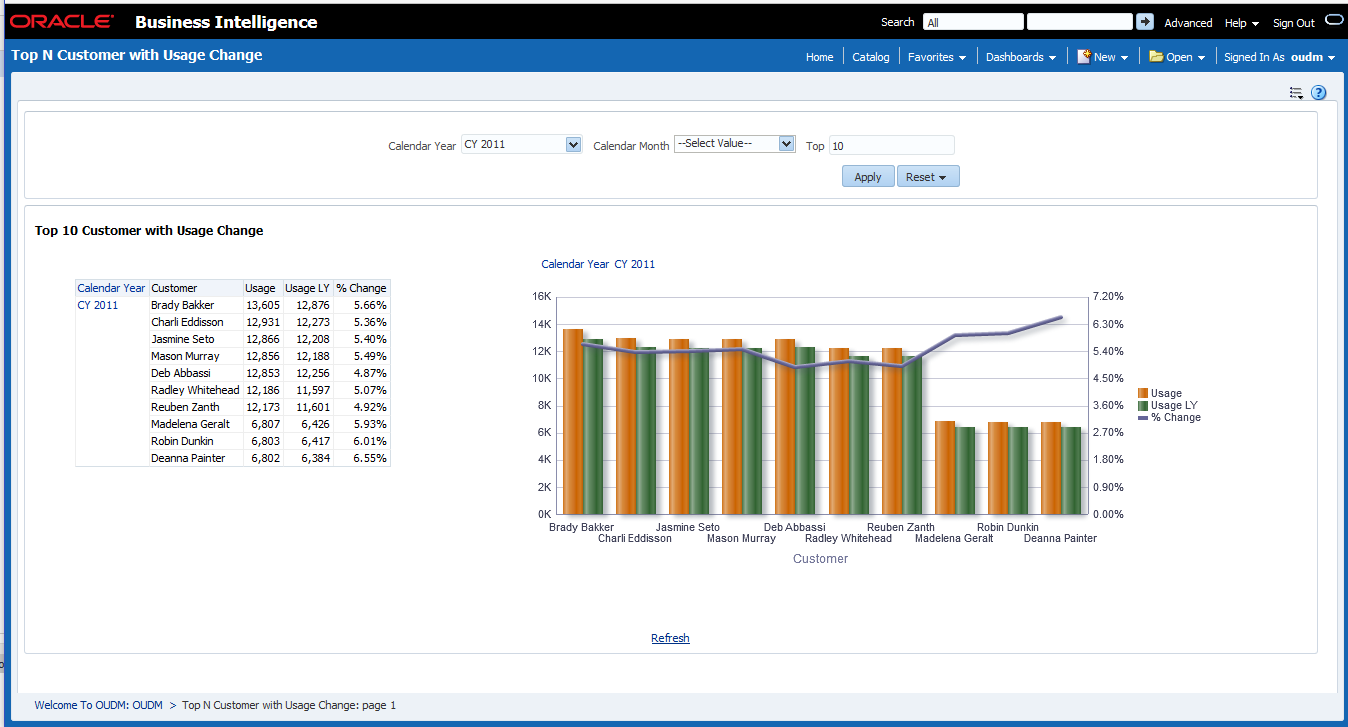
Description of "Figure 12-15 Meter Data Analysis: Top N Customer with Usage Change"
Customer Count by Usage Grouping
Customer Count by Usage Grouping
This report, as shown in Figure 12-16 provides the number of customers in a zip code with a specified average monthly usage aggregated usage over three years for the selected time period.
Report dimensions are:
-
Calendar Month
-
Customer
-
Service Location
Figure 12-16 Meter Data Analysis: Customer Count by Usage Grouping
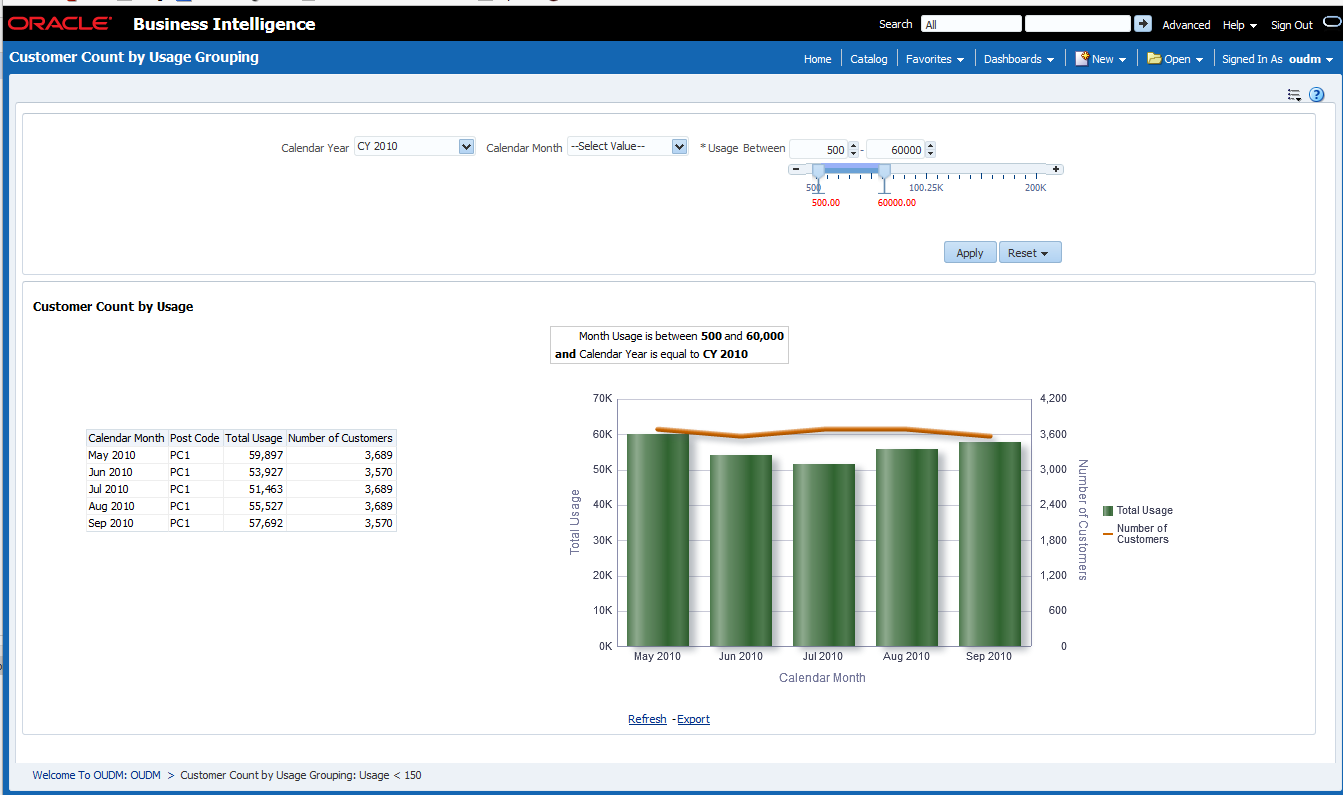
Description of "Figure 12-16 Meter Data Analysis: Customer Count by Usage Grouping"
Outage Analysis Sample Reports
The outage analysis area sample reports include the following:
Table 12-1 Reliability Selections for Reports
| Reliability Metric Name | Description |
|---|---|
|
ASAI |
Ratio of the total number of customer hours that service was available during a given time period to the total customer. |
|
CAIDI |
Customer average interruption duration in a given period (selected customer). |
|
CAIFI |
Customer average interruption frequency in a given period (selected customers). |
|
CIII |
Average number of customers interrupted during an outage. |
|
CMI |
Customer Minutes Interrupted. |
|
MAIFI |
Average number of momentary interruptions that a customer experiences in a given period. |
|
SAIDI |
System average interruption duration in a given period (on total customers). |
|
SAIFI |
System average interruption frequency in a given period (on total customers). |
- Reliability by City
- Worst Performing Feeder
- Top N Customers by Customer Minutes Interrupted (CMI)
- Top N Customers by Number of Outages
- Top N Feeders by Outage Count
- Top N Feeders by Total Minutes Lost
- Top N Feeders by Reliability Indices
- Top N City by Outage Count
- Top N City by Total Minutes Lost
- Top N City by Reliability Indices
- Top N Region by Outage Count
- Top N Region by Total Minutes Lost
- Top N Region by Reliability Indices
Reliability by City
Reliability by City
This report, as shown in Figure 12-17 provides reliability by city. For more details, see Table 12-1.
Report dimensions are:
-
Calendar Month
-
City
Figure 12-17 Outage Analysis: Reliability by City Report
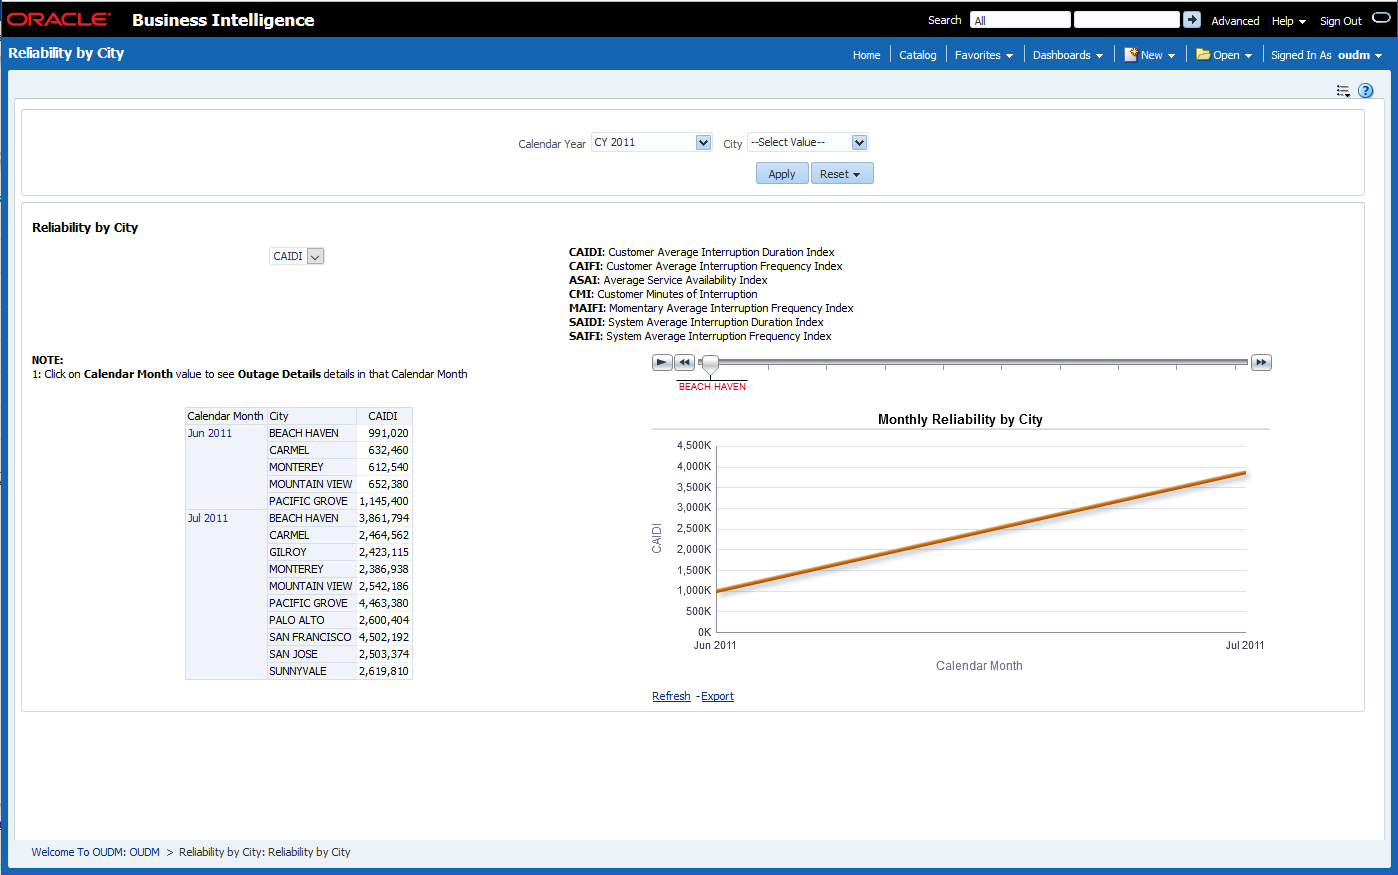
Description of "Figure 12-17 Outage Analysis: Reliability by City Report"
Worst Performing Feeder
Worst Performing Feeder
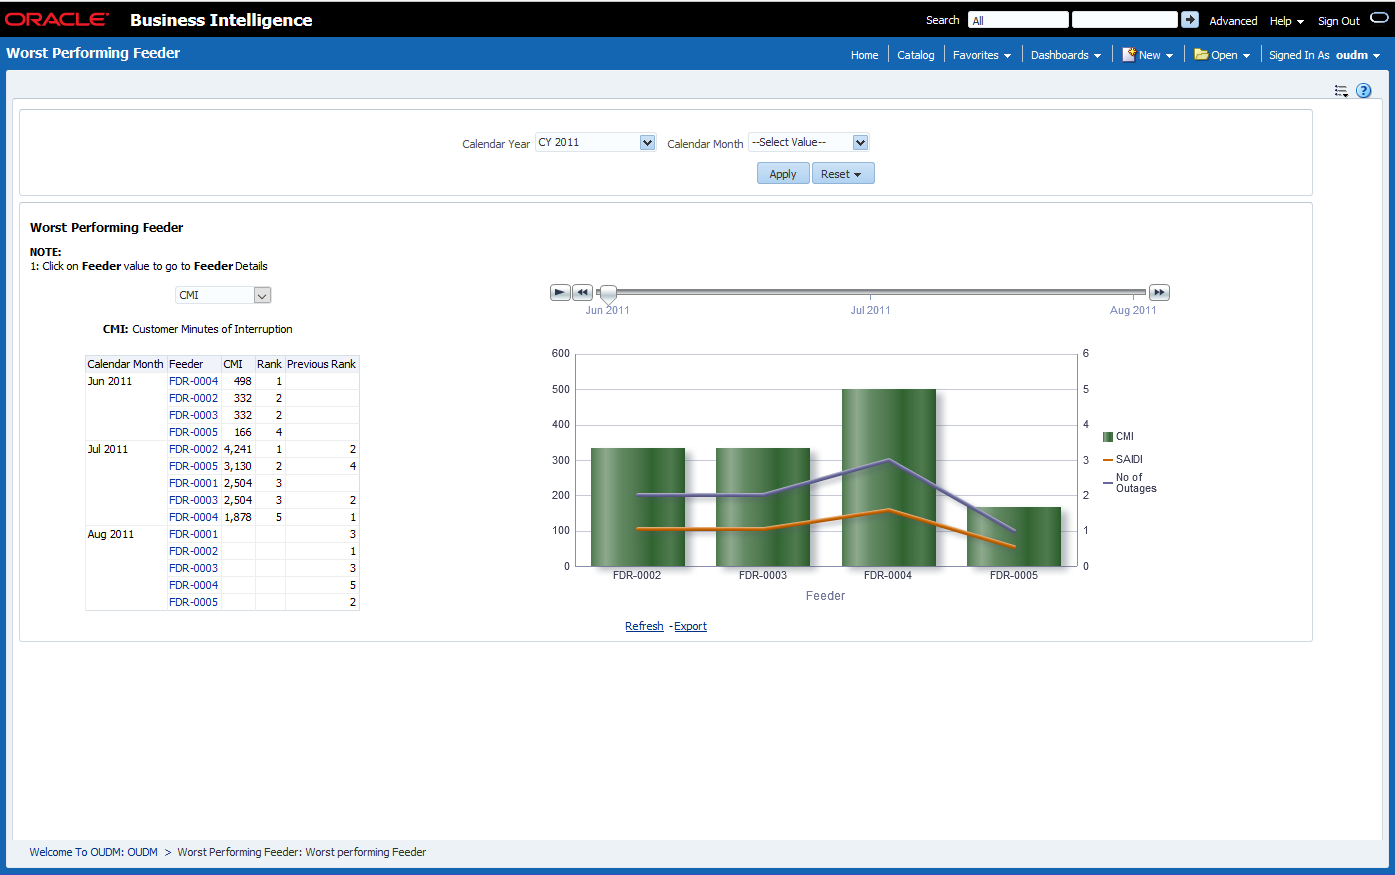
This report, as shown in Figure 12-18 provides feeder CMI for selected period.
Report dimensions are:
-
Calendar Month
-
Feeder
Figure 12-18 Outage Analysis: Worst Performing Feeder
Description of "Figure 12-18 Outage Analysis: Worst Performing Feeder"
Top N Customers by Customer Minutes Interrupted (CMI)
Top N Usage Points by CMI
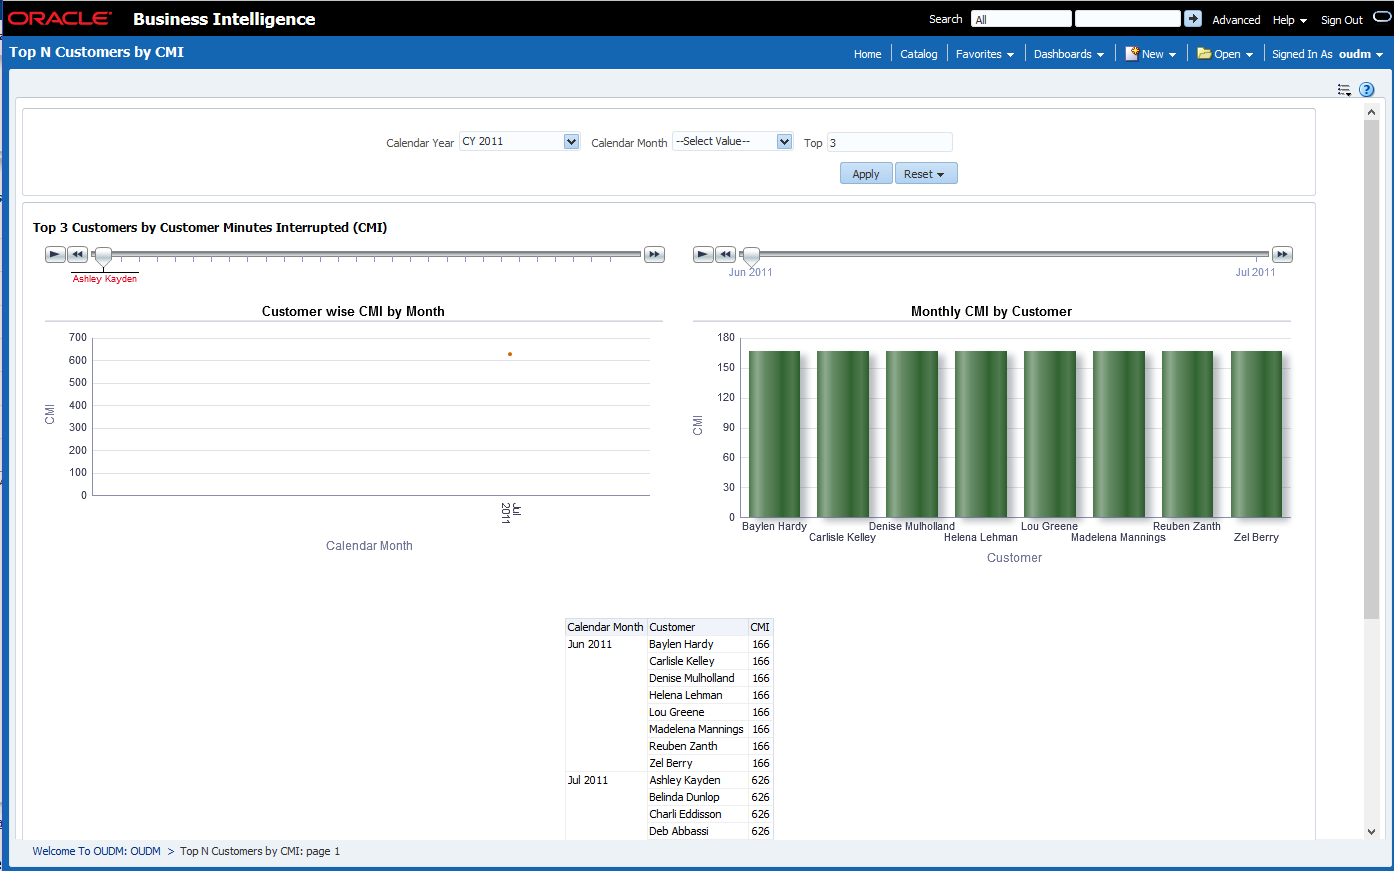
This report, as shown in Figure 12-19 provides feeder CMI for selected period.
Report dimensions are:
-
Calendar Month
-
Customer
Figure 12-19 Outage Analysis: Top N Usage Points by CMI
Description of "Figure 12-19 Outage Analysis: Top N Usage Points by CMI"
Top N Customers by Number of Outages
Top N Customers by Number of Outages
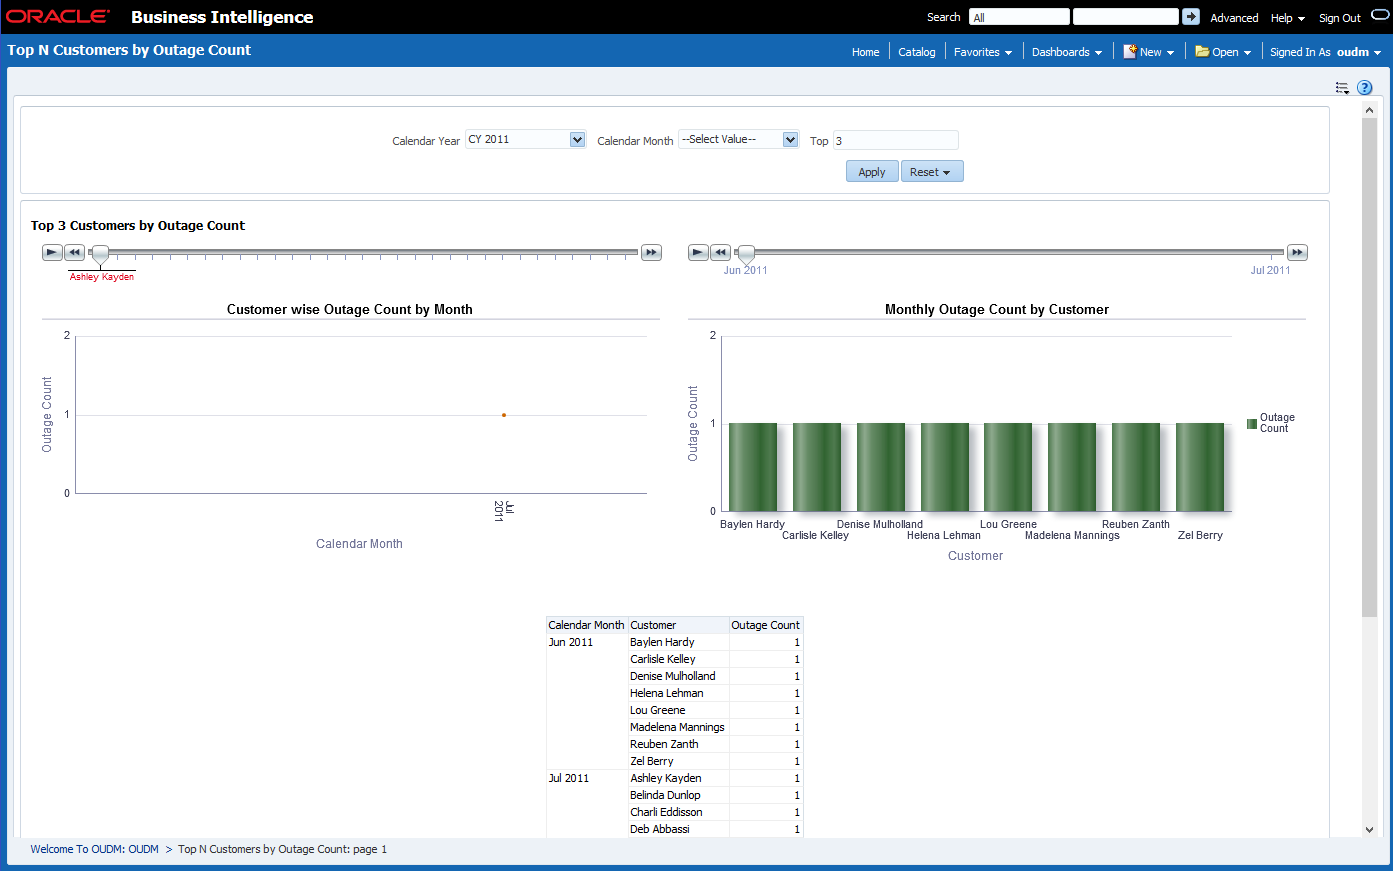
This report, as shown in Figure 12-20 provides the top 50 customers based on number of outages in a given period.
Report dimensions are:
-
Calendar Month
-
Customer
Figure 12-20 Outage Analysis: Top N Customers by Number of Outages
Description of "Figure 12-20 Outage Analysis: Top N Customers by Number of Outages"
Top N Feeders by Outage Count
Top N Feeders by Outage Count
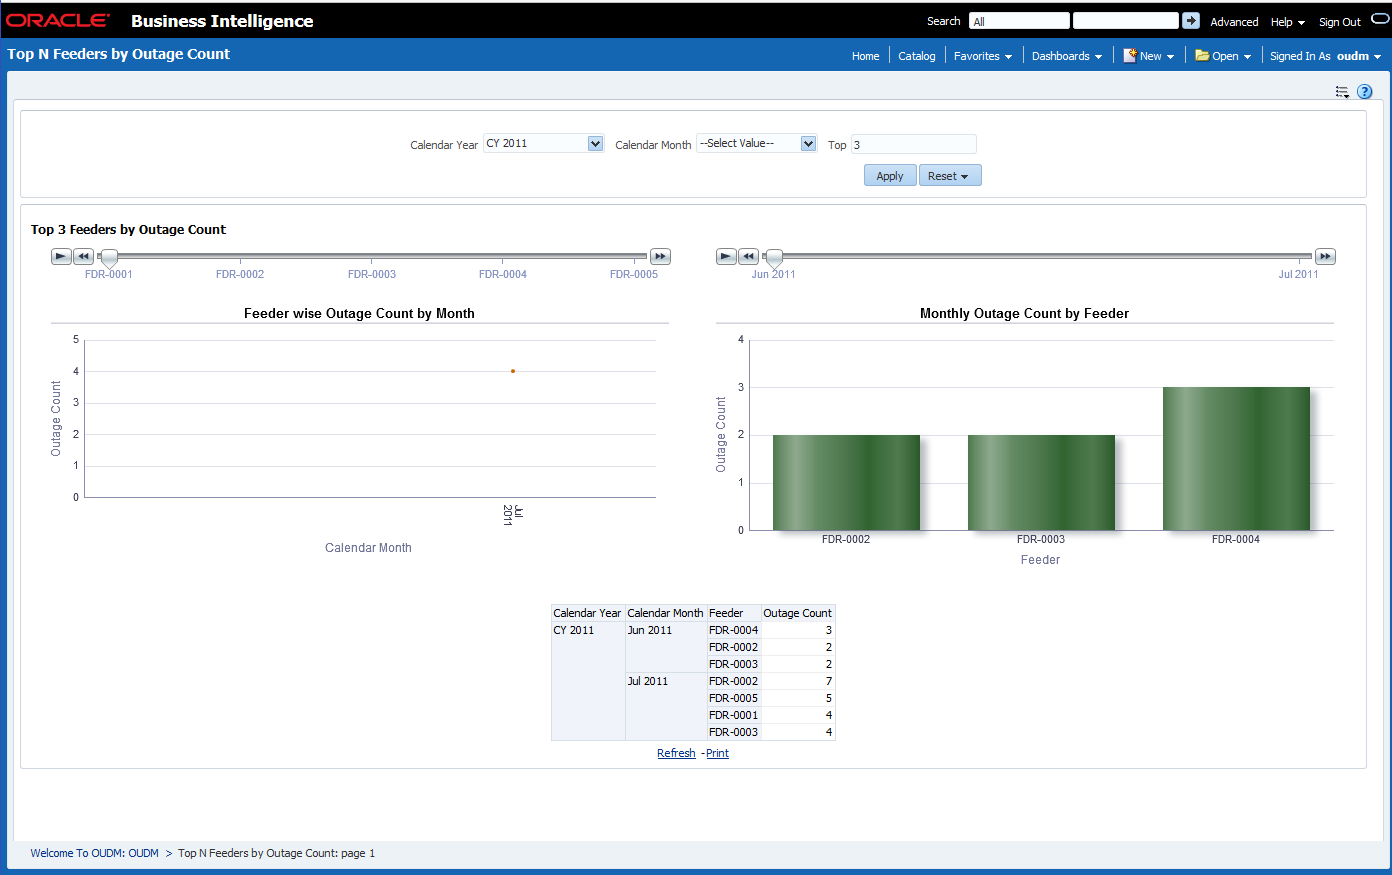
This report, as shown in Figure 12-21 provides top 10 feeder that experienced the greatest number outages.
Report dimensions are:
-
Calendar Month
-
Feeder
Figure 12-21 Outage Analysis: Top N Feeders by Outage Count
Description of "Figure 12-21 Outage Analysis: Top N Feeders by Outage Count"
Top N Feeders by Total Minutes Lost
Top N Feeders by Total Minutes Lost
This report, as shown in Figure 12-22 provides the top 100 feeders that experienced the longest outage duration.
Report dimensions are:
-
Calendar Year
-
Feeder
Figure 12-22 Outage Analysis: Top N Feeders by Total Minutes Lost
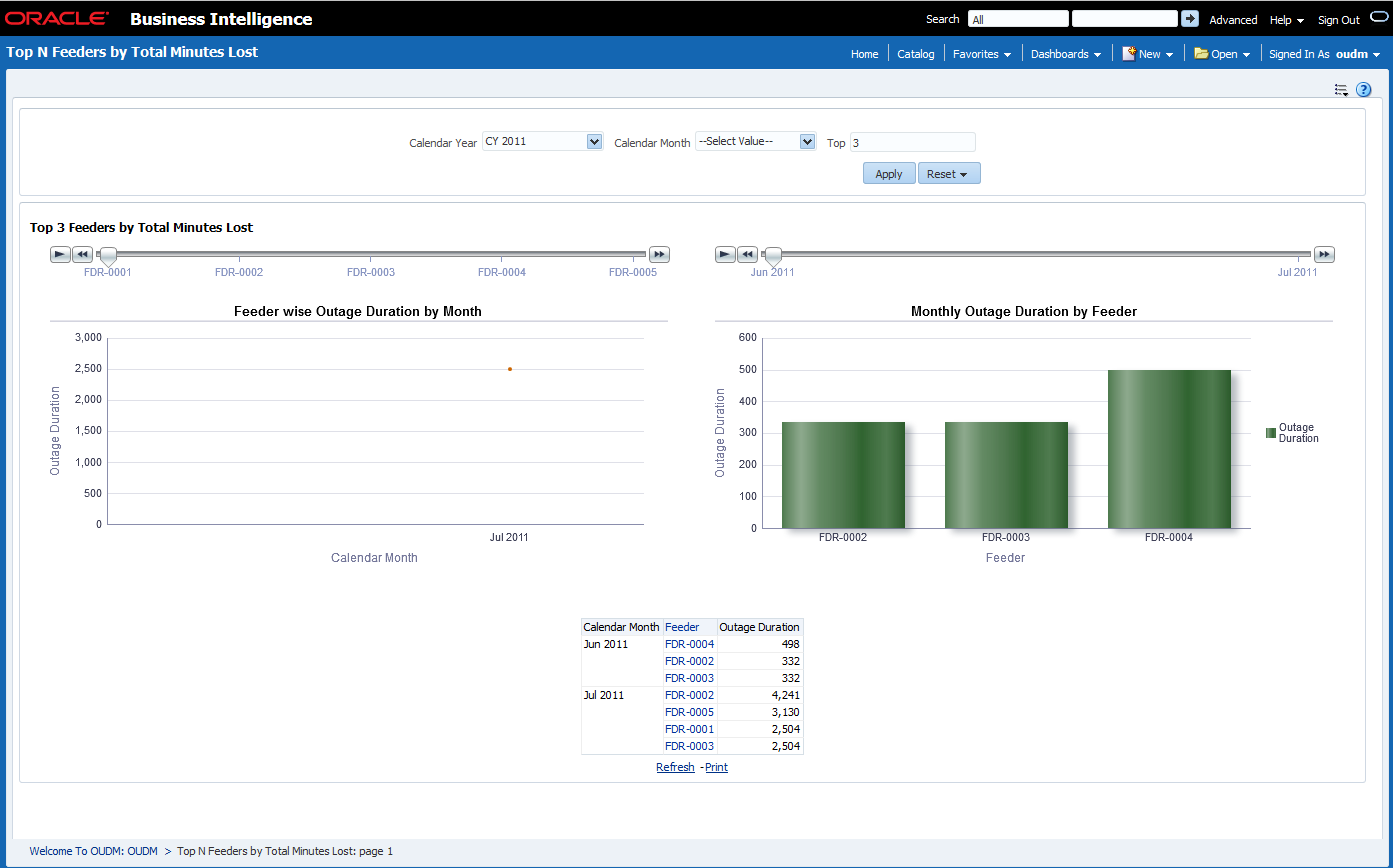
Description of "Figure 12-22 Outage Analysis: Top N Feeders by Total Minutes Lost"
Top N Feeders by Reliability Indices
Top N Feeders by Reliability Indices
This report, as shown in Figure 12-23 provides reliability by feeder. For more details, see Table 12-1.
Report dimensions are:
-
Calendar Month
-
Feeder
Figure 12-23 Outage Analysis: Top N Feeders by Reliability Indices
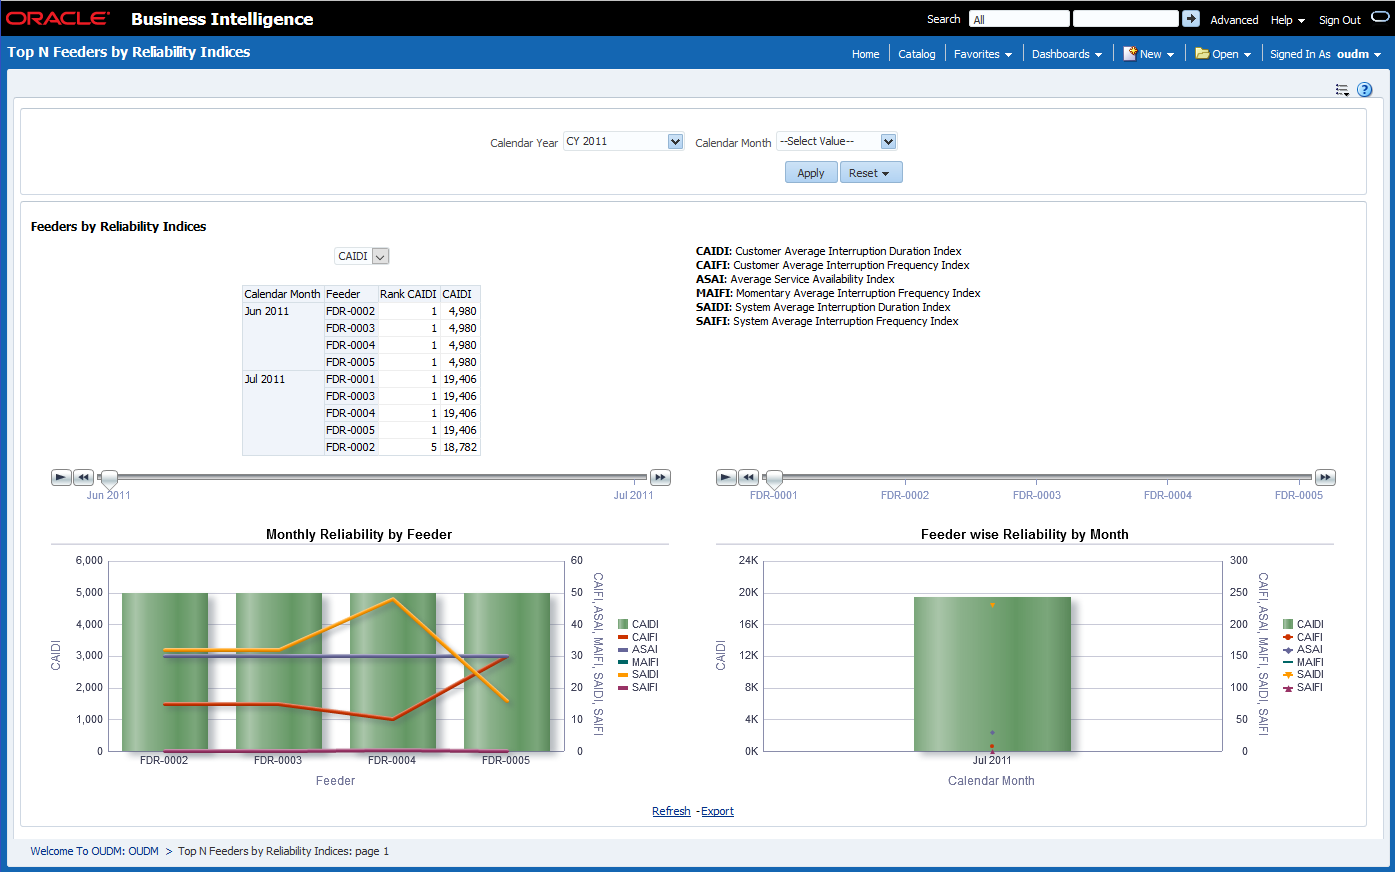
Description of "Figure 12-23 Outage Analysis: Top N Feeders by Reliability Indices"
Top N City by Outage Count
Top N City by Outage Count
This report, as shown in Figure 12-24 provides the top N feeders that experienced the greatest number outages by city.
Report dimensions are:
-
Calendar Year
-
City
Figure 12-24 Outage Analysis: Top N City by Outage Count
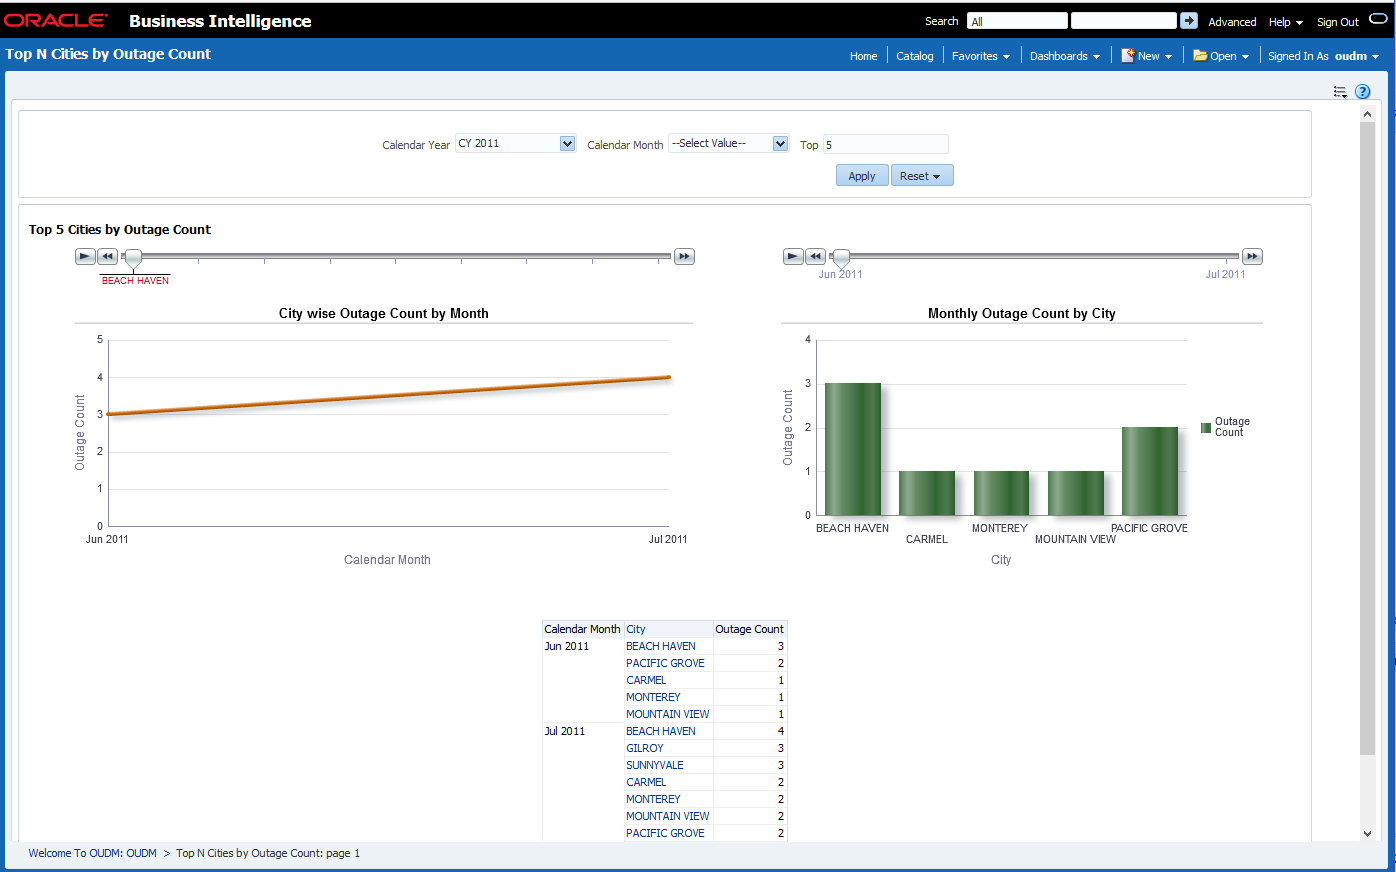
Description of "Figure 12-24 Outage Analysis: Top N City by Outage Count"
Top N City by Total Minutes Lost
Top N City by Total Minutes Lost
This report, as shown in Figure 12-25 provides the top 10 cities that experienced the longest outage duration.
Report dimensions are:
-
Calendar Month
-
City
Figure 12-25 Outage Analysis: Top N City by Total Minutes Lost
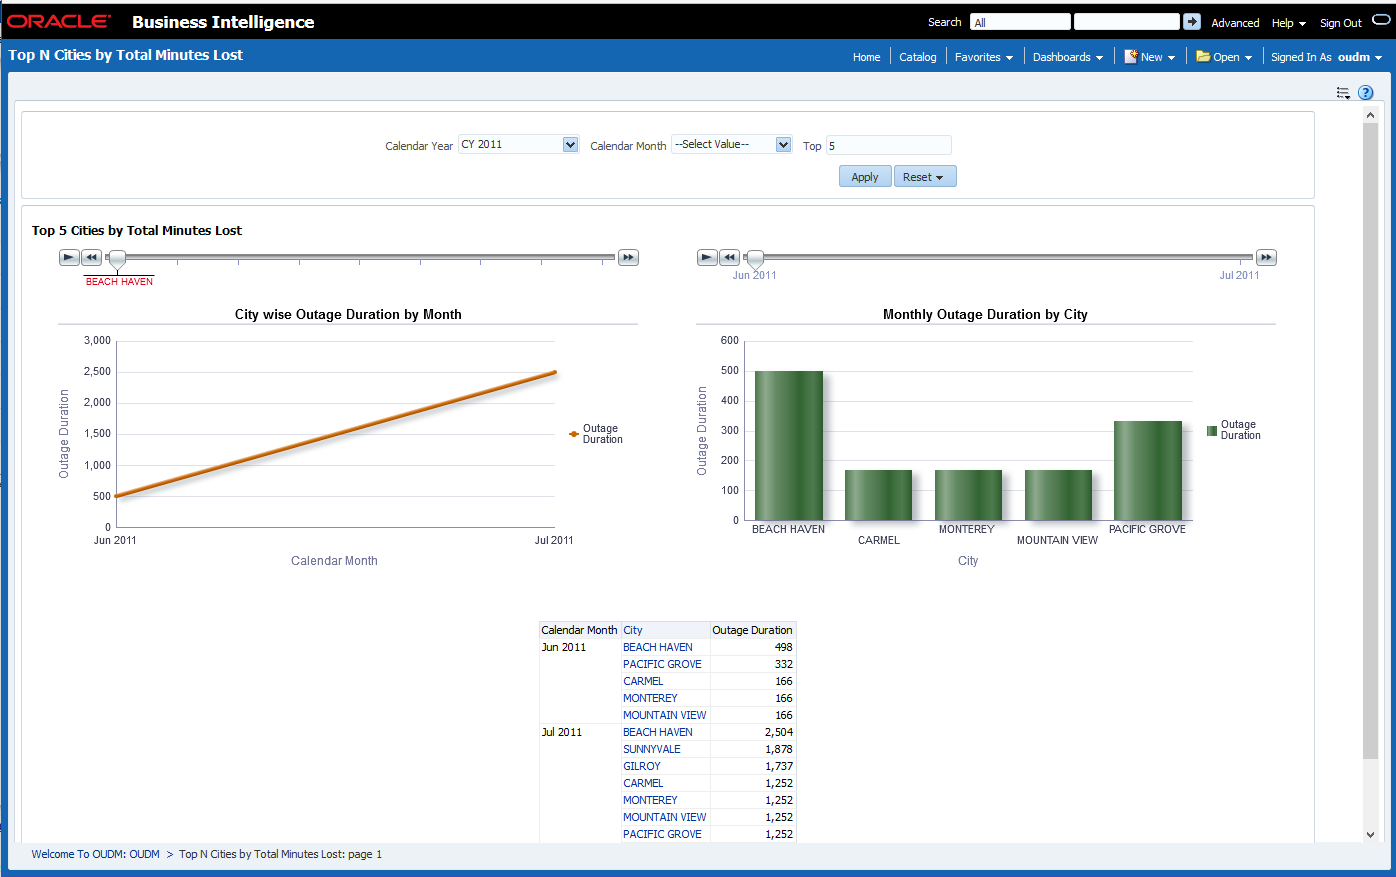
Description of "Figure 12-25 Outage Analysis: Top N City by Total Minutes Lost"
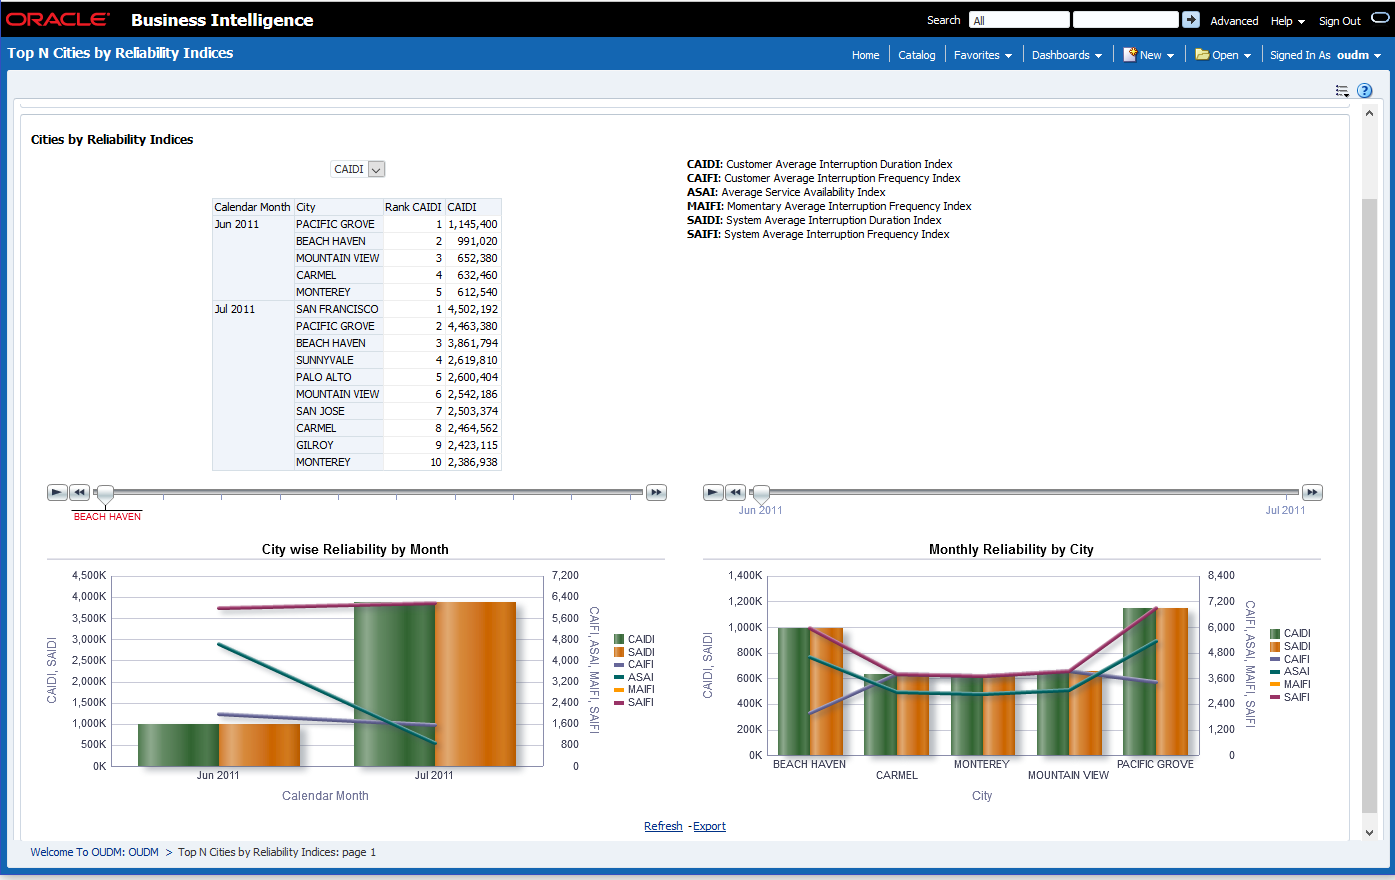
Top N City by Reliability Indices
Top N City by Reliability Indices
This report, as shown in Figure 12-26 provides reliability by city. For more details, see Table 12-1.
Report dimensions are:
-
Calendar Month
-
City
Figure 12-26 Outage Analysis: Top N City by Reliability Indices
Description of "Figure 12-26 Outage Analysis: Top N City by Reliability Indices"
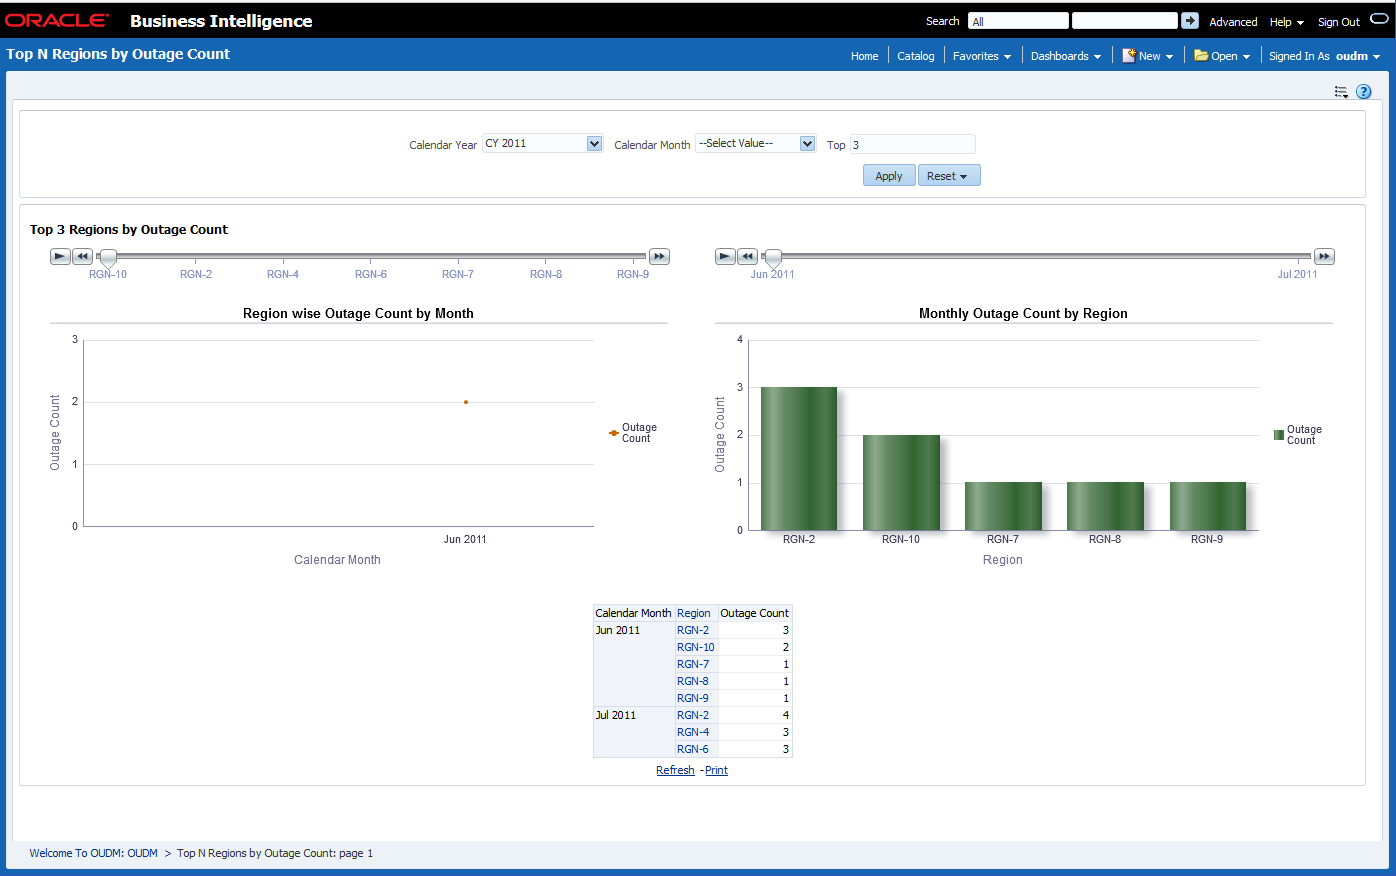
Top N Region by Outage Count
Top N Region by Outage Count
This report, as shown in Figure 12-27 provides the top N feeder that experienced the greatest number outages by region.
Report dimensions are:
-
Calendar Month
-
Regional Zones
-
Usage Point
-
Region
-
Subregion
-
Figure 12-27 Outage Analysis: Top N Region by Outage Count
Description of "Figure 12-27 Outage Analysis: Top N Region by Outage Count"
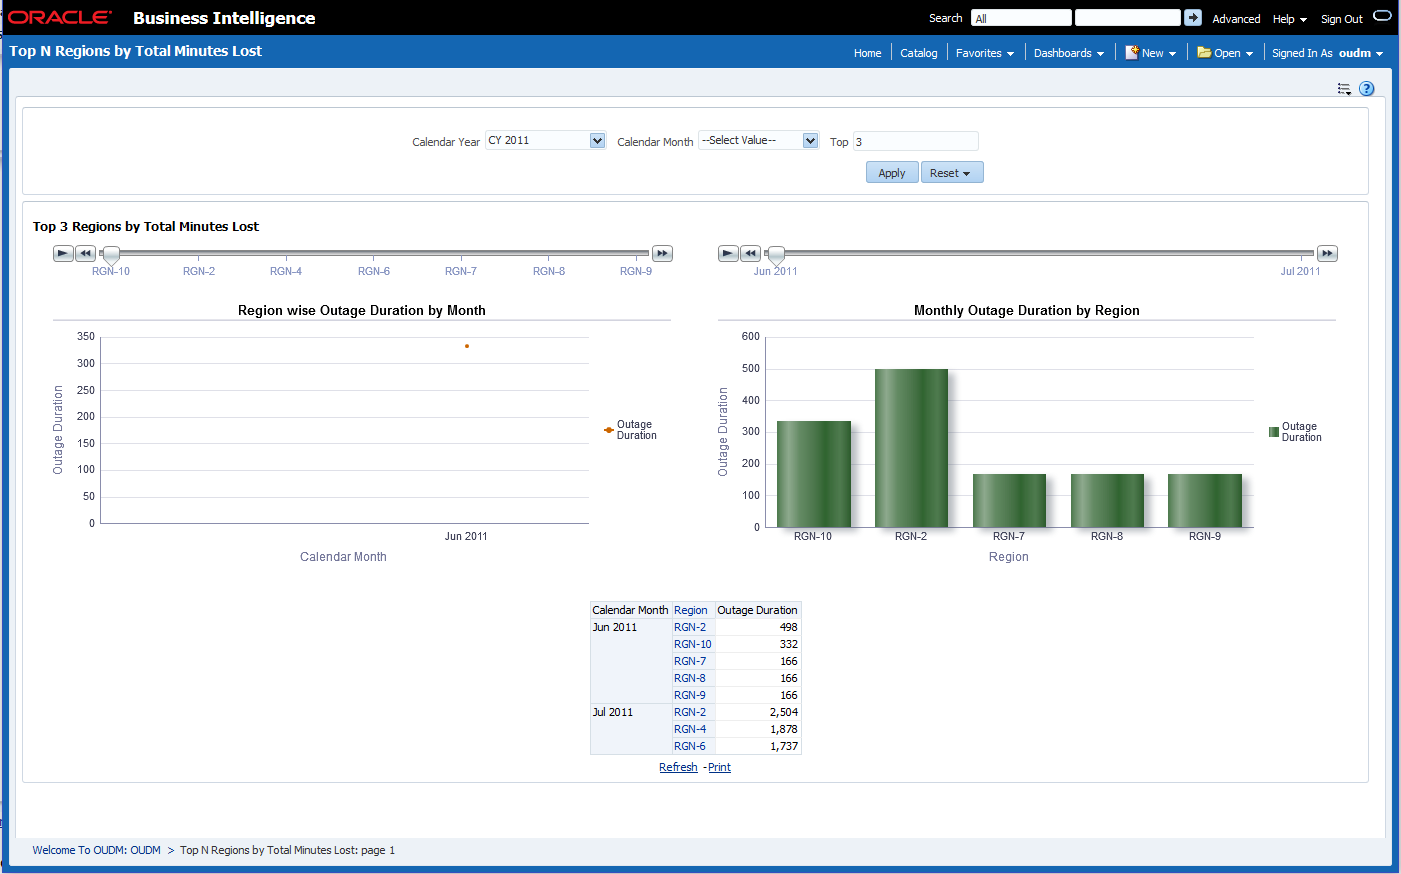
Top N Region by Total Minutes Lost
Top N Region by Total Minutes Lost
This report, as shown in Figure 12-28 provides the region that experienced the longest outage duration.
Report dimensions are:
-
Calendar Year
-
Regional Zones
-
Usage Point
-
Subregion
-
Region
-
Figure 12-28 Outage Analysis: Top N Region by Total Minutes Lost
Description of "Figure 12-28 Outage Analysis: Top N Region by Total Minutes Lost"
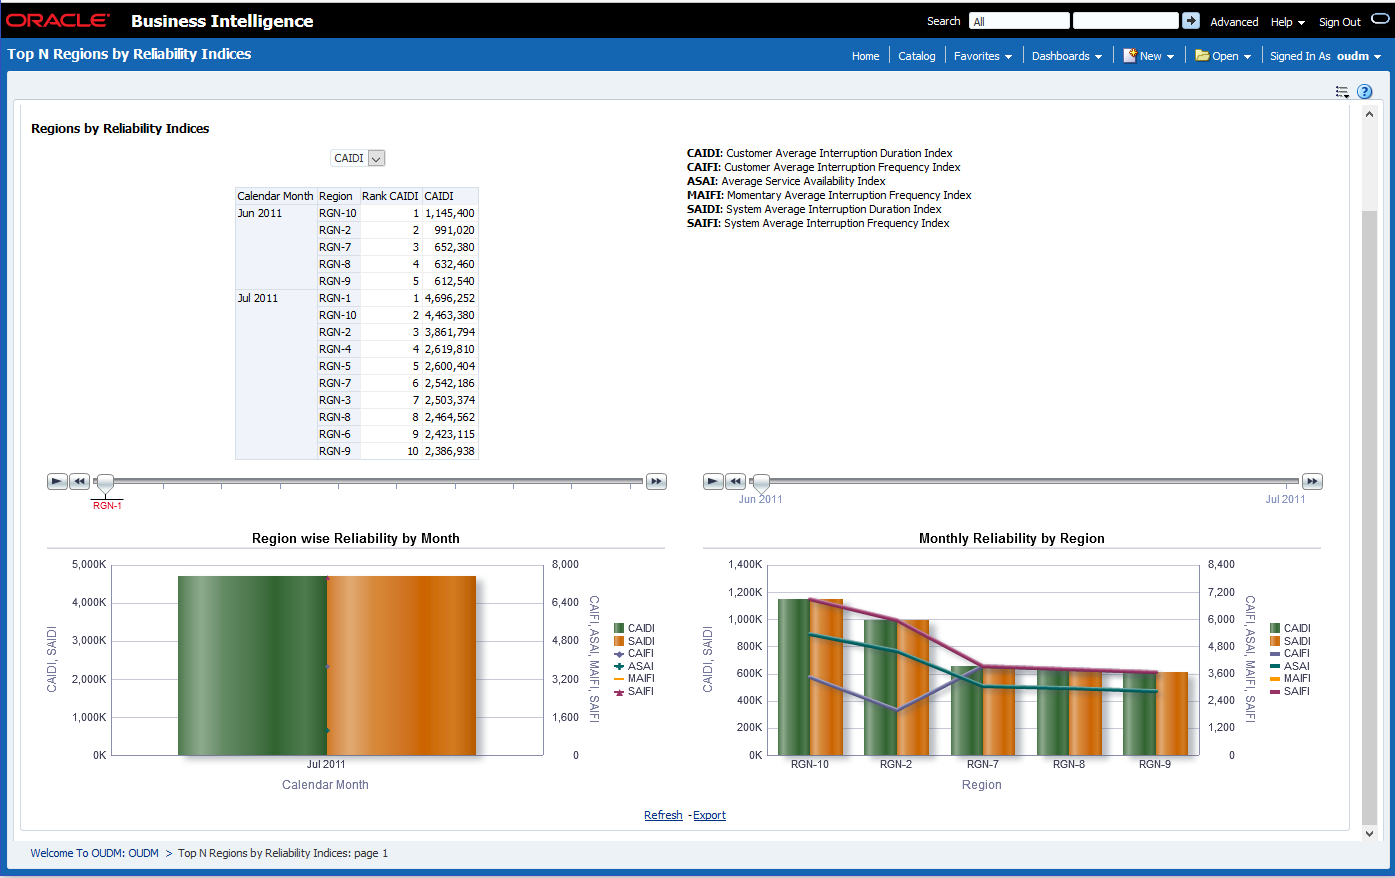
Top N Region by Reliability Indices
Top N Region by Reliability Indices
This report, as shown in Figure 12-29 provides reliability by region. For more details, see Table 12-1.
Report dimensions are:
-
Calendar Month
-
Regional Zones
-
Usage Point
-
Region
-
Subregion
-
Figure 12-29 Outage Analysis: Top N Region by Reliability Indices
Description of "Figure 12-29 Outage Analysis: Top N Region by Reliability Indices"
Revenue Protection Sample Reports
The revenue protection sample reports show the following areas:
Meter Tamper Event
This area includes the reports:
Meter Tamper Event: Region
This report, as shown in Figure 12-30 provides the number of meter tamper events based on region in a given period.
Report dimensions are:
-
Calendar Month
-
Regional Zones
-
Usage Point
-
Region
-
Subregion
-
Figure 12-30 Revenue Protection: Meter Tamper Event Region
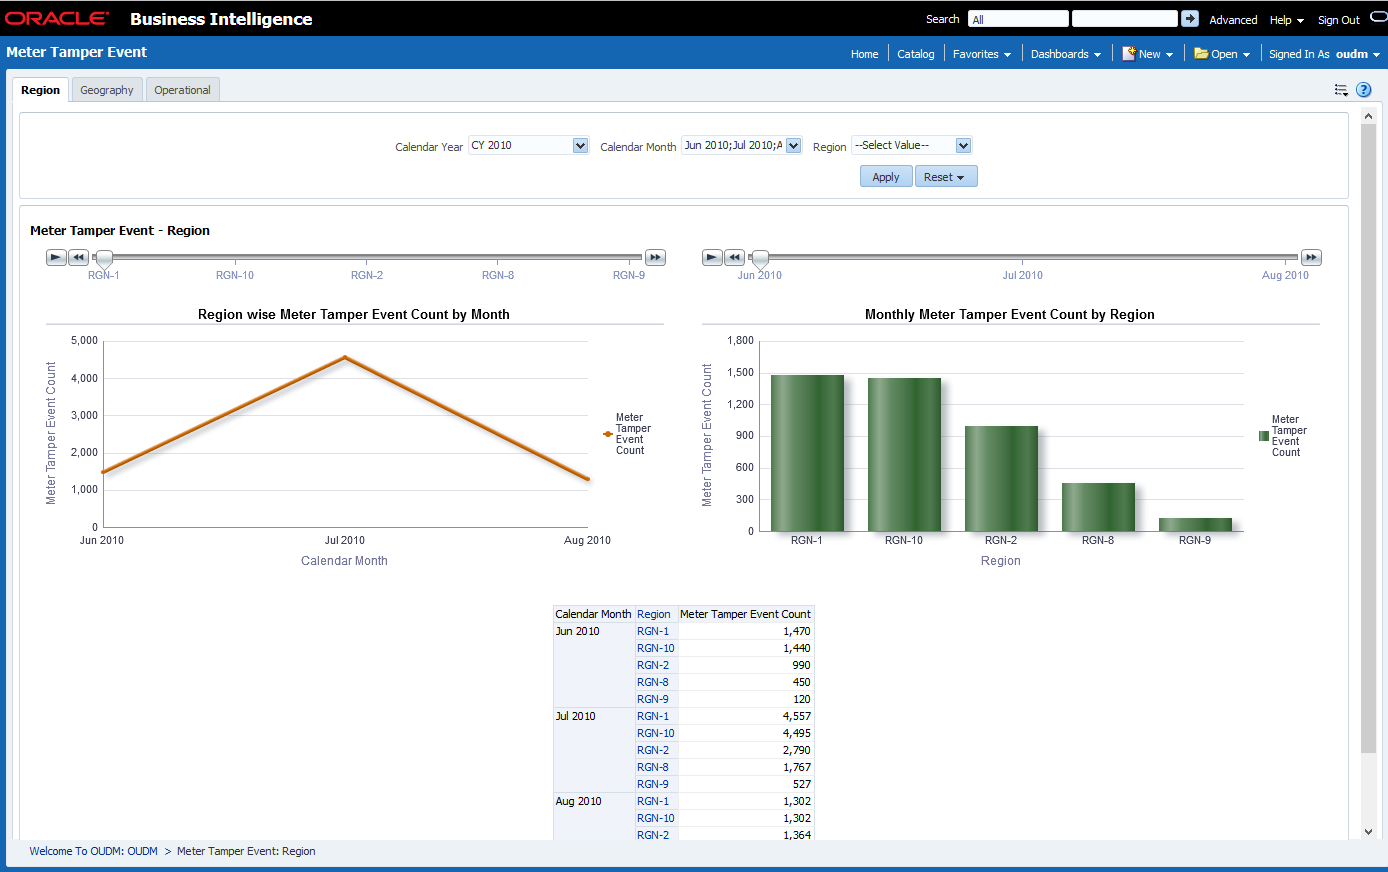
Description of "Figure 12-30 Revenue Protection: Meter Tamper Event Region"
Meter Tamper Event: Geography
This report, as shown in Figure 12-31 provides the number of meter tamper events based on geography in a given period.
Report dimensions are:
-
Calendar Month
-
Geographical Zones
-
Usage Point
-
City
-
State
-
Figure 12-31 Revenue Protection: Meter Tamper Event Geography
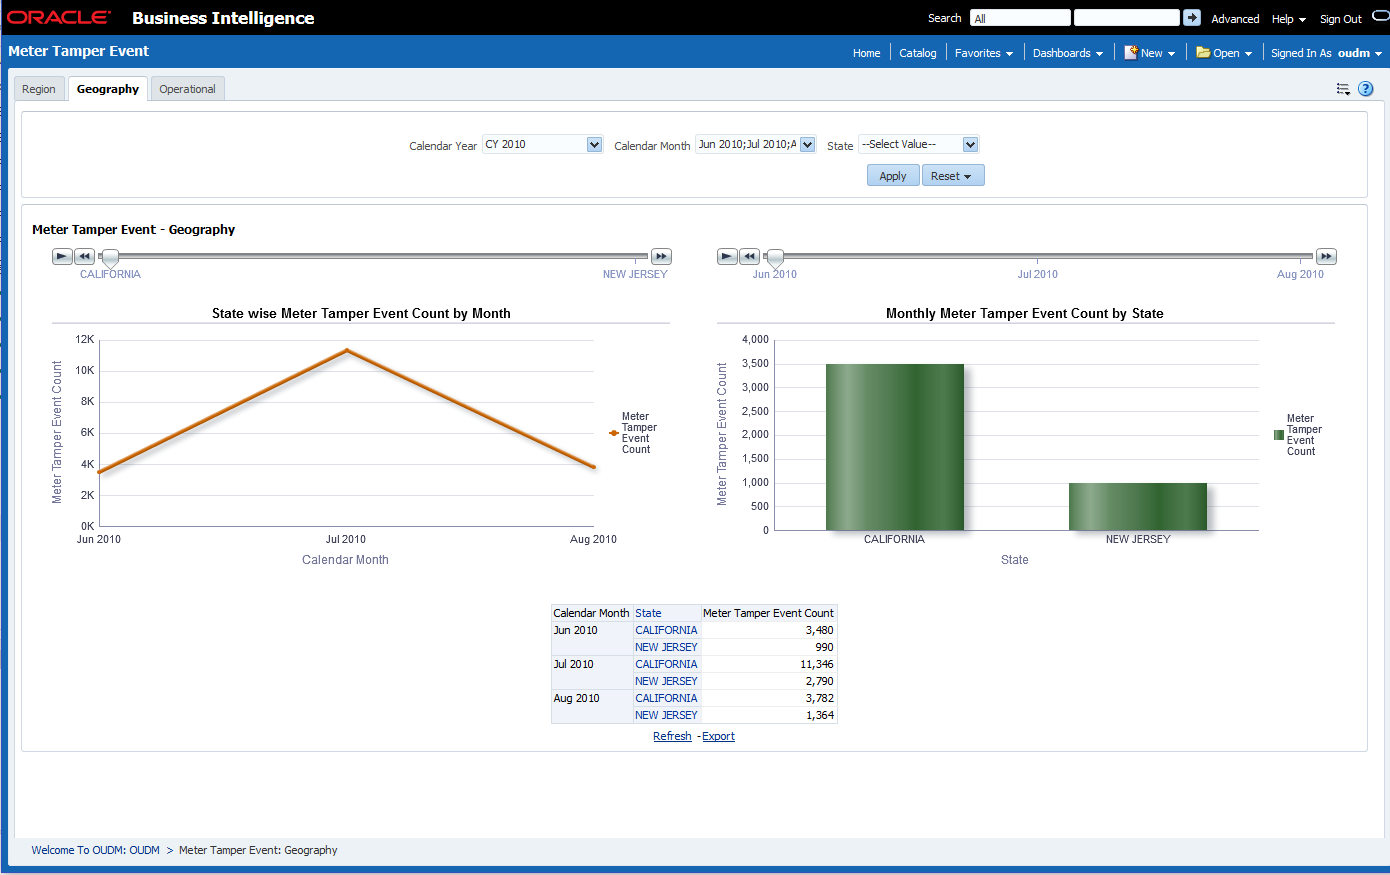
Description of "Figure 12-31 Revenue Protection: Meter Tamper Event Geography"
Meter Tamper Event: Operational
This report, as shown in Figure 12-32 provides the number of meter tamper events based on operation in a given period.
Report dimensions are:
-
Calendar Month
-
Operational
-
Usage Point
-
Transformer
-
Feeder
-
Substation
-
Figure 12-32 Revenue Protection: Meter Tamper Event Operational
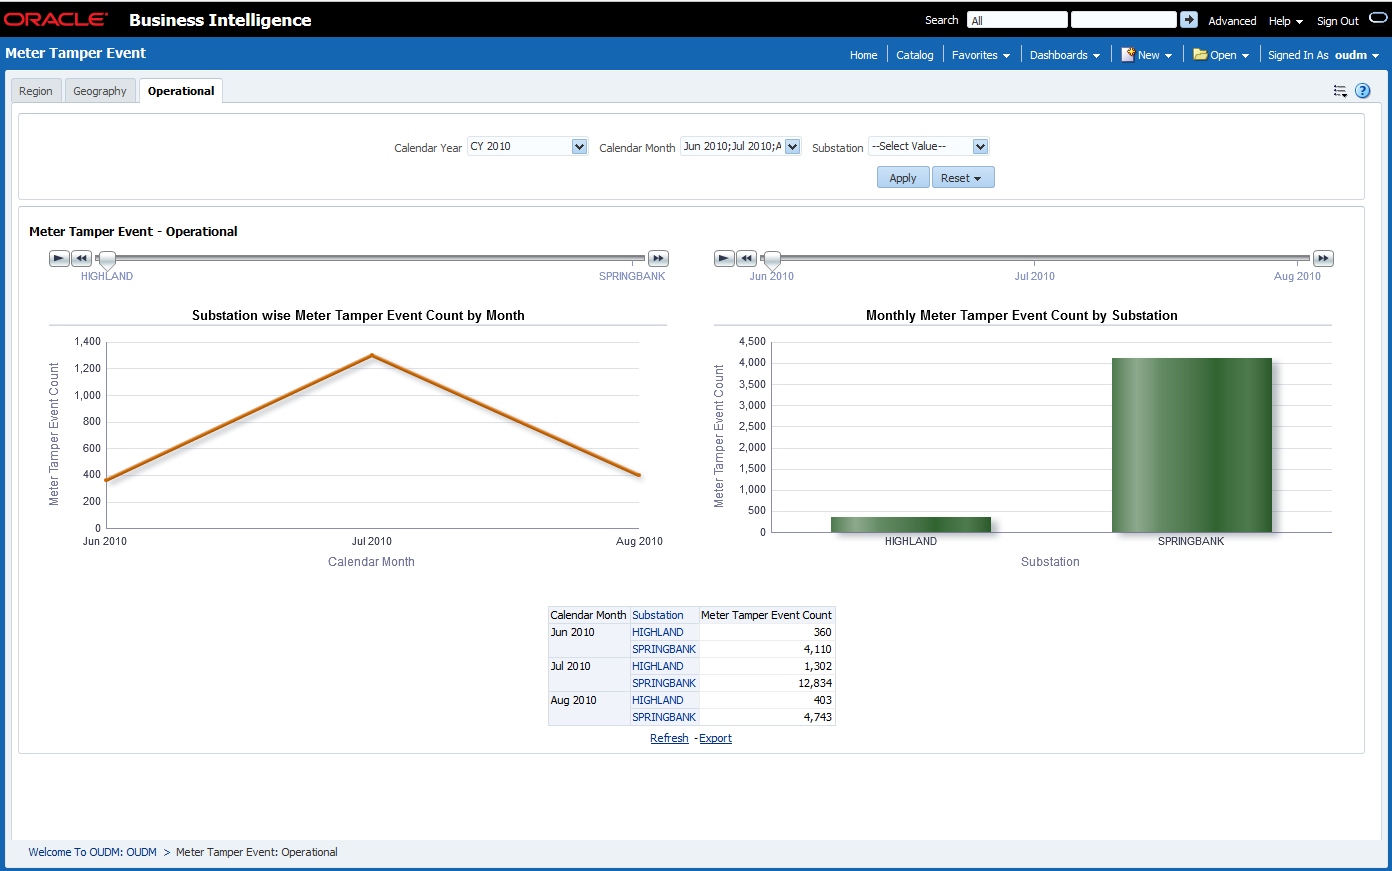
Description of "Figure 12-32 Revenue Protection: Meter Tamper Event Operational"
Meter Stopped Event
This area includes the reports:
Meter Stopped Event: Region
This report, as shown in Figure 12-33 identifies devices that were sending measurements and then stopped for some reason. View details by region.
Report dimensions are:
-
Calendar Month
-
Regional Zones
-
Usage Point
-
Region
-
Subregion
-
Figure 12-33 Revenue Protection: Meter Stopped Event Region
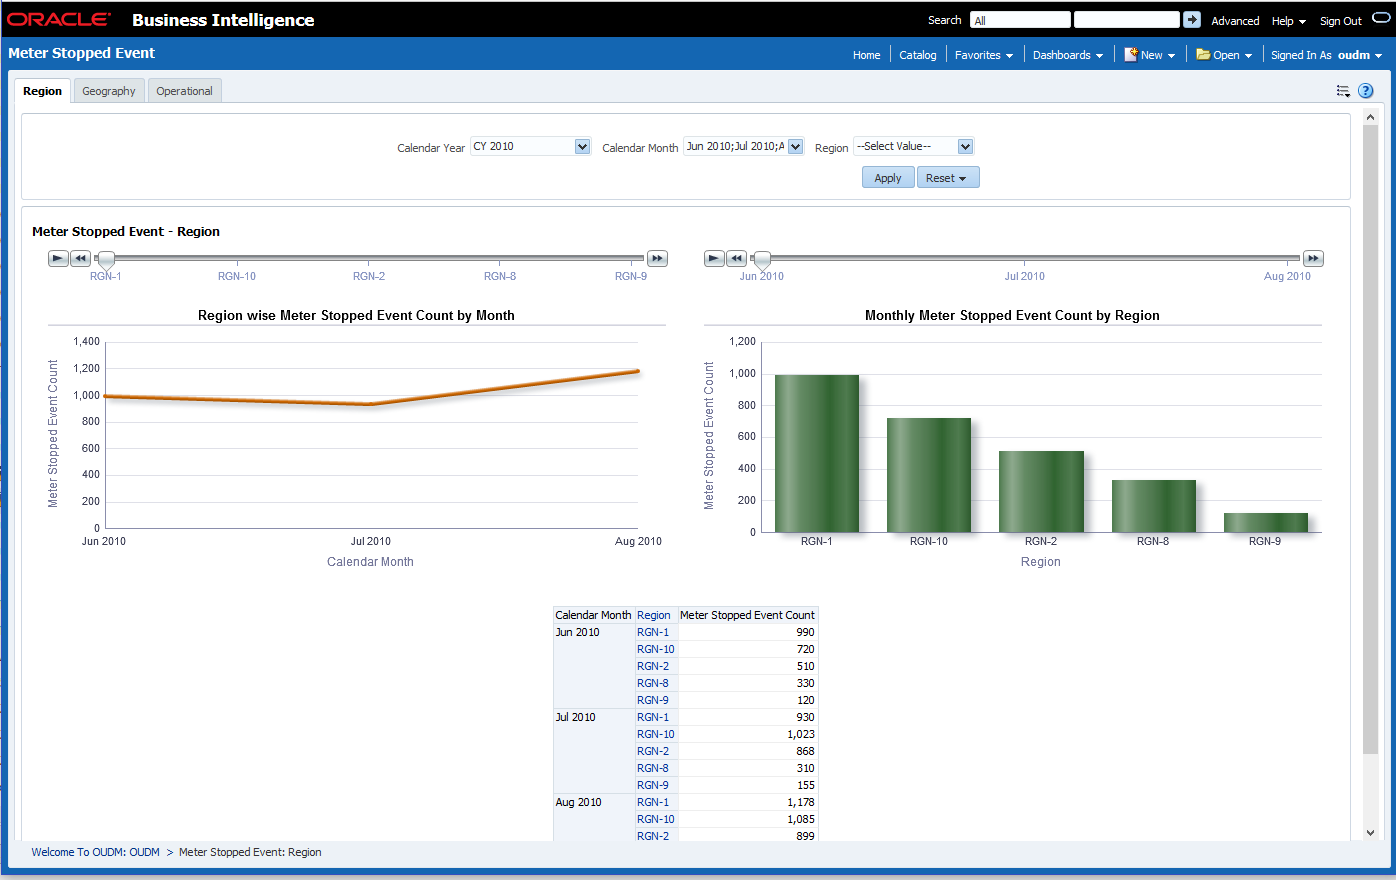
Description of "Figure 12-33 Revenue Protection: Meter Stopped Event Region"
Meter Stopped Event: Geography
This report, as shown in Figure 12-34 identifies devices that were sending measurements and then stopped for some reason. View details by geography.
Report dimensions are:
-
Calendar Month
-
Geographical Zones
-
Usage Point
-
City
-
State
-
Figure 12-34 Revenue Protection: Meter Stopped Event Geography
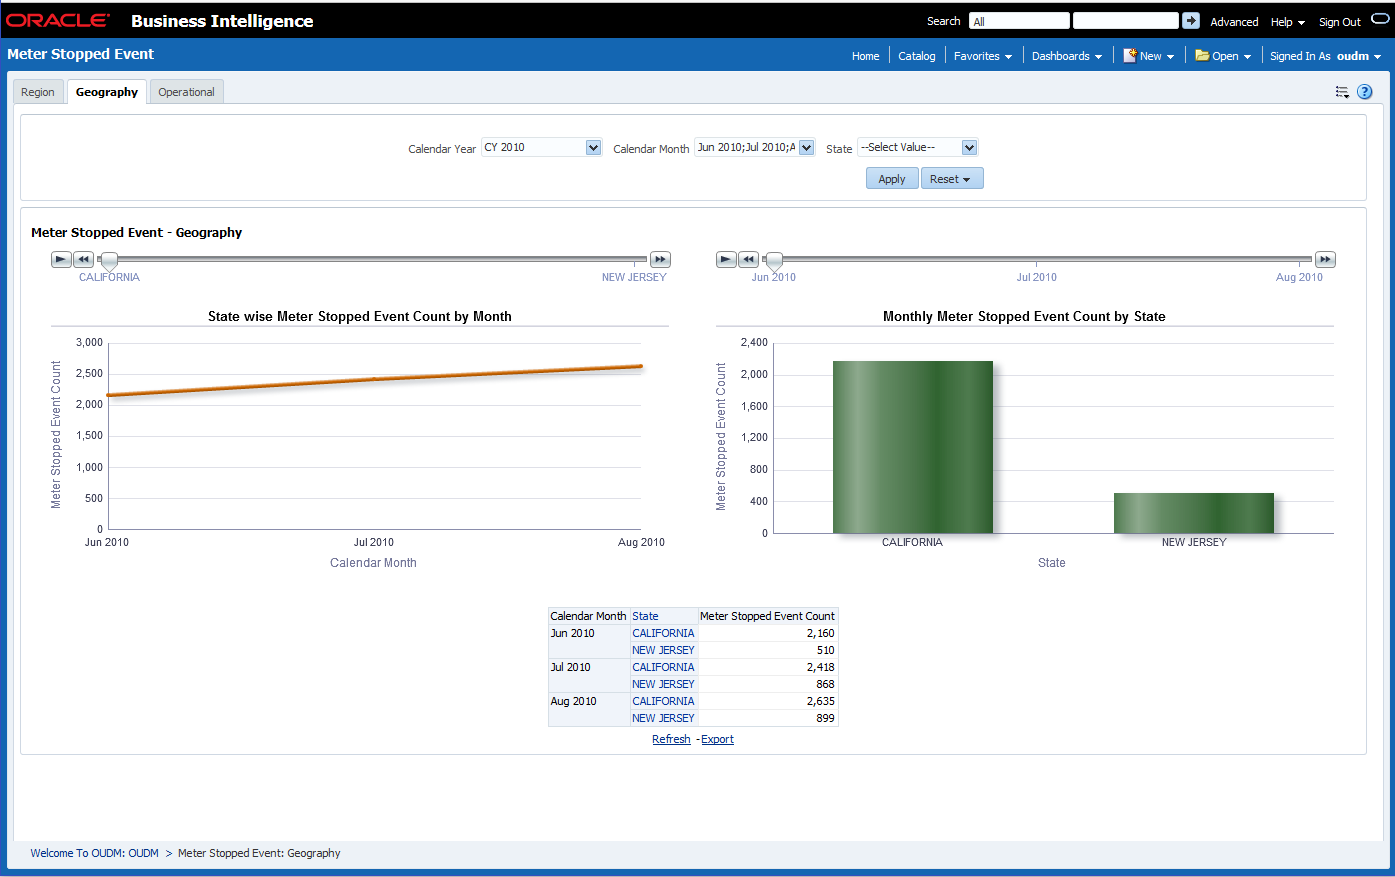
Description of "Figure 12-34 Revenue Protection: Meter Stopped Event Geography"
Meter Stopped Event: Operational
This report, as shown in Figure 12-35 identifies devices that were sending measurements and then stopped for some reason. View details by substation and operational zone.
Report dimensions are:
-
Calendar Month
-
Operational
-
Usage Point
-
Transformer
-
Feeder
-
Substation
-
Figure 12-35 Revenue Protection: Meter Stopped Event Operational
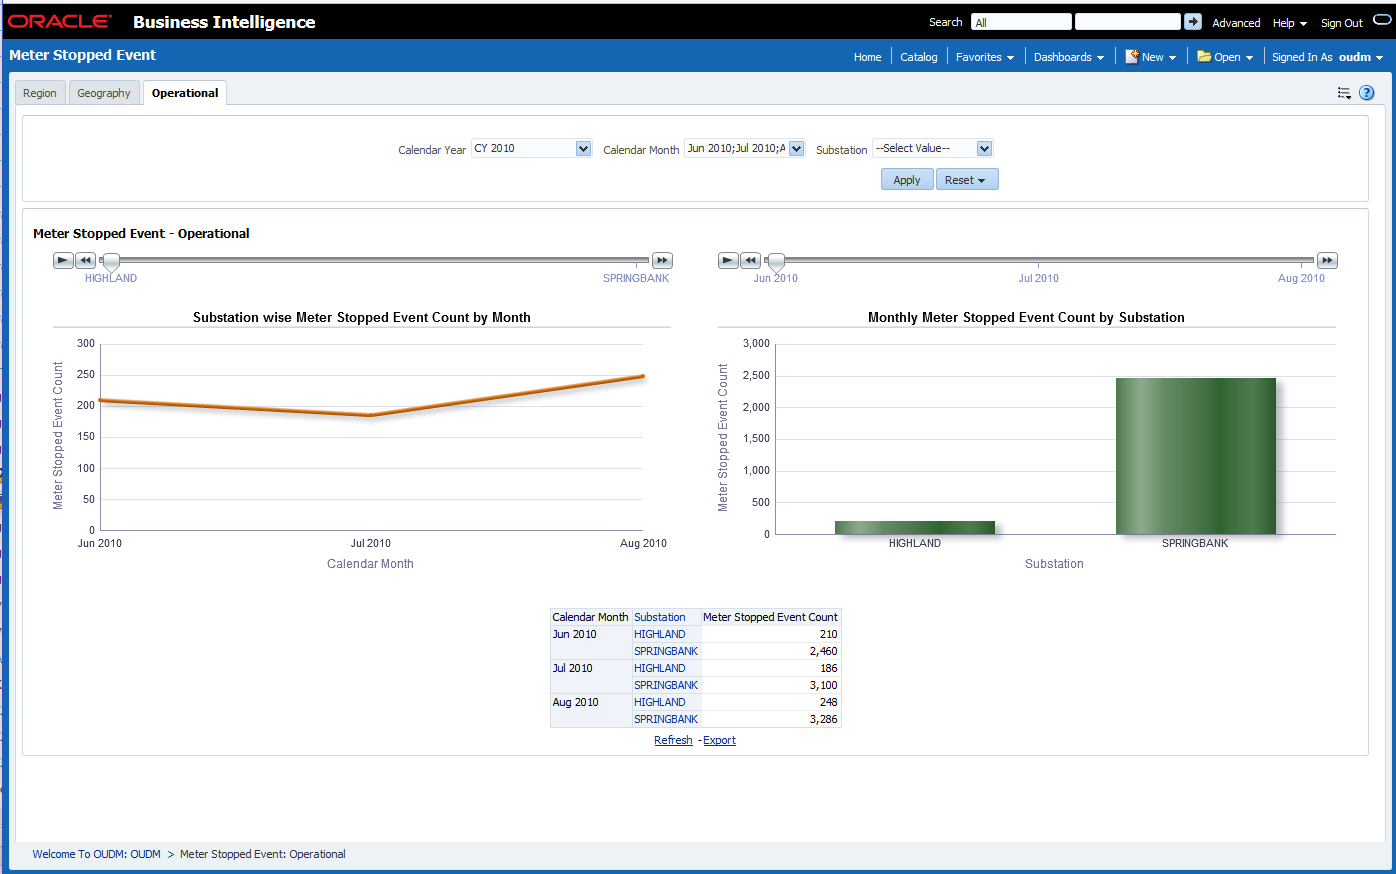
Description of "Figure 12-35 Revenue Protection: Meter Stopped Event Operational"
Meter Reversed Event
This area includes the reports:
Meter Reversed Event: Region
This report, as shown in Figure 12-36 identifies reversed meters for a region in a given period.
Report dimensions are:
-
Calendar Month
-
Regional Zones
-
Usage Point
-
Region
-
Subregion
-
Figure 12-36 Revenue Protection: Meter Reversed Event Region
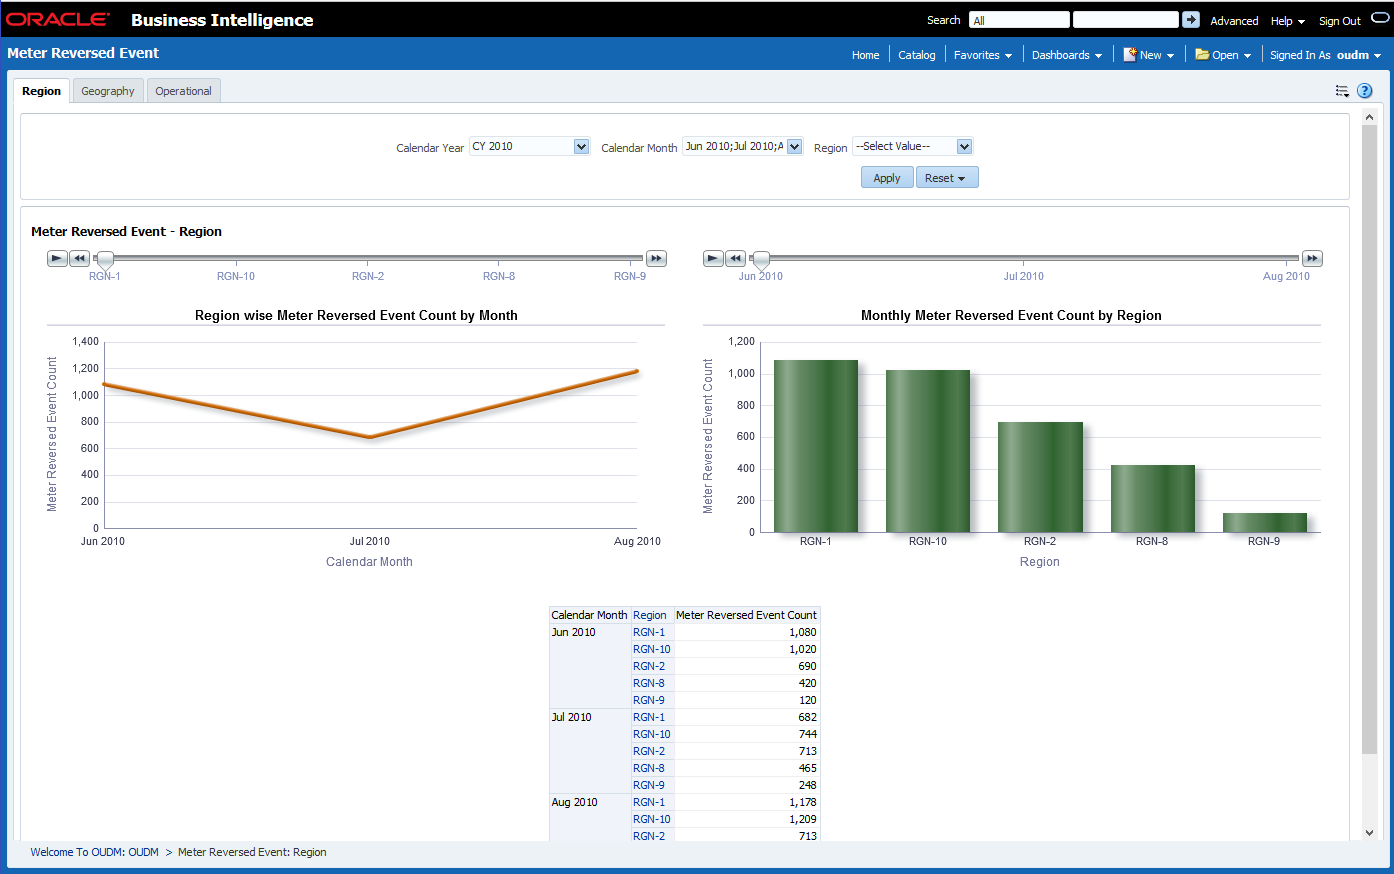
Description of "Figure 12-36 Revenue Protection: Meter Reversed Event Region"
Meter Reversed Event: Geography
This report, as shown in Figure 12-37 identifies reversed meters for a geography in a given period.
Report dimensions are:
-
Calendar Month
-
Geographical Zones:
-
Usage Point
-
City
-
State
-
Figure 12-37 Revenue Protection: Meter Reversed Event Geography
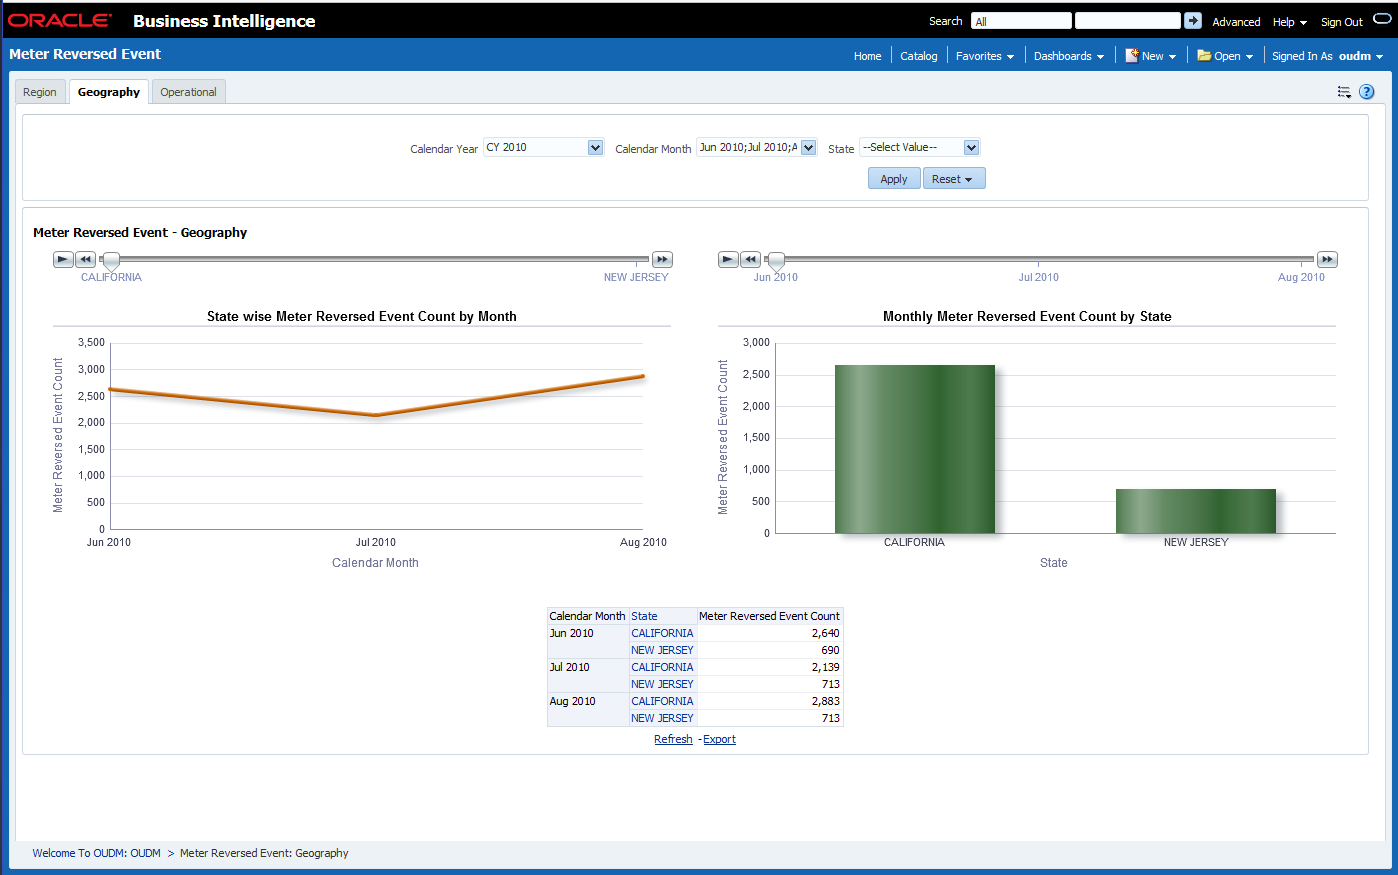
Description of "Figure 12-37 Revenue Protection: Meter Reversed Event Geography"
Meter Reversed Event: Operational
This report, as shown in Figure 12-38 identifies reversed meters for a substation in a given period.
Report dimensions are:
-
Calendar Month
-
Operational
-
Usage Point
-
Transformer
-
Feeder
-
Substation
-
Figure 12-38 Revenue Protection: Meter Reversed Event Operational
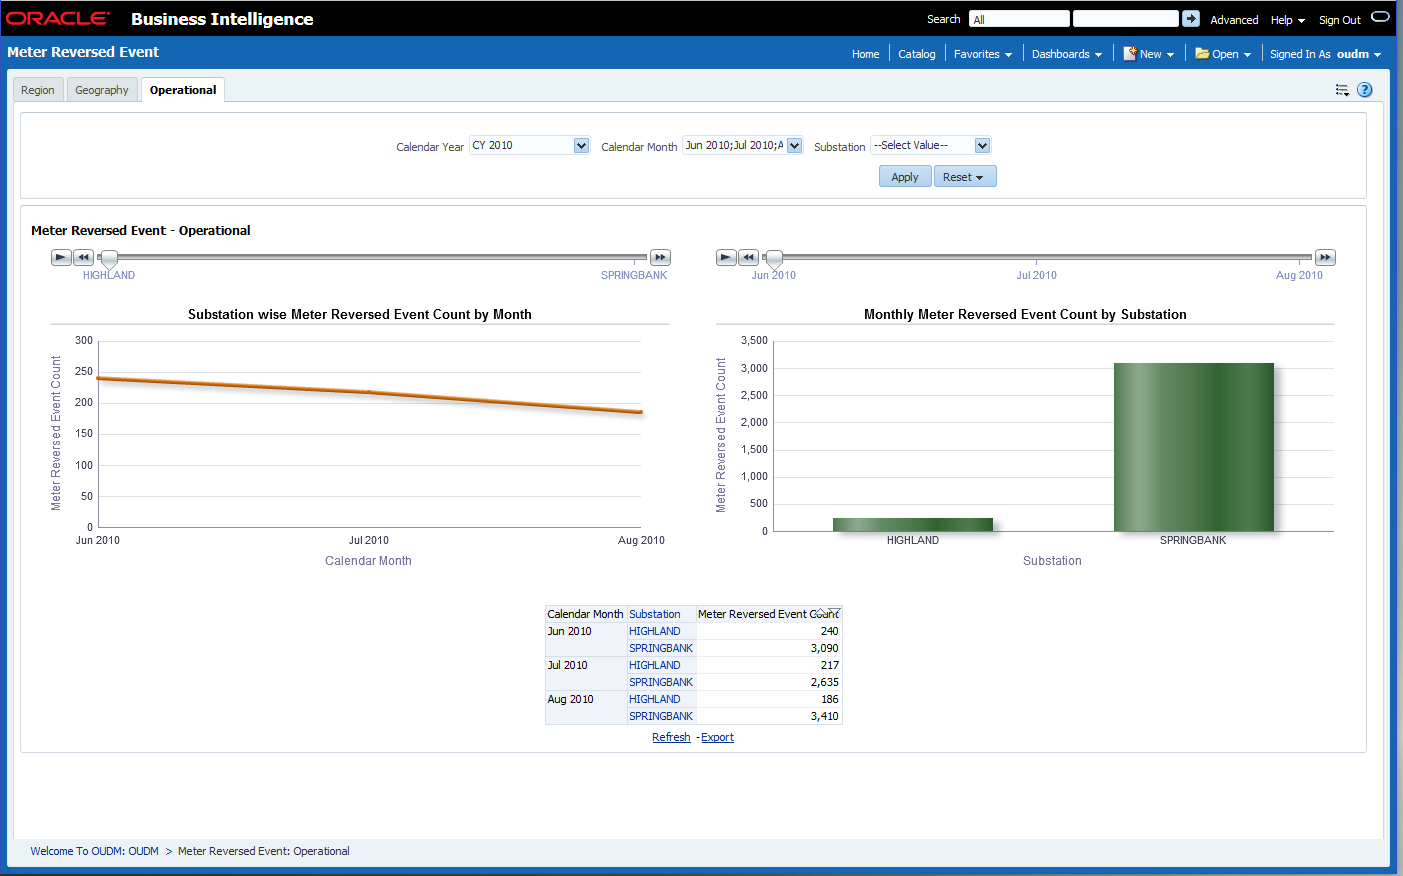
Description of "Figure 12-38 Revenue Protection: Meter Reversed Event Operational"
Missing Meter Read
This area includes the report
Missing Meter Read
This report, as shown in Figure 12-39 identifies meters with no interval reads in the specified time period.
Report dimensions are:
-
Day
-
Meter
Figure 12-39 Revenue Protection: Missing Meter Read
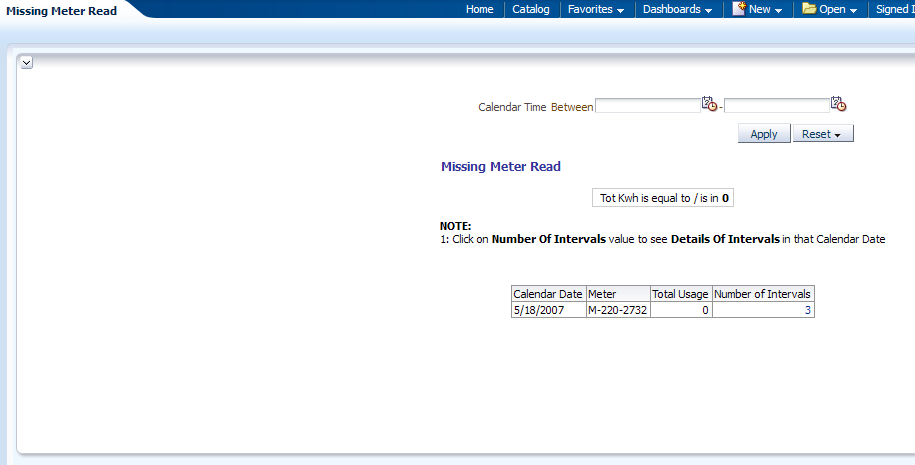
Description of "Figure 12-39 Revenue Protection: Missing Meter Read"
Event Analysis
This area includes the report:
Event Analysis
This report, as shown in Figure 12-40 provides information on meter events.
Report dimensions are:
-
Calendar Month
-
Meter
-
Product Asset Model
-
Regional Zones
-
Usage Point
-
Region
-
Subregion
-
Figure 12-40 Revenue Protection: Event Analysis
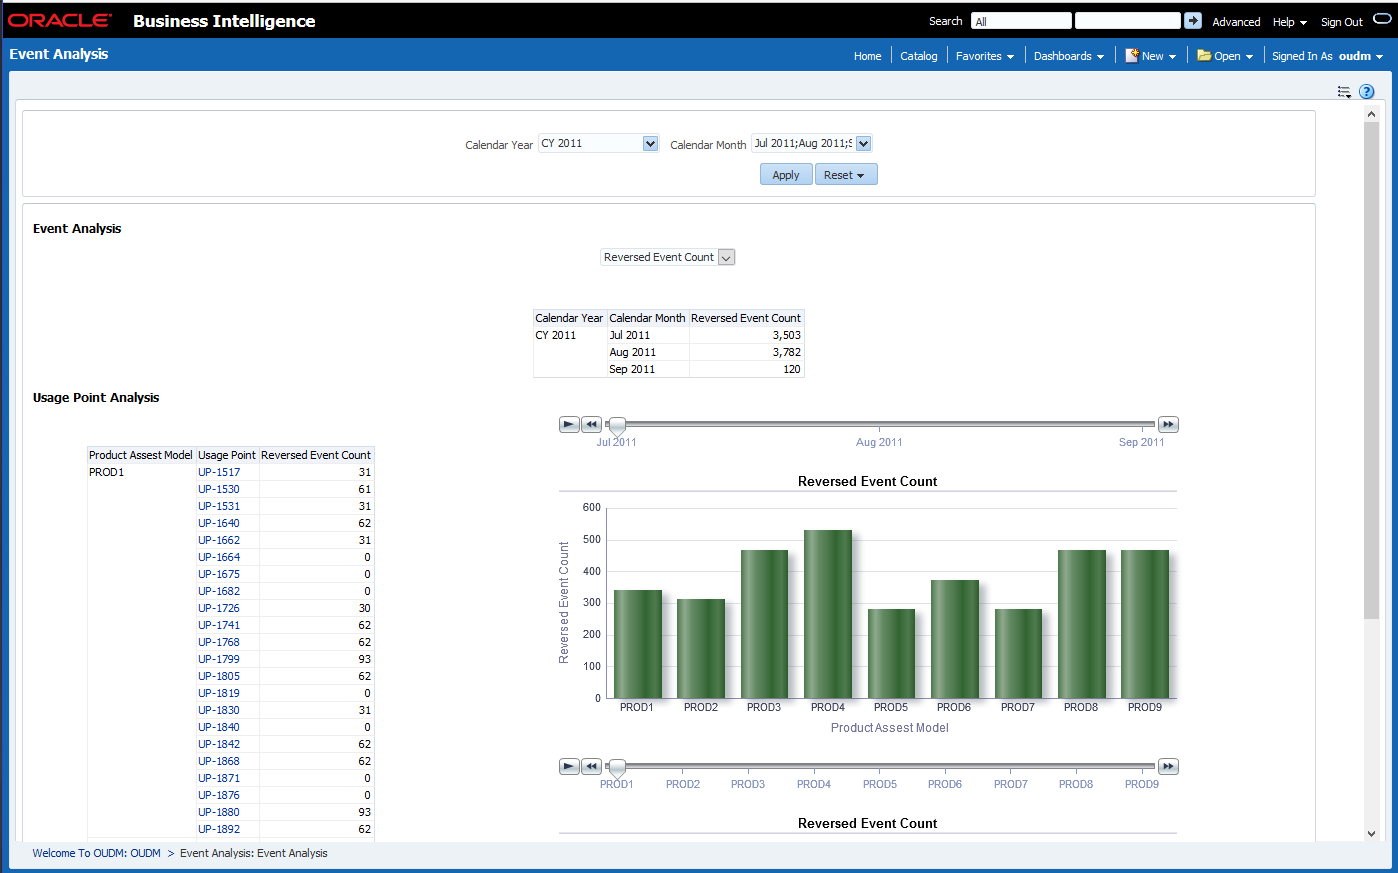
Description of "Figure 12-40 Revenue Protection: Event Analysis"
Load Analysis Sample Reports
The load analysis sample reports include the following areas:
Daily Load Profile
This area includes the reports:
Daily Load Profile
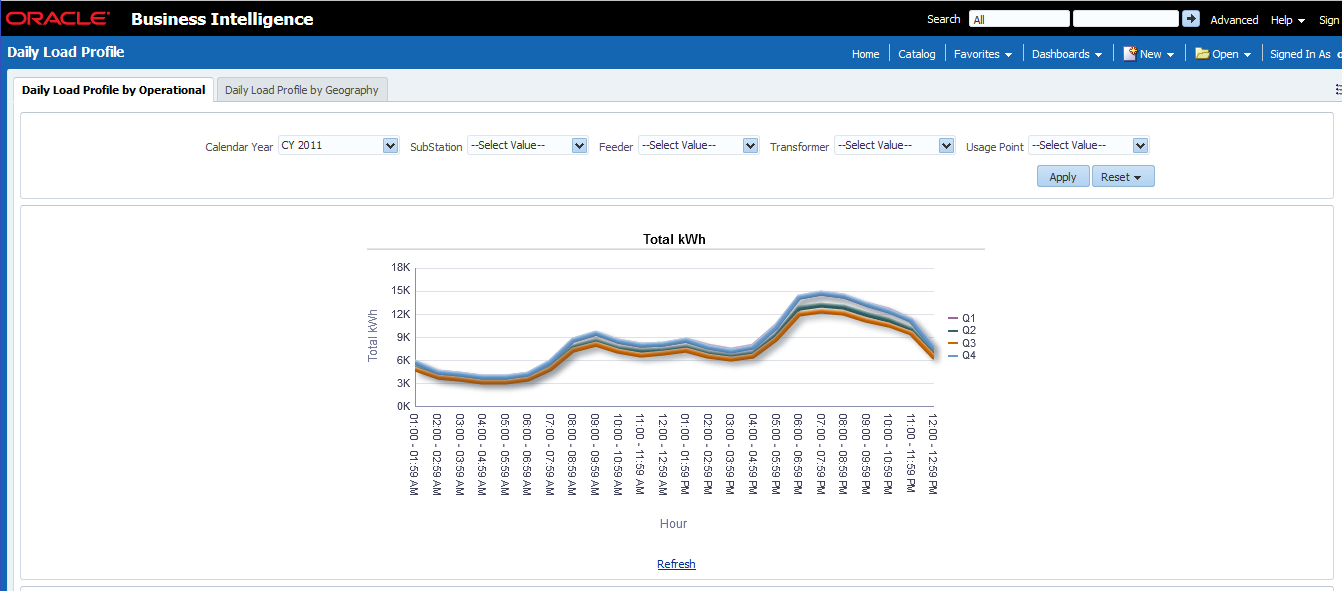
This report, as shown in Figure 12-41 and Figure 12-42 provides the daily average loading status for a selected operational area over a given time period.
Report dimensions are:
-
Calendar Month
-
Day
-
Hour
-
Operational
-
Usage Point
-
Transformer
-
Feeder
-
Substation
-
Figure 12-42 Daily Load Profile (Q1, Q2, Q3, and Q4)
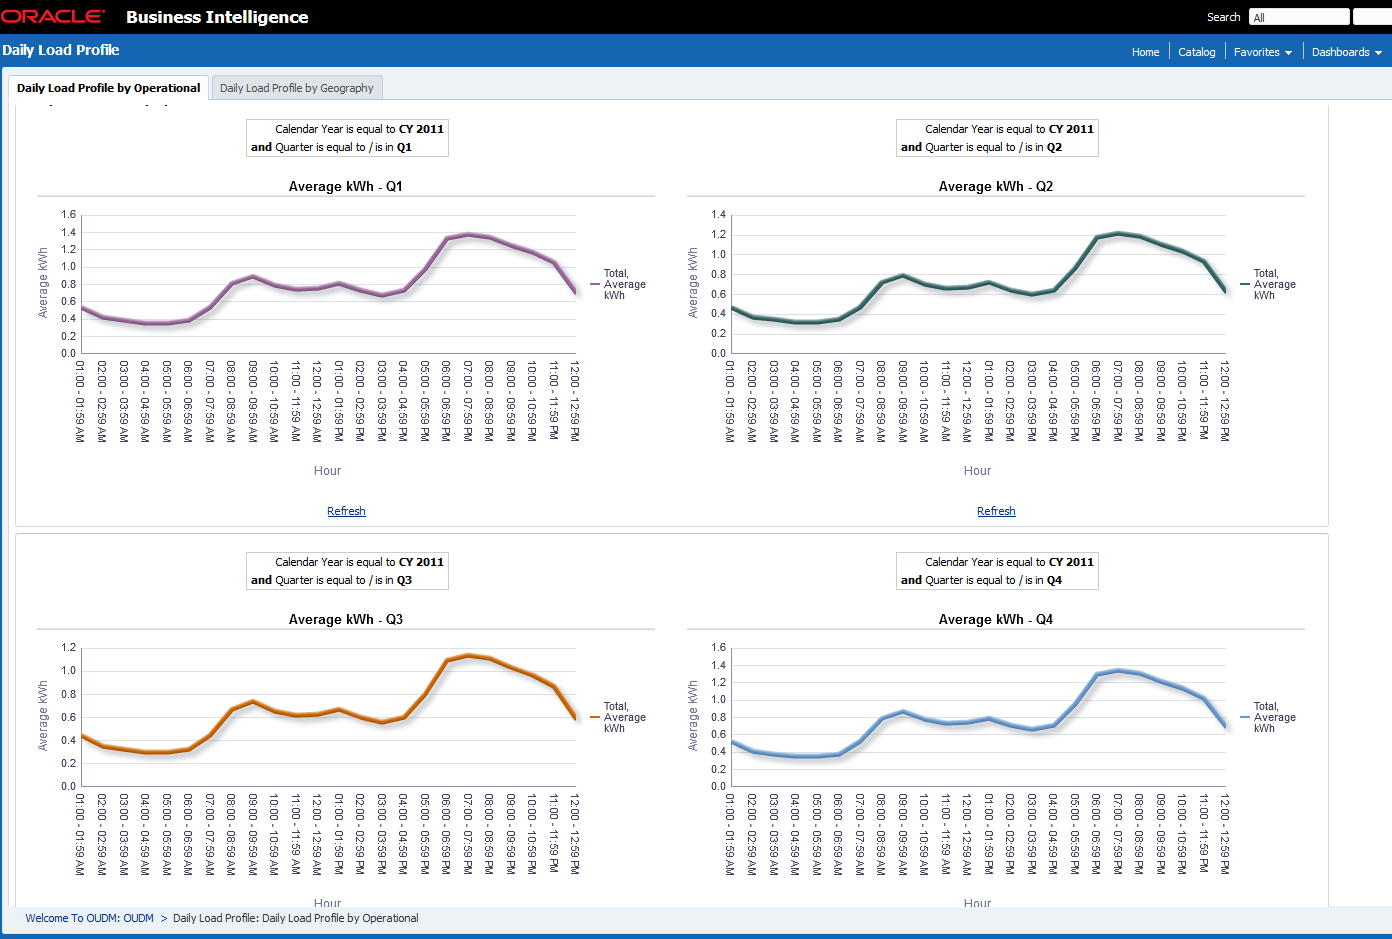
Description of "Figure 12-42 Daily Load Profile (Q1, Q2, Q3, and Q4)"
Daily Load Profile by Geography
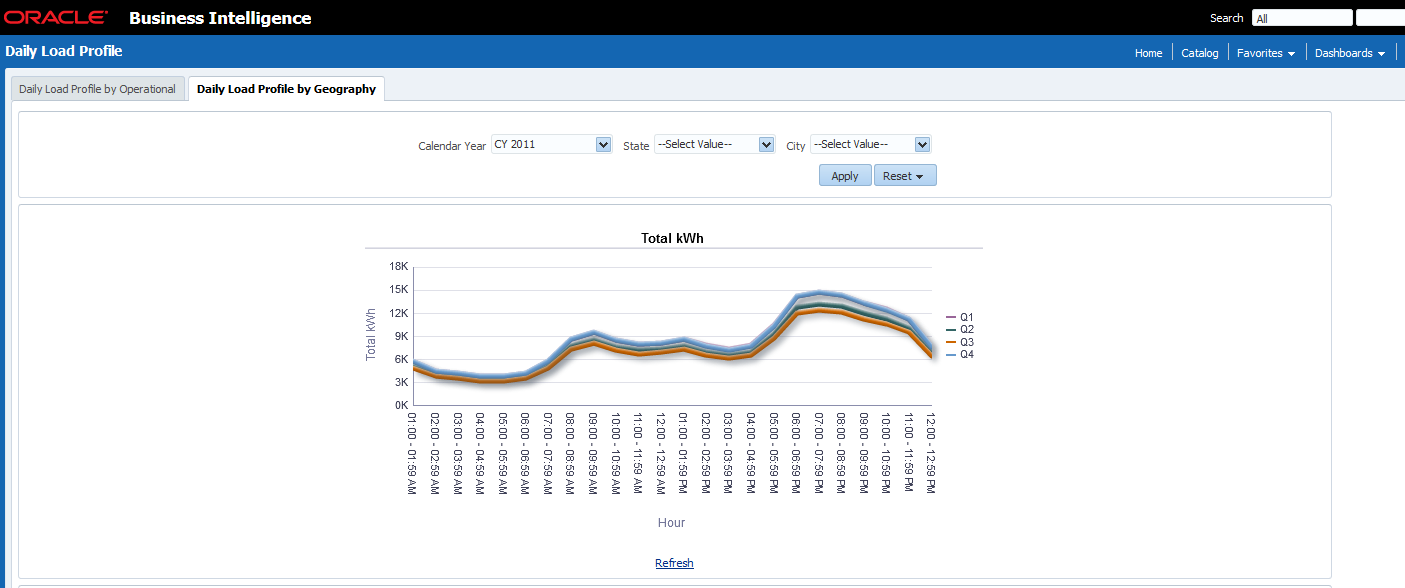
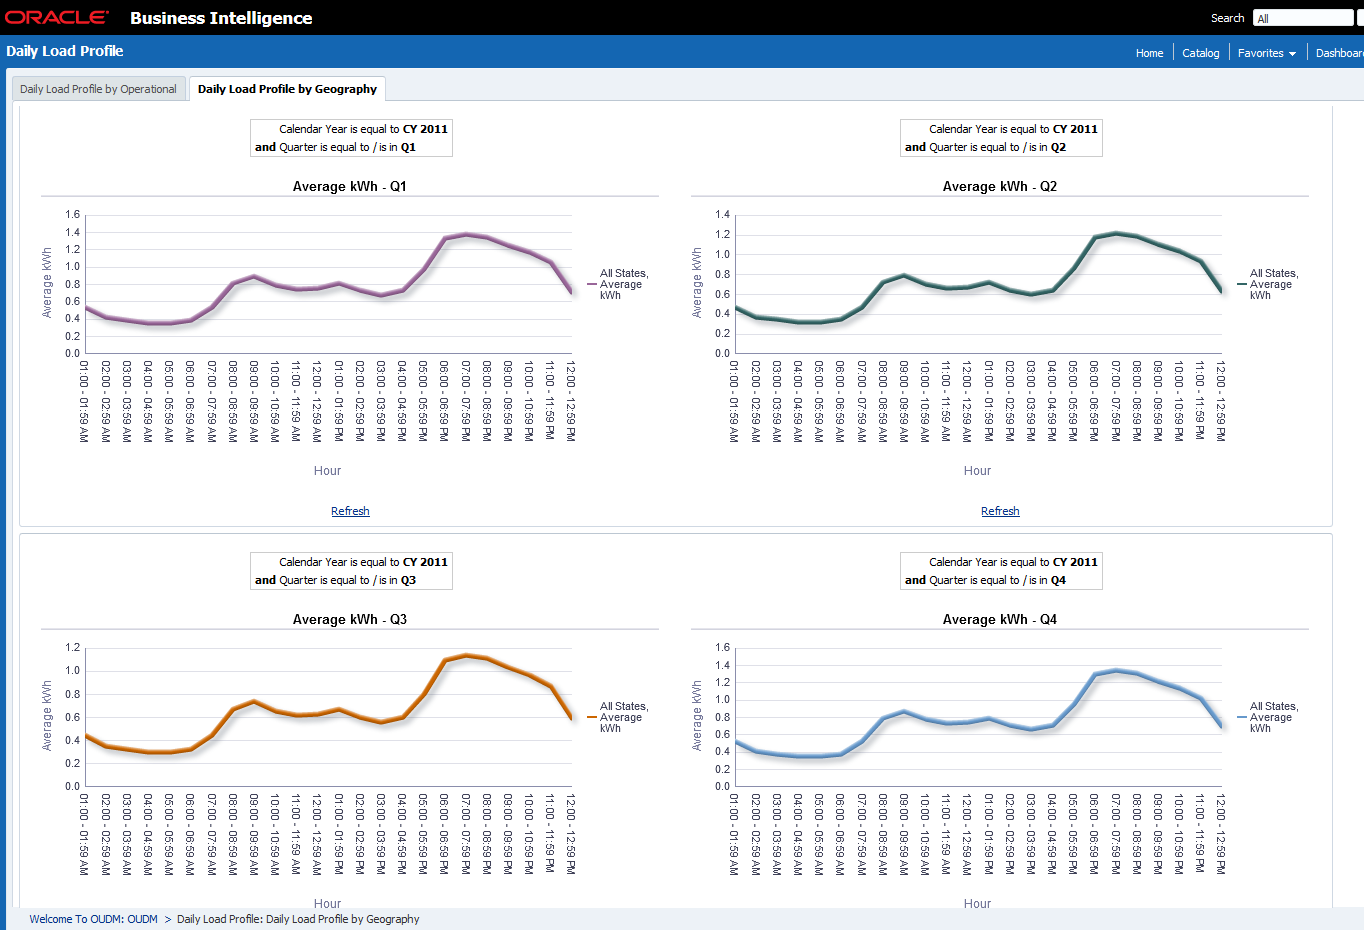
This report, as shown in Figure 12-43 provides the daily average loading status for a selected geography over a given time period.
Report dimensions are:
-
Calendar Month
-
Day
-
Hour
-
Geographical Zones
-
Usage Point
-
City
-
State
-
Figure 12-43 Daily Load Profile by Geography (Top)
Description of "Figure 12-43 Daily Load Profile by Geography (Top)"
Figure 12-44 Daily Load Profile by Geography (Q1, Q2, Q3, and Q4)
Description of "Figure 12-44 Daily Load Profile by Geography (Q1, Q2, Q3, and Q4)"
OLAP Sample Reports
The OLAP sample reports include the following areas:
Monthly Total Usage Operational
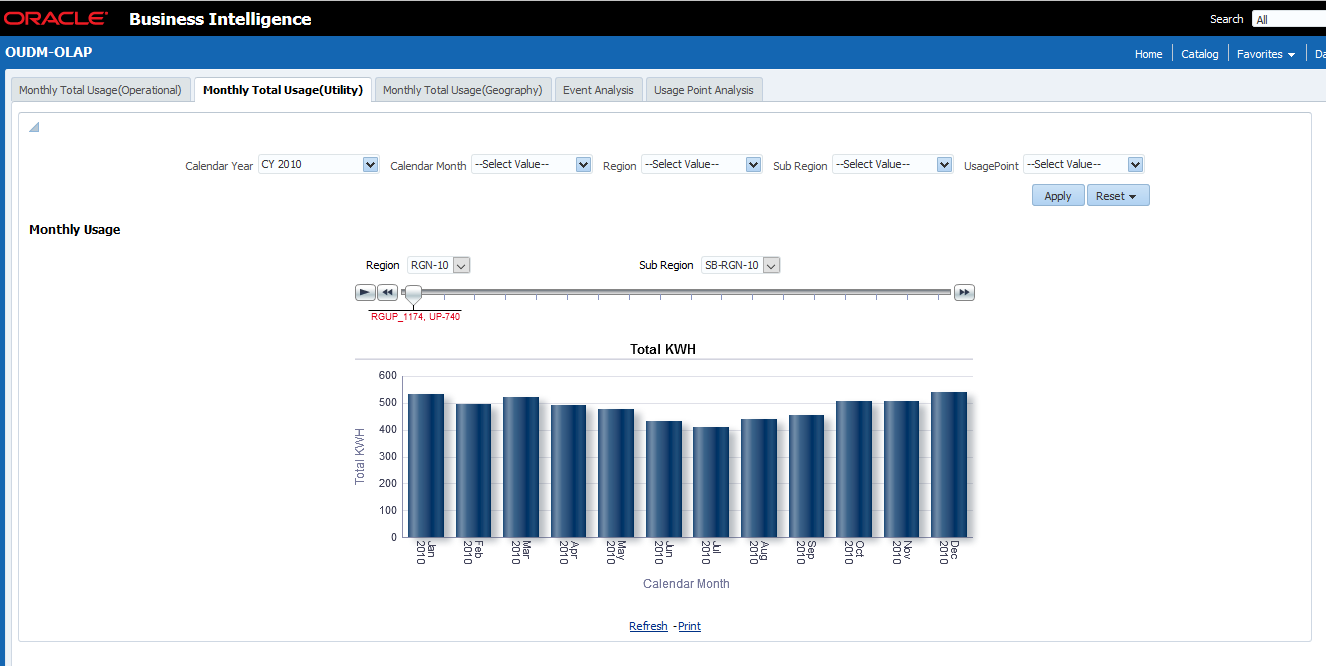
This report provides the monthly total usage over a given time period.
Report dimensions are:
-
Calendar Month
-
Day
-
Hour
-
Operational
-
Usage Point
-
Transformer
-
Feeder
-
Substation
-
Figure 12-45 Monthly Total Usage (Operational)
Description of "Figure 12-45 Monthly Total Usage (Operational)"
Monthly Total Usage (Utility)
This report provides the monthly total usage by region and subregion over a given time period.
Report dimensions are:
-
Calendar Month
-
Day
-
Hour
-
Operational
-
Usage Point
-
Transformer
-
Feeder
-
Substation
-
Figure 12-46 Monthly Total Usage (Utility)

Description of "Figure 12-46 Monthly Total Usage (Utility)"
Monthly Total Usage Geography
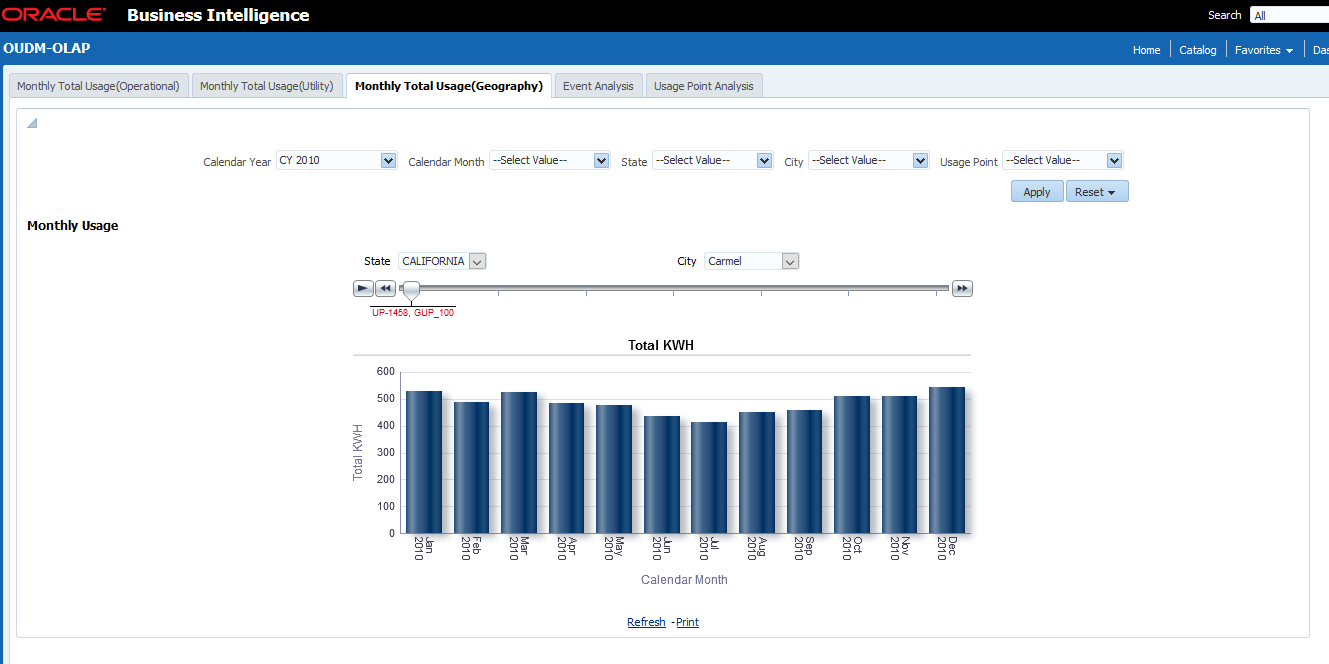
This report provides the monthly total usage by geographic area.
Report dimensions are:
-
Calendar Month
-
Day
-
Hour
-
Operational
-
Usage Point
-
Transformer
-
Feeder
-
Substation
-
Figure 12-47 Monthly Total Usage Geography
Description of "Figure 12-47 Monthly Total Usage Geography"
Event Analysis
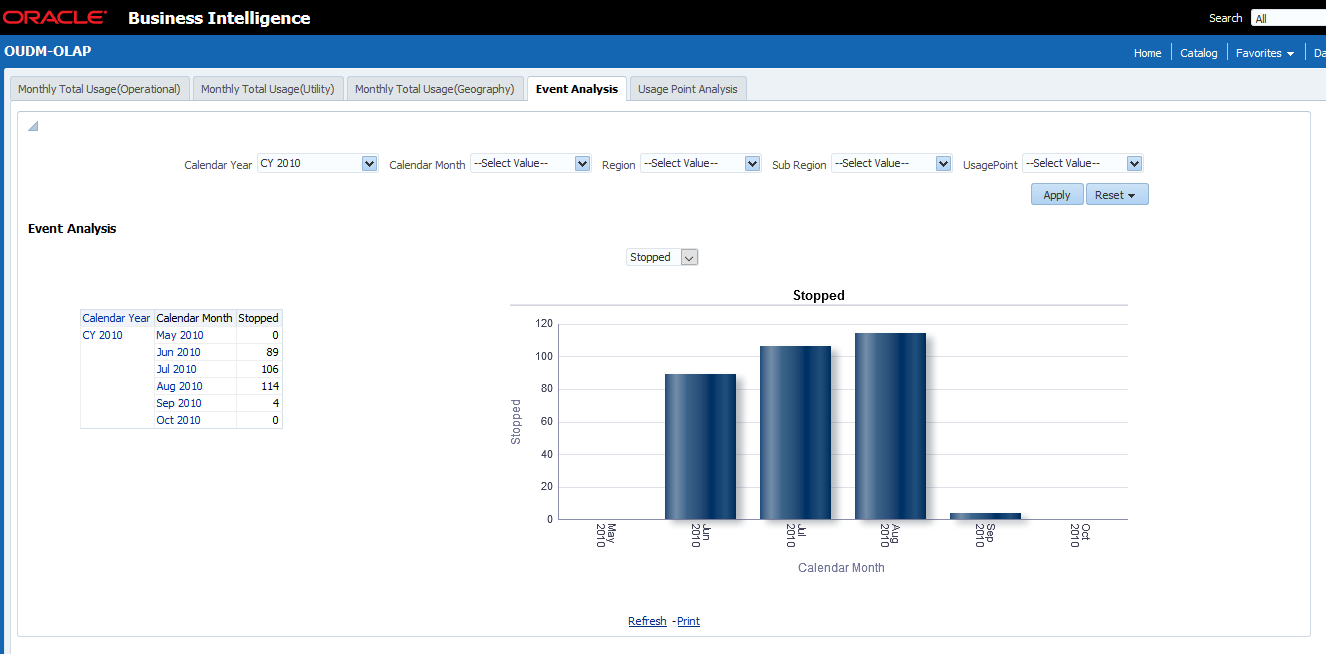
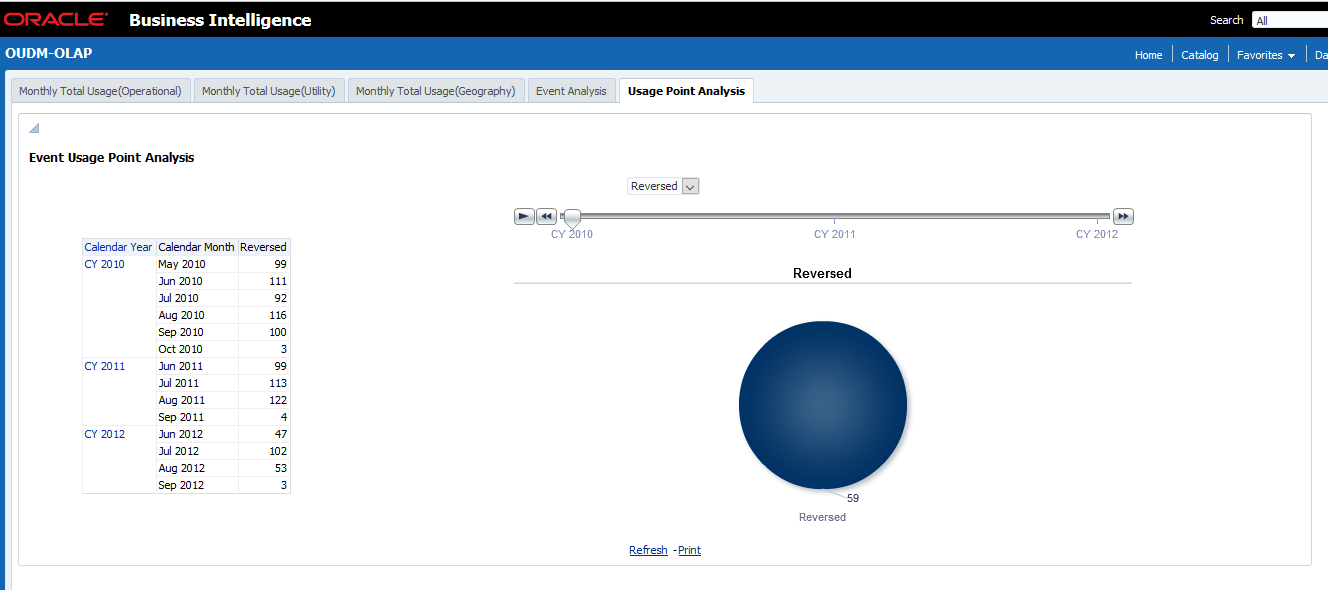
This report provides the event analysis by selected event type over a given time period.
Report dimensions are:
-
Calendar Month
-
Day
-
Hour
-
Operational
-
Usage Point
-
Transformer
-
Feeder
-
Substation
-
