| Agile Product Lifecycle Management Product Quality Management User Guide Release 9.3.6 E71165-01 |
|

 Previous |
 Next |
| Agile Product Lifecycle Management Product Quality Management User Guide Release 9.3.6 E71165-01 |
|
Previous |
Next |
The Agile Product Quality Management (PQM) is a powerful solution currently in use across leading business organizations around the globe. It involves an innovative methodology used to track and manage data, which translates to (better products) enhanced quality, productivity (lesser time cycles) and reliability (Zero failures). The flexibility of the solution adds to its inclusion in a many business ventures. This includes customer complaints, product and manufacturing defects, field failures, enhancement, and corrective and preventive measures. Agile PQM closes the support loop by unifying the company's customer service; field sales, manufacturing, and engineering organizations, and linking the company to its customers and partners.
As alternate quality management packages enter the market, customers demand quality products at a lower cost, and a reduced product lifecycle. Quality incidents reported by the customers help you detect defects and resolve them responsively. Tracking defects and finding the root cause of the defects quickly are keys to effective defect reduction and improving product quality. The Agile PQM solution includes Product Service Requests (PSRs) and Quality Change requests (QCRs). PSRs manage Problem reports and non-Conformance Reports. QCRs create and manage Audits, and Corrective and Preventive Actions (CAPAs).
Before you begin using FileLoad, make sure you have set up your environment correctly and have proper privileges described in this section.
This manual guides you to use Agile Product Quality Management solution provided you have installed Agile PLM at your company. To install Agile PLM, use the appropriate installation documentation. To help you install Agile PLM and understand Agile objects, classes, their application and their working, refer the manuals listed below:
Agile Database Installation Guide
Agile PLM Guide for WebLogic
Getting Started with Agile Product Lifecycle Management
Agile PLM Administrator Guide
For details about common terms appearing across all Agile PLM solutions, see Getting Started with Agile Product Lifecycle Management.
To achieve best results while using Agile PQM, keep in mind the following:
Problem Reports
Use Problem Reports class to capture Customer complaints.
Do not use PRs to capture non-conformance issues.
A Customer complaint may result in a CAPA in companies that have closed loop process. Use the Relationship functionality in PLM to tie the specific Customer complaint with CAPA
Non-Conformance Report
Use NCR class to capture all incoming supplier issues & defects which show up because of internal inspections and tests.
Use a sub-class of NCR to capture the non-conformances found during an Audit.
An NCR may result in a CAPA in companies that have closed loop process. Use the Relationship functionality in PLM to tie the specific NCR with CAPA.
CAPA
Use a CAPA class to capture corrective & preventive actions.
Audit
Use Audit class to capture details of a scheduled audit.
Use NCR to report results of a specific audit
Affected Items
The Affected Items tab comprises details of Items that have an attached PR, NCR, CAPA or Audit. It presents the Item view of Quality and informs us of which product was impacted and the failure modes involved. The Product line acquires information from the Item and not from the attached PR, NCR, CAPA or Audit.
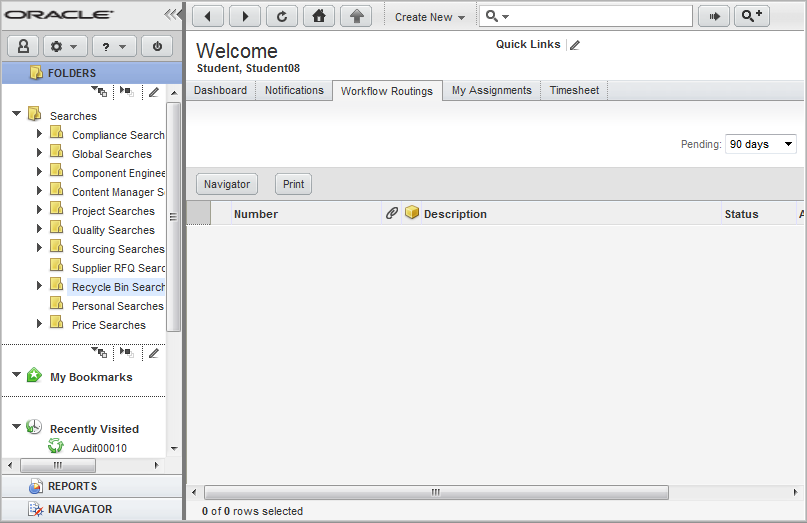
When you log in, your user Home page appears (Welcome <Your Name>”).
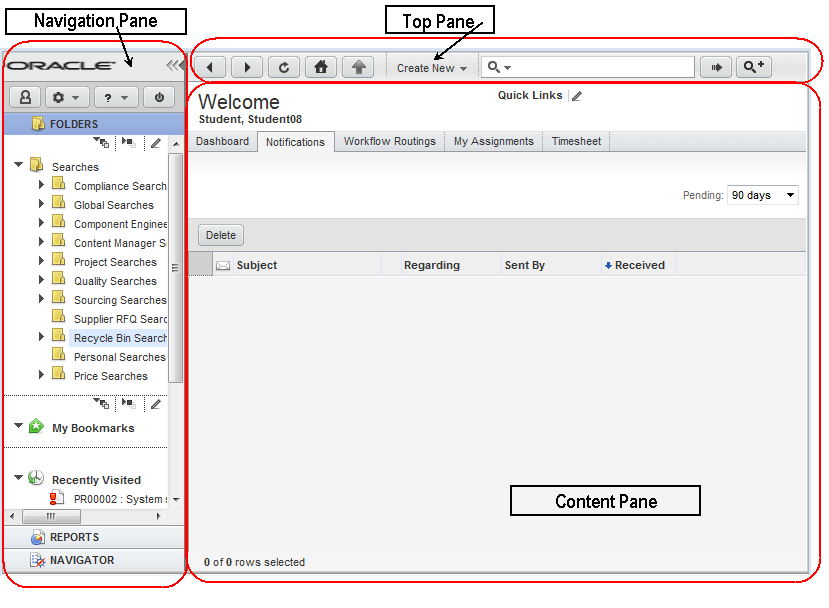
Your Preferred Start Page setting determines which tab is displayed in the content pane. The following illustration shows a typical Home page.
The Web Client window is organized into three main areas, or panes:
Top Pane
Navigation controls (Back, Forward, Refresh, Home, Display the progress of file uploads)
Create Menu
Search Controls
Navigation Pane
Branding Area and Navigation pane, Expand and Collapse controls
Courtesy Controls
Navigation Drawers
Folders drawer: Saved Searches, My Bookmarks, and Recently Visited
Reports drawer: Reports and Analytics
Navigator drawer: object links from Workflow Routings, search results table, BOM tree, or Project tree
Content Pane
Business objects tabular data is displayed in the content pane.
The Home page at login and when you click the Home button.
The left pane, called the navigation pane, provides basic access to settings, searches, reports, and the Agile PLM Navigator feature:
Logo area, which includes the navigation pane Collapse and Expand controls.
Navigation Pane toolbar.
Navigation pane drawers, which provide access to:
FOLDERS -- Search folder, My Bookmarks folder, Recently Visited list.
REPORTS -- Analytics, Standard Reports, Global Reports, Personal Reports.
NAVIGATOR -- Workflow Routings, Search results, item BOM tree, or PPM Project tree.
The FOLDERS drawer displays saved searches, bookmarks, and a list of recently visited objects.
The Searches section of the navigation pane FOLDERS drawer contains saved searches you can use whenever needed. It includes predefined system searches and searches you have created, stored in folders. Click a search to view the search results.
For more information about saved searches, see the chapter, 'Saved Searches' in Getting Started with Agile Product Lifecycle Management.
Beneath the search folders are two shortcuts areas:
My Bookmarks-Objects you have bookmarked for quick display later. To bookmark an object, choose Actions > Bookmark on an object's page. For more information about bookmarking, see the chapter 'Using and Organizing Bookmarks' in Getting Started with Agile PLM.
Recently Visited-The last 10 objects you have viewed (or 25, 50, or 100, depending on how the Agile administrator has defined the Agile PLM system preferences); click a link to display it in the content pane.
The left navigation pane REPORTS drawer gives you access to the Reports and Analytics folders. You can access the types of reports for which you have privileges-and Analytics folders if that is part of your Agile installation. You can view, edit, and delete existing reports.
When you click a Navigator button in the content pane, Agile PLM populates the Navigator drawer with a list of object links. As you click each link in the Navigator drawer, the object is displayed in the content pane. The list in the navigator drawer is not refreshed or updated as you click through the list.
Populate the navigator list by clicking the Navigator button in the following locations:
Workflow Routings tab on the Home page, to navigate your workflow tasks
When the Workflow Routings tab is displayed on the Home page, click the Navigator button on the Workflow Routings tab. The workflow routings list is displayed in the left navigation pane Navigator drawer.
Search results table, to navigate the list of search results.
When a search results table is displayed on the content page, click the Navigator button on the search results table. The list of search results is displayed in the left navigation pane Navigator drawer.
The Navigator button is added to the tool bar of the PSR and QCR objects. When you click a link in the Navigator drawer, the object is displayed in the content pane. The navigator list remains visible in the Navigator drawer, allowing you to click and view any object in the navigator list.
For more details, see Getting Started with Product Lifecycle Management.
For more navigation tips and shortcuts, see the recorded demos under Tools & Settings > Quick Tours.
Product Service Requests report quality incidents, and aggregate many PSRs to a single PSR. The PSR class includes Problem Reports (PRs) and Non-Conformance Reports (NCRs).
For details, see Chapter 2, "Working with Product Service Requests"
A Problem Report contains a basic description of a generic quality incident, problem, or incident reported from a customer's perspective. A customer, field service representative, or supplier may submit a Problem Report provided they hold the appropriate privilege to process a Problem Report. You must route a Problem Report for inquiry through a workflow. The inquiry team determines the root cause of the problem. The user with Quality Analyst role oversees the processing of the problem reports.
You use Agile Import or Agile SDK to import problem reports from different CRM systems.
A customer, field service representative, or supplier may submit a Non-Conformance Report (NCR) to report a basic material deviation from specifications or requirements in one or more products. You also must route Non-Conformance Reports through a workflow for an inquiry.
Incoming inspection lots or testing processes use an NCR and the Quality Analyst checks samples for deviations from specifications.
Quality Change Requests creates and manages Audits and Corrective and Preventive Actions (CAPAs). An audit is the pro-active process of verifying compliance with quality requirements. The CAPA is a formal process of addressing any generic quality problems and analyzing the root cause so you can implement corrective and preventive actions.
QCRs allow you to aggregate problems into a routable quality record, perform root-cause failure analysis, and drive the problems to closure using standard CAPA (corrective and preventive actions) procedures. The CAPA may result in changes to a product, process, or supplier.
You can use QCRs to:
Create and manage quality records that aggregate problems related to products, documents, suppliers, and customers.
Provide a means for driving quality-related changes by creating changes such as ECOs, MCOs, ECRs, stop ships, and deviations.
Route change requests for review and approval, thereby enabling communication and collaboration between the originator (Quality Control), root-cause failure analysis (Quality Control and Engineering), resolution (Engineering), corrective/preventative action (Quality Management), communication (customers and suppliers) and verification (compliance/audit).
Provide an audit trail between problems, corrective and preventive actions, and engineering changes that enable internal and external compliance processes.
For example, while conducting a quality check on the incoming lot of items from your supplier, you identify a defective item. To take corrective action, you create a QCR for the defective item and route it for review and approval. You can route the item through a change to ensure rectification of the defect and check for the latest revision of the item.
For details, see Chapter 3, "Working with Quality Change Requests"
An Audit is a pro-active process of verifying compliance with quality requirements. Default Audit workflows are different from CAPA workflows.
Corrective and preventive actions (CAPAs) address generic quality problems for one or more PSRs. A CAPA could result in the creation of one or more changes that lead to fixing the problems. A CAPA is a routable object and a workflow controls it. CAPA workflows vary for different workflow statuses.
For details, see "Workflow Tab of a QCR."
Tracking quality helps organizations identify, measure and improve business processes, which in turn leads to improved business performance and thus assures customer satisfaction. Monitoring non-conformance reports and implementing CAPAs help organizations meet standards. We look at some quality features that enable us to meet these standards.
Product Quality Management provides these roles:
Quality Analyst - The role of a Quality Analyst enables you to submit Problem Reports (PRs) and Non-Conformance Reports (NCRs) and manage their resolution.
Quality Administrator - The role of a Quality Administrator enables you to manage Audits and CAPAs.
For details about Agile PLM roles, see the Agile PLM Administrator Guide.
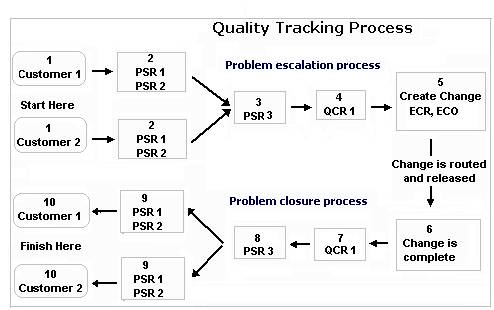
The following diagram illustrates an example of a quality incident process. Following the diagram is a description of each numbered step.
Two customers report quality incidents. Customer 1 and Customer 2. The support division creates problem service requests (PSRs) for the reported incidents.
PSR-1, PSR-2, for Customer PSR-1, PSR-2, for Customer 2. Submits PSRs to the Quality Analyst, who reviews all the PSRs.
Since all PSRs pertain to similar incidents even though they are from different customers, the Quality Analyst aggregates them to a single PSR and creates PSR-3.
Routes PSR-3 through a workflow for further processing.
The Quality Administrator creates a quality change request, QCR-1. The QCR includes a list of the items that it affects.
The engineering team determines if the request is valid and merits a change (an ECO, MCO, and ECR, stop ship or deviation depending on the problem).
Creates a change to address the problem. The Change Analyst routes the change through the workflow.
Changes implemented fix the problem. The Change Analyst sends a notification to the Quality Administrator, who checks if the change did address the problem documented in the QCR.
The quality administrator takes action to close the QCR.
SmartRules are system wide settings that let you choose how to manage specific behaviors in Agile PLM. Agile Administrator can modify these settings. The following SmartRules relate to Product Quality Management processes:
Many Items per PSR
Many QCRs per PSR
PSR contains Items and Related PSRs
Release QCR with resolved Items.
We take the example of PSR contains Items and Related PSRs SmartRule.
The PSR contains Items and Related PSRs SmartRule controls the behavior of the Affected Items tab and the Related PSR tab of PSRs. If you set the SmartRule to Allow, PSRs can have both affected items and related PSRs. Otherwise, both Affected Items and related PSRs are mutually exclusive. In other words, if the Affected Items tab lists items, then the Related PSR tab is unavailable; and if Related PSR tab lists PSRs, then the Affected Items tab is unavailable. This enables you to choose whether to use a PSR as an aggregation of other PSRs or as a problem report against assembly items.
For complete details on these and other SmartRules, see the Agile PLM Administrator Guide.
You can perform a search by selecting the required search from either the Quick Search or Advanced Search from the Quality Searches folder to find specific PSRs and QCRs. For example, if you are a Quality Administrator and must assign all unassigned PSRs to Quality Analysts, you can do a quick search of all unassigned PSRs. Listed below are some sample quality searches:
Unassigned PSRs
Open PSRs
PSRs submitted more than X hours ago
QCRs submitted more than X hours ago
Released QCRs
Closed QCRs
Unassigned Submitted QCRs
Open QCRs
|
Note: The Quality Searches folder appears only if the Administrator has specified the searches in your profile. |
You can link Quality information on certain tabs and fields with information about objects such as items, customers, and suppliers. The organization can then assess the quality of incorporating certain parts into their designs. The fields of the PSR and QCR table are the same as that of Parts and are also available to Searches and Reports. A round black icon in the Quality tab indicates it contains a QCR or PSR. The Quality tab on Items, Customer and Supplier is visible only in Web Client.
The Quality tab for Items displays all PSRs and QCRs reported against that Item.
The Quality tab of a Customer object lists both PSRs and QCRs. The quality incidents reported by the customer helps you gauge customer satisfaction.
The Quality tab of a Supplier object lists both PSRs and QCRs. The quality incidents filed against the supplier help you gauge performance and you can establish a rating or preference for that supplier.
Listed below are several ways you can view Quality issues against Customers or Suppliers.
Execute a Quick Search - Fastest way to find PSRs, QCRs, Customers, and Suppliers on the Home Page.
Custom Search - A combination of different queries returns PSRs with matching criteria. For example, Product Service Requests: Customer is not Null OR Supplier is not Null.
Advanced Search - Most effective way of finding objects, setting multiple criteria and filtering down on objects. For example: Items with PSRs of Customer/Suppliers, which have QCRs initiated. Items only have PSRS for Customers/Suppliers but QCR is not initiated. Items having PSRs & QCRs and Changes associated with them.
View Parts - The Quality tab of Parts displays the PSR & QCR numbers along with Customer and Supplier details
Search Personalization - Format a search and choose the required view by using the Personalize menu. For example, view all the QCRs/PSRs for Customers and Suppliers in displayed fields.
Agile PLM provides several standard reports that help you analyze data in Agile PQM.
In the navigation pane of the Agile Web Client, click Reports > Reports and Analytics > Standard Reports > Quality Reports. Quality Report lists the following reports:
Each of the above reports takes you through a report wizard provided you hold the necessary privileges. Step through the wizard. At the end of the process a Report appears. You can print the report, export its content, or save it. Executed report outputs are visible only in Web Client.
A Quality Report includes the following tabs:
General info - gives you the general details about the report. The Agile administrator sets the fields on the General info tab.
Layout tab: In the Layout tab, you can add or edit fields in a standard or customized report layout, if required. You need appropriate privileges to edit the layout.
Schedule: The Schedule tab enables you to run a report using a specific schedule, or on specific date and time.
Historical Report: The Historical Report tab displays all previously run reports. It displays saved reports with the date, time and the name of the user who runs the report.
History: The History tab shows a summary of actions taken on the report.
For more details on the tabs of Quality Reports, see Getting Started with Agile Product Lifecycle Management.
The Failure Trend Report lists trends in failure mode over time. Based on the results, you can focus corrective efforts on those items that have the greatest effect on product quality.
To produce a report of the quantities affected during the specified period, Product Service Requests must have a value specified in the Affected Items' Quantity Affected field. Ensure to obtain the necessary privileges to execute a report.
To run a Failure Report Trend:
In the navigation pane, navigate to Reports > Reports and Analytics > Standard Reports > Quality Reports > Failure Trend Report.
Click the Execute button. A Run Failure Trend Report wizard opens.
In the Select Layout and Configuration page, select a Layout from the list. You can click the Edit button to modify an existing layout or click the Create button to create a layout.
In the Format Frame, select properties from the Hidden Fields column and move them to the Displayed Fields column using the right arrow. You can also place them in the required ascending or descending order using arrows. Click the Edit button to modify an existing layout.
In the Properties frame, enter the required fields.
Click Save to save the changes or Close to close the palette.
Select a format for the generated report from the Output Format list. Choose from a list of formats - PDF, WORD, EXCEL, HTML, and STANDARD.
Select the Save a copy of the report in the historical reports check box to save the generated report.
Click Next.
The Select or Create a Query page appears. The Failure Trend Report lets you search for Product Service Requests to use in the report and fields you must select to define a query.
Click Next to proceed to the next step or Back to edit the Query.
The Define Report page appears.
In the Time Period frame, fill in the necessary fields.
In the Additional Report Criteria frame, select the required fields.
Click Finish to display the report.
Click the buttons that appear at the top of the generated report to save, print, or export the report. The report is lost if you click the Close button, without saving it.
Save: Saves the report to the Historical Report tab.
Print: Prints the generated report.
Export: Exports the content of the report to a delimited text file (CSV) or a Microsoft Excel workbook.
The Quality Activity report lists quality incidents (product service requests and quality change requests) processed during a specified period.
To run a Quality Activity Report:
In the navigation pane, navigate to Reports > Reports and Analytics > Standard Reports > Quality Reports > Quality Activity Report.
Click the Execute button. A Quality Activity Report wizard opens.
In the Select Layout and Configuration page, select a Layout from the list. You can click the Edit button to modify an existing layout or click the Create button to create a layout.
In the Format Frame, select properties from the Hidden Fields column and move them to the Displayed Fields column using the right arrow. You can also place them in the required ascending or descending order using arrows.Click the Edit button to modify an existing layout.
In the Properties frame, enter the required fields.
Click Save to save the changes or Close to close the palette.
Select a format for the generated report from the Output Format list. Choose from a list of formats - PDF, WORD, EXCEL, HTML, and STANDARD.
Select the Save a copy of the report in the historical reports check box to save the generated report.
Click Next.
The Select Date Range Page appears. Select the required dates.
Click Next.
The Select Additional Parameters page appears. In the Workflow and Status Change Criteria frame,
Select a workflow from the Workflow Type list.
Click the Search palette to effect a change in the Status Changes to field. A Change palette appears. Select and double-click the item to move it to the Status Changes to field.
Click Finish to display the report.
Click the buttons that appear at the top of the generated report to save, print, or export the report. The report is lost if you click the Close button without saving it
Save: Saves the report to the Historical Report tab.
Print: Prints the generated report.
Export: Exports the content of the report to a delimited text file (CSV) or a Microsoft Excel workbook.
The Quality Backlog Report lists incidents that are at a specified status but have not moved to the next status during a specified period.
To run a Quality Backlog Report:
In the navigation pane, go to Reports > Reports and Analytics > Standard Reports > Quality Reports > Quality Backlog Report.
Click the Execute button. A Quality Backlog Report wizard opens.
In the Select Layout Configuration page, select a Layout from the list. You can click the Edit button to modify an existing layout or click the Create button to create a layout.
In the Format Frame, select properties from the Hidden Fields column and move them to the Displayed Fields column using the right arrow. You can also place them in the required ascending or descending order using arrows.Click the Edit button to modify an existing layout.
In the Properties frame, enter the required fields.
Click Save to save the changes or Close to close the palette.
Select a format for the generated report from the Output Format list. Choose from a list of formats - PDF, WORD, EXCEL, HTML, and STANDARD.
Select the Save a copy of the report in the historical reports check box to save the generated report.
Click Next.
The Select or Create a Query frame appears. The Quality Backlog Report lets you search for Product Service Requests to use in the report and fields you must select to define a query.
Click Next to proceed to the next step or Back to modify the Query.
The Define Report page appears.
In the Time period frame, select the dates.
In the Additional Report Criteria frame, fill in the required fields.
Click Finish to display the report.
Define Click the buttons that appear at the top of the generated report to save, print, or export the report.
Save: Saves the report to the Historical Report tab.
Print: Prints the generated report.
Export: Exports the content of the report to a delimited text file (CSV) or a Microsoft Excel workbook.
The Quality Cycle Time Report calculates the time it takes for the specified product service requests and quality change requests (PSRs and QCRs) to move to another status in a specified period.
The report lists the requests and shows the average time each PSR or QCR takes between two statuses. For example, the report indicates the average time it took for a PSR or QCR to go from Submitted to Released each month during the last year, grouped by a product line.
To run a Quality Cycle Time Report:
In the navigation pane, go to Reports > Reports and Analytics > Standard Reports > Quality Reports > Quality Cycle Time Report.
Click Execute. A Quality Cycle Time Report wizard appears.
In the Select Layout Configuration page, select a Layout from the list. You can click the Edit button to modify an existing layout or click the Create button to create a layout.
In the Format Frame, select properties from the Hidden Fields column and move them to the Displayed Fields column using the right arrow. You can also place them in the required ascending or descending order using arrows.Click the Edit button to modify an existing layout.
In the Properties frame, enter the required fields.
Click Save to save the changes or Close to close the palette.
Select a format for the generated report from the Output Format list. Choose from a list of formats - PDF, WORD, EXCEL, HTML, and STANDARD.
Select the Save a copy of the report in the historical reports check box to save the generated report. The Save a copy of the report in the historical reports check box does not appear if you select the Standard output format
Click Next.
The Select or Create a Query frame appears. The Quality Backlog Report lets you search for Product Service Requests to use in the report and fields you must select to define a query.
Click Next to proceed to the next step or Back to modify the Query.
Click Next.
In the Define Report page appears.
In the Time Period frame, select the required dates.
In the Status change frame, select the required status.
In the Report Additional Criteria, fill in the required fields.
Click Finish to display the report
Click the buttons that appear at the top of the generated report to save, print or export the report. The report is lost if you click the Close button without saving it.
Save: Saves the report to the Historical Report tab.
Print: Prints the generated report.
Export: Exports the content of the report to a delimited text file (CSV) or a Microsoft Excel workbook.
The Quality Metrics Report shows quality incidents (product service requests and quality change requests) that moved to a specified status during a specified period.
To run a Quality Metrics Report:
In the navigation pane, go to Reports > Reports and Analytics > Standard Reports > Quality Reports > Quality Backlog Report.
Click the Execute button. A Run Quality Metrics Report wizard opens.
In the Select Layout Configuration page, select a Layout from the list. You can click the Edit button to modify an existing layout or click the Create button to create a layout.
In the Format Frame, select properties from the Hidden Fields column and move them to the Displayed Fields column using the right arrow. You can also place them in the required ascending or descending order using arrows.Click the Edit button to modify an existing layout.
In the Properties frame, enter the required fields.
Click Save to save the changes or Close to close the palette.
Select a format for the generated report from the Output Format list. Choose from a list of formats - PDF, WORD, EXCEL, HTML, and STANDARD.
Select the Save a copy of the report in the historical reports check box to save the generated report. The Save a copy of the report in the historical reports check box does not appear if you select the Standard output format.
Click Next.
The Select or Create a Query page appears. The Quality Metrics Report lets you search for Product Service Requests to use in the report and fields you must select to define a query.
Click Define Query. A Report Search palette opens. Select required fields.
Click Next to proceed to the next step or Back to modify the Query.
The Define Reports page appears.
In the Time Period frame, fill in the dates.
In the Status Change frame, fill in the required details.
In the Additional Report Criteria frame, fill in the required fields.
Click Finish to display the report.
Click the buttons that appear at the top of the generated report to save, print, or export the report. The report is lost if you click the Close button without saving it.
Save: Saves the report to the Historical Report tab.
Print: Prints the generated report.
Export: Exports the content of the report to a delimited text file (CSV) or a Microsoft Excel workbook.