About Pivot Tables
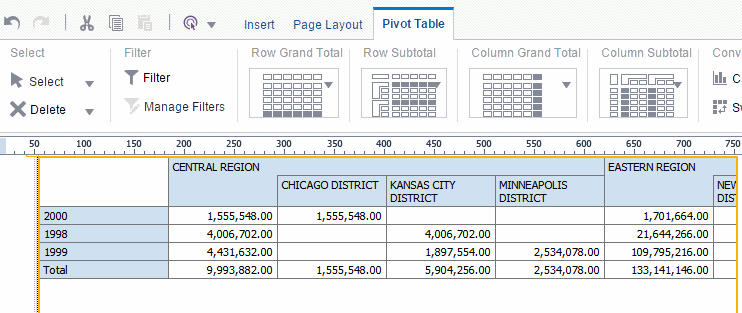
The pivot table provides views of multidimensional data in tabular form. It supports multiple measures and dimensions and subtotals at all levels.
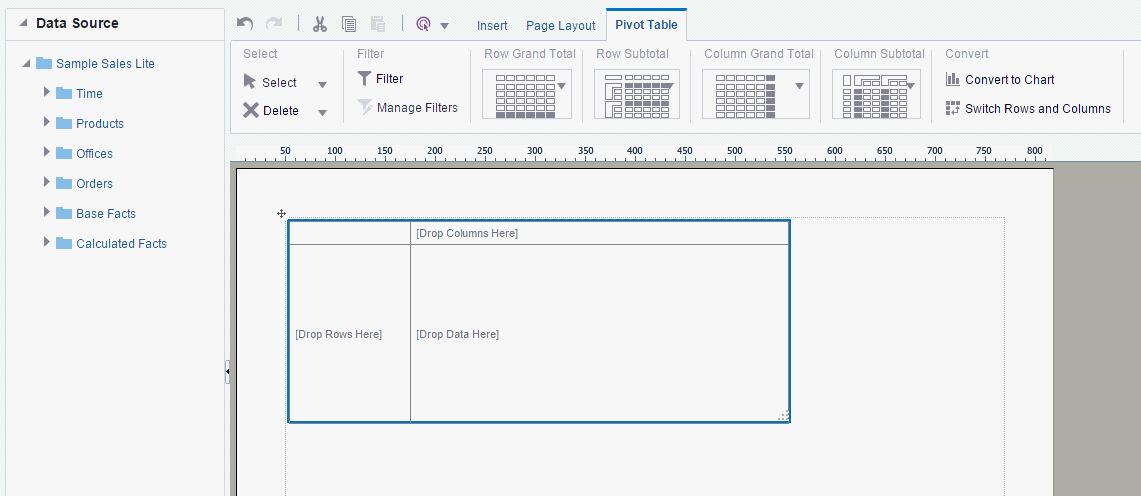
The following figure shows a pivot table:
Inserting a Pivot Table
Follow the steps in the procedure to insert a pivot table.
Customizing a Pivot Table Menu
After you insert a pivot table customize the appearance and layout using these dynamic tabs.
-
Pivot Table tab
-
Pivot Table Header tab
-
Pivot Table Data tab
About the Pivot Table Tab
You can customize the appearance of a pivot table using the Pivot Table tab.
The following figure shows the Pivot Table tab.
Applying Filters
This section describes filters and manage filters features.
See About Filters for a description of the Filter and Manage Filters features.
Customizing the Display of Totals
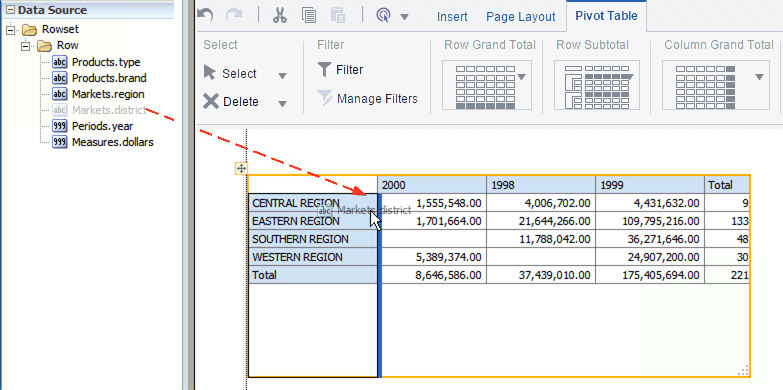
The Pivot Table tab enables you to quickly customize the display of grand total and subtotal rows.
By default, the layout editor inserts the pivot table with the total and subtotal displays as shown in the tab:
-
Row Grand Total - Inserted at the bottom of table
-
Row Subtotal - Inserted at the top of each subgroup, with no row header
-
Column Grand Total - Inserted at the far right
-
Column Subtotal - Inserted to the left of each column subgroup, with no header
Change the positioning and display of totals and subtotals by clicking the appropriate group in the tab and selecting the desired layout pattern from the menu.
Converting a Pivot Table to a Chart
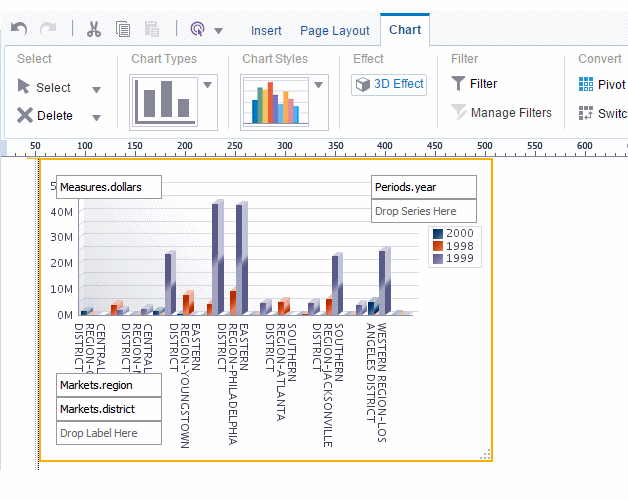
The Convert Pivot Table to a Chart command converts the pivot table to a default vertical bar chart.
After conversion, customize the table as described in About Charts.
The following figure shows the pivot table created in the preceding step converted to a vertical bar chart.
Customizing the Pivot Table Headers
Use the Pivot Table Header tab to customize the fonts, colors, etc.
The Pivot Table Header tab is shown in the following figure:
Select the column or row header of the pivot table and use the Pivot Table Header tab to perform the following:
-
Customize the fonts, colors, alignment and other display features of the header.
-
Apply a sort order (for more information see About the Sort Option).
-
Apply data formatting (if the data type is number or date).
Customizing the Pivot Table Data
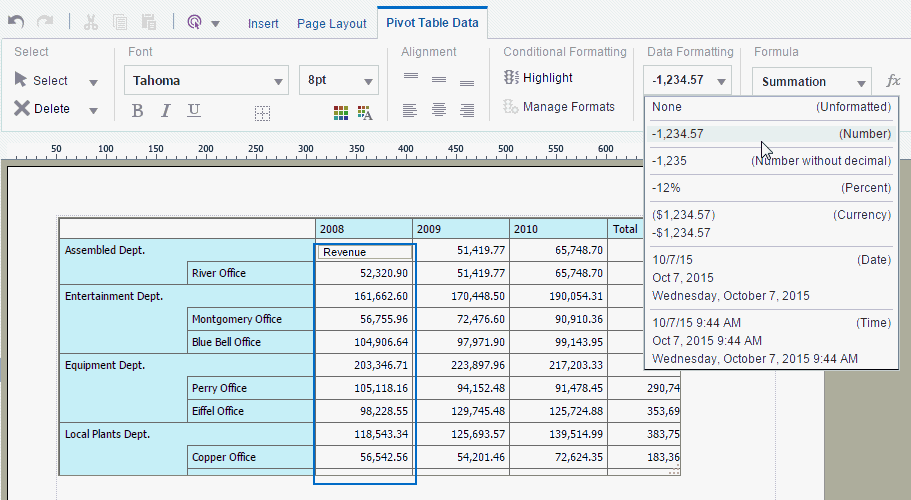
Select the data area of the pivot table and use the Pivot Table Data tab to perform these actions. The commands in the Pivot Table Data tab are the same as the corresponding commands in the table Column tab.
The Pivot Table Data tab is shown in the following figure:
See the references for more information on their use.
-
Customize the fonts, colors, alignment and other display features of the data.
-
Apply conditional formatting to the data for more information (see About Conditional Formats).
-
Apply data formatting (see About the Data Formatting Options for Columns).
-
Apply a formula (see Applying a Formula).

