About Gauge Charts
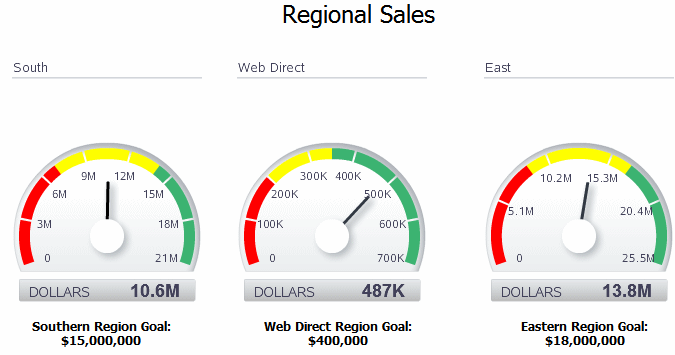
A gauge chart is a useful way to illustrate progress or goals. The illustration shows a report with gauges.
For example, the following figure shows a report with three gauges to indicate the status of regional sales goals:
Inserting a Gauge Chart
Follow these steps to insert a gauge chart.
To insert a gauge chart in the layout:
Applying and Managing Filters
Follow this section to know how to apply and manage filters.
See About Filters for information on how to apply and manage filters.
