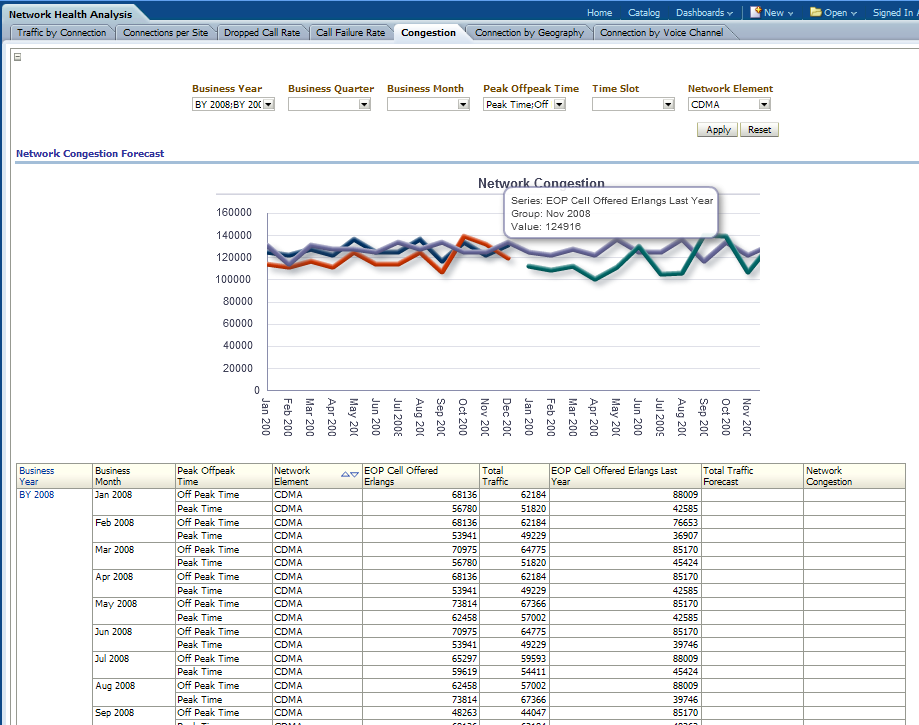
Network Management Reports
Network Analysis
This area includes the reports: Network Capacity, Minutes of Usage, Airtime per Subscription, and Load During Busy Hours.
Network Capacity
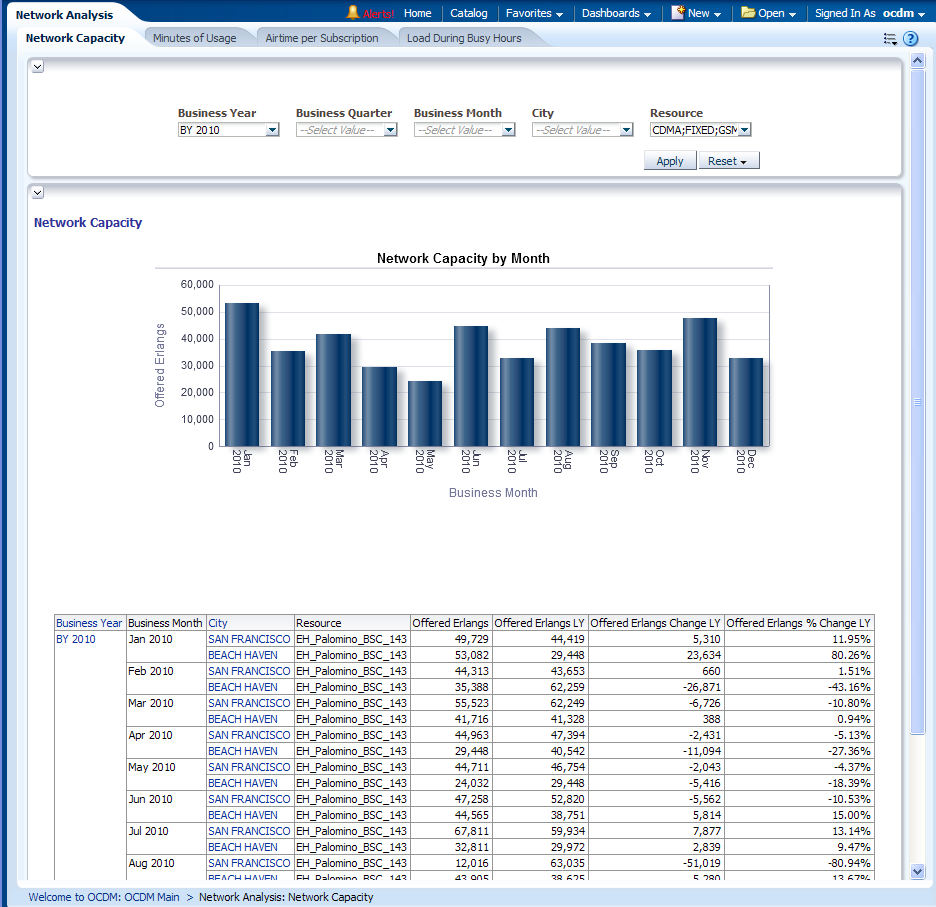
This report, as shown in Figure 13-58 provides month-level transaction activity information based on network capacity measures, for one or more locations.
Report dimensions are:
-
Business Time
-
Geography
-
Network Element
Minutes of Usage
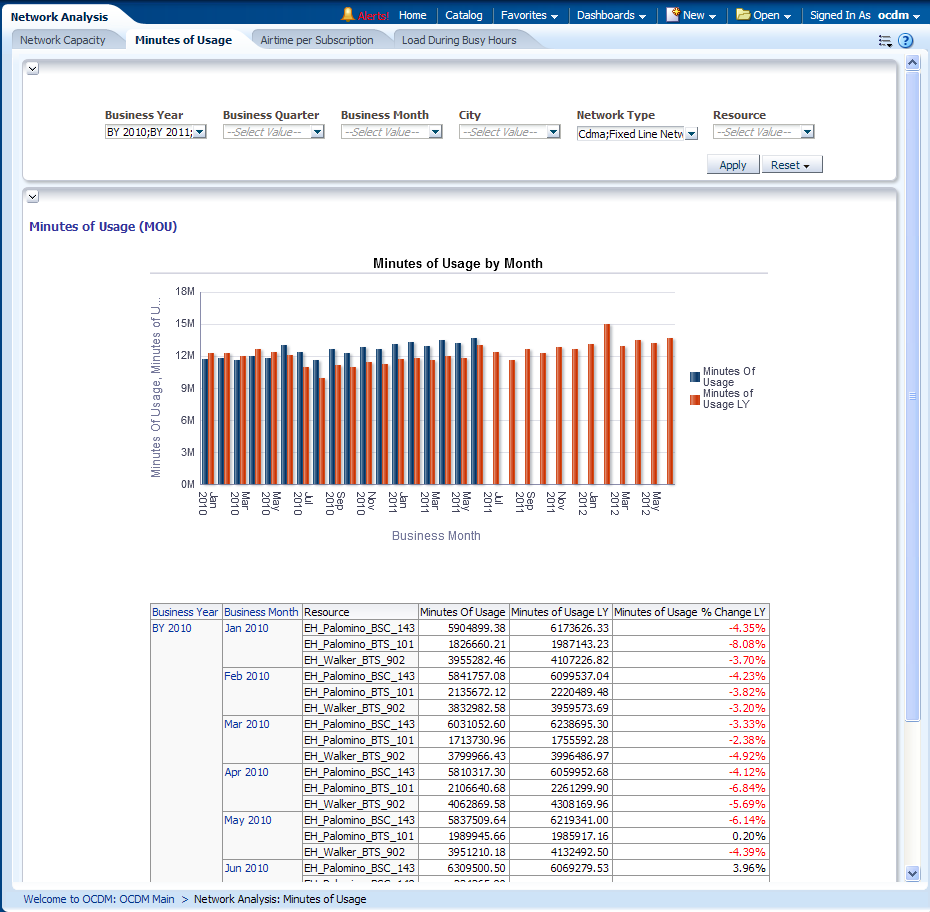
This as shown in Figure 13-59 provides month-level call usage summary information based on call duration in minutes, in certain areas and the network elements.
Report dimensions are:
-
Business Time
-
Network Element
Airtime per Subscription
This as shown in Figure 13-60 provides month-level transaction activity information based on airtime per subscription connection measures, for one or more location.
Report dimensions are:
-
Business Time
-
Network Element
-
Geography
-
Peak Off peak Time
Figure 13-60 Airtime per Subscription Report

Description of "Figure 13-60 Airtime per Subscription Report"
Load During Busy Hours
This report, as shown in Figure 13-61 provides month-level transaction activity information based on calls count during busy hours measures, for one or more location.
Report dimensions are:
-
Business Time
-
Network Element
-
Geography
-
Peak Off peak Time
Figure 13-61 Load During Busy Hours Report
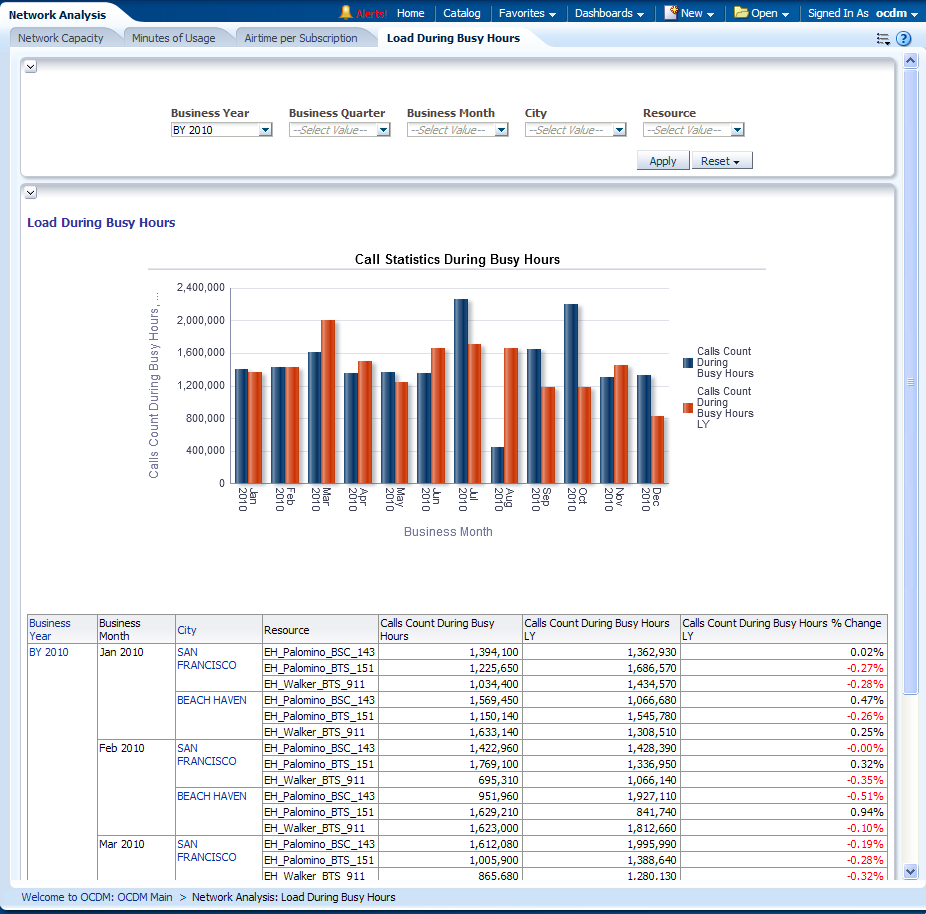
Description of "Figure 13-61 Load During Busy Hours Report"
Network Health Analysis
This area includes the reports: Traffic by Connection, Connections per Site, Dropped Call Rate, Call Failure Rate, Congestion, Connection by Geography, and Connection by Voice Channel.
Traffic by Connection
This report, as shown in Figure 13-62 provides month-level transaction activity information based on traffic by connection measures, for one or more location.
Report dimensions are:
-
Business Time
-
Network Element
-
Geography
-
Peak Off peak Time
Figure 13-62 Traffic by Connection Report
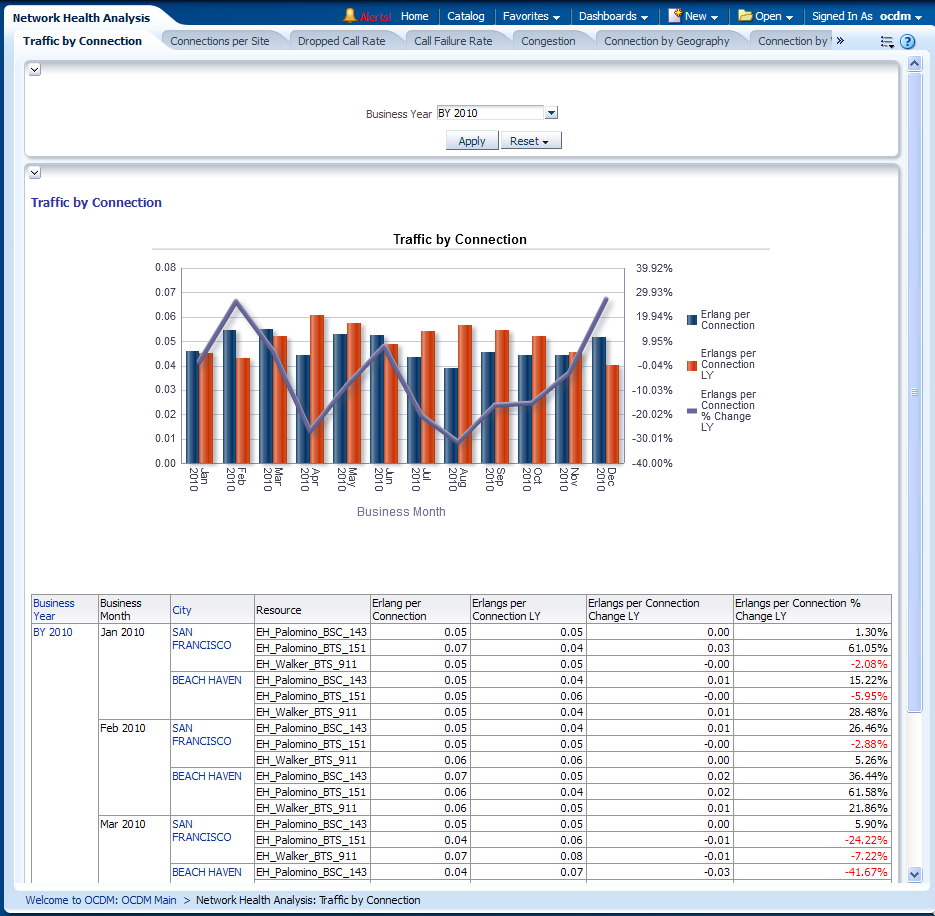
Description of "Figure 13-62 Traffic by Connection Report"
Connections per Site
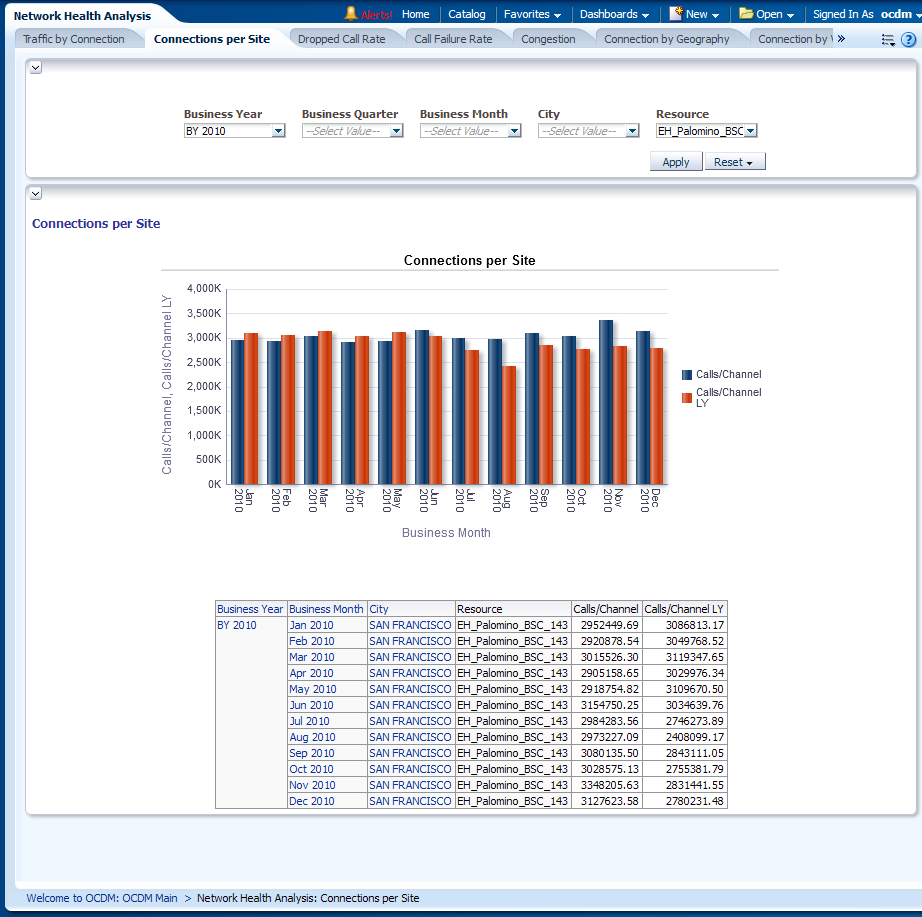
This report, as shown in Figure 13-63 provides month-level transaction activity information based on subscriptions per channel measures, for one or more location.
Report dimensions are:
-
Business Time
-
Resource
-
Geography
Dropped Call Rate
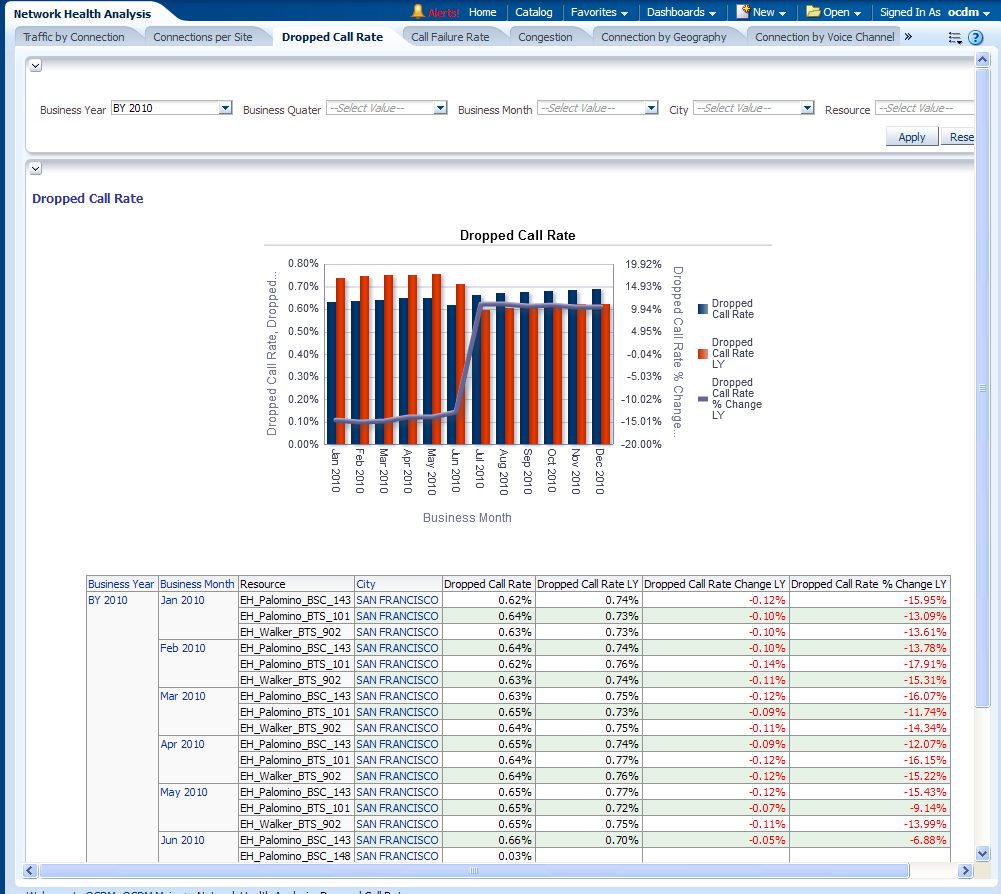
This report, as shown in Figure 13-64 provides month-level transaction activity information based on dropped call rate measures, for one or more location.
Report dimensions are:
-
Business Time
-
Network Element
-
Geography
Call Failure Rate
This report, as shown in Figure 13-65 provides month-level transaction activity information based on network congestion measures, for one or more location.
Report dimensions are:
-
Business Time
-
Network Element
-
Geography
Congestion
This report, as shown in Figure 13-66 provides month-level transaction activity information based on end of period cell offered erlangs measures, for one or more location.
Report dimensions are:
-
Business Time
-
Network Element
-
Geography
-
Time Slot
-
Peak Offpeak Time
Connection by Geography
This report, as shown in Figure 13-67 provides month-level transaction activity information based on connections measures, for one or more location.
Report dimensions are:
-
Business Time
-
Network Element
-
Geography
-
Peak Offpeak Time
Figure 13-67 Connection by Geography Report
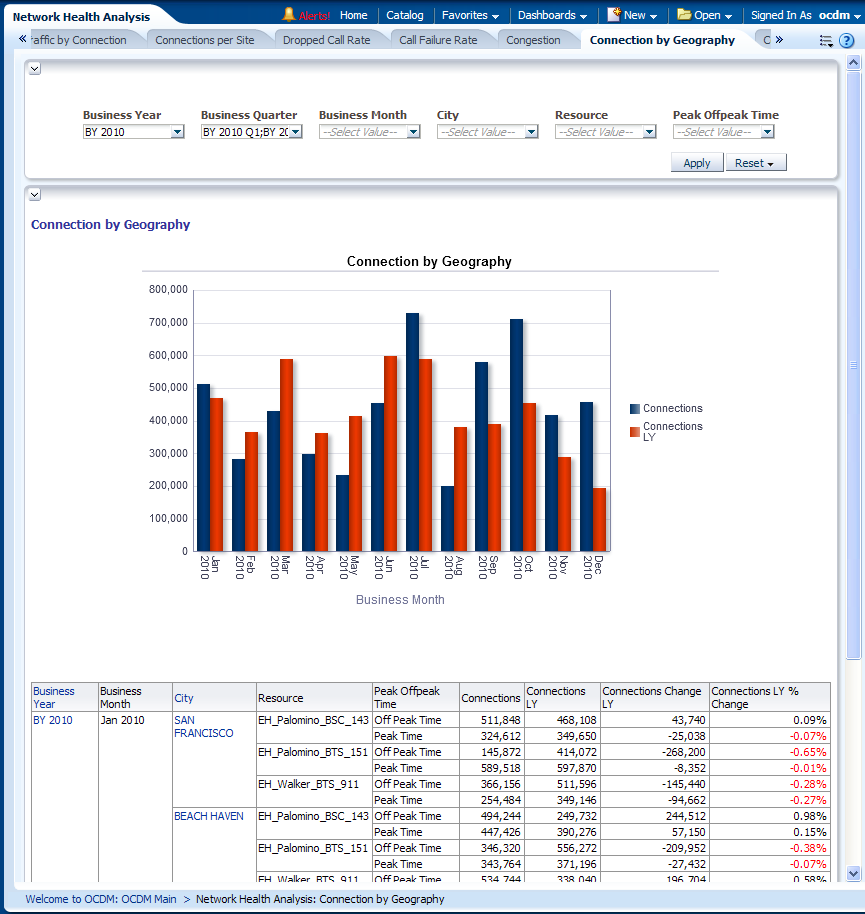
Description of "Figure 13-67 Connection by Geography Report"
Connection by Voice Channel
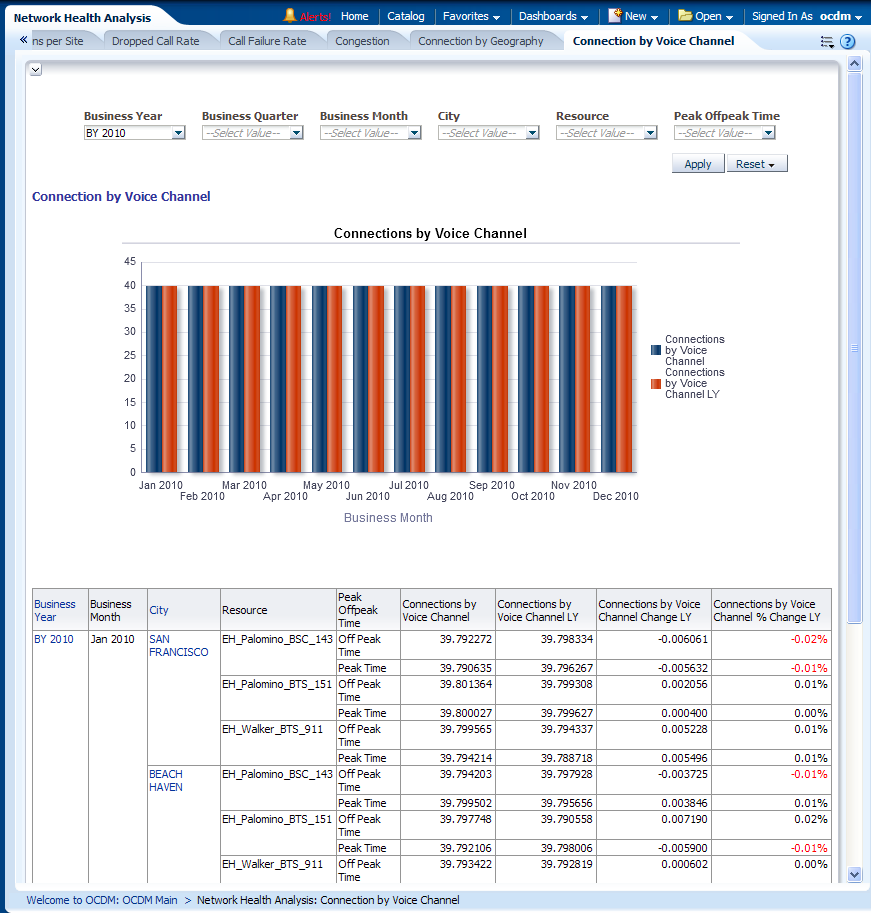
This report, as shown in Figure 13-68 provides month-level transaction activity information based on connections by voice channel measures, for one or more location. This report shows will be used to collect most of the cell parameters.
Report dimensions are:
-
Business Time
-
Network Element
-
Geography
-
Peak Offpeak Time
Figure 13-68 Connection by Voice Channel Report
Description of "Figure 13-68 Connection by Voice Channel Report"
Network Usage
This area includes the reports: Number of Emergency Calls, Number of Call by Call Service Type, Number of Calls by Roaming Type, and Minutes of Usage by Call Type.
Number of Emergency Calls
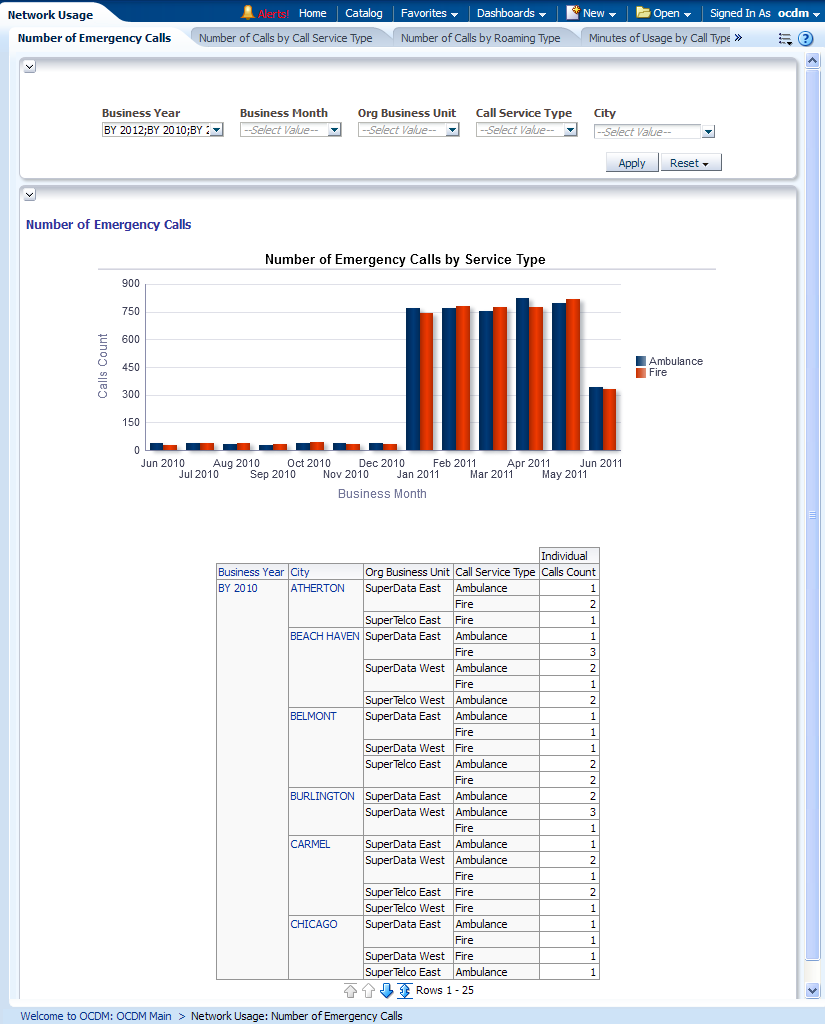
This report, as shown in Figure 13-69 provides the number of emergency calls.
Report dimensions are:
-
Organization
-
Business Time
-
Customer
-
Product
-
Call Service Type
-
Call Routing Type
Figure 13-69 Network Number of Emergency Calls Report
Description of "Figure 13-69 Network Number of Emergency Calls Report"
Number of Call by Call Service Type
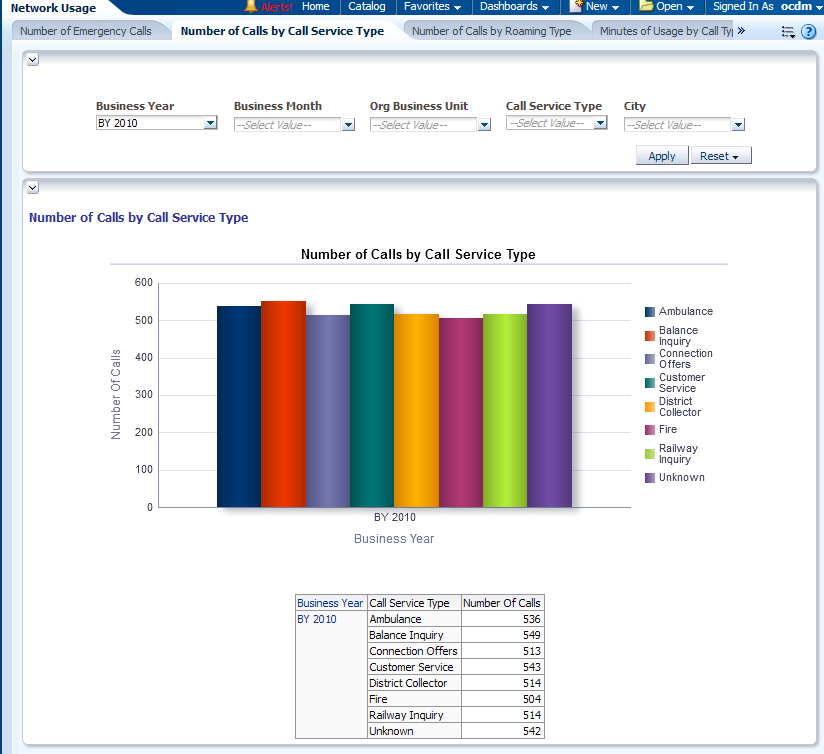
This shown in Figure 13-70 provides year-level transaction activity information based on number of calls measures, for different types of call services.
Report dimensions are:
-
Business Time
-
Call Category
Figure 13-70 Network Number of Call by Call Service Type Report
Description of "Figure 13-70 Network Number of Call by Call Service Type Report"
Number of Calls by Roaming Type
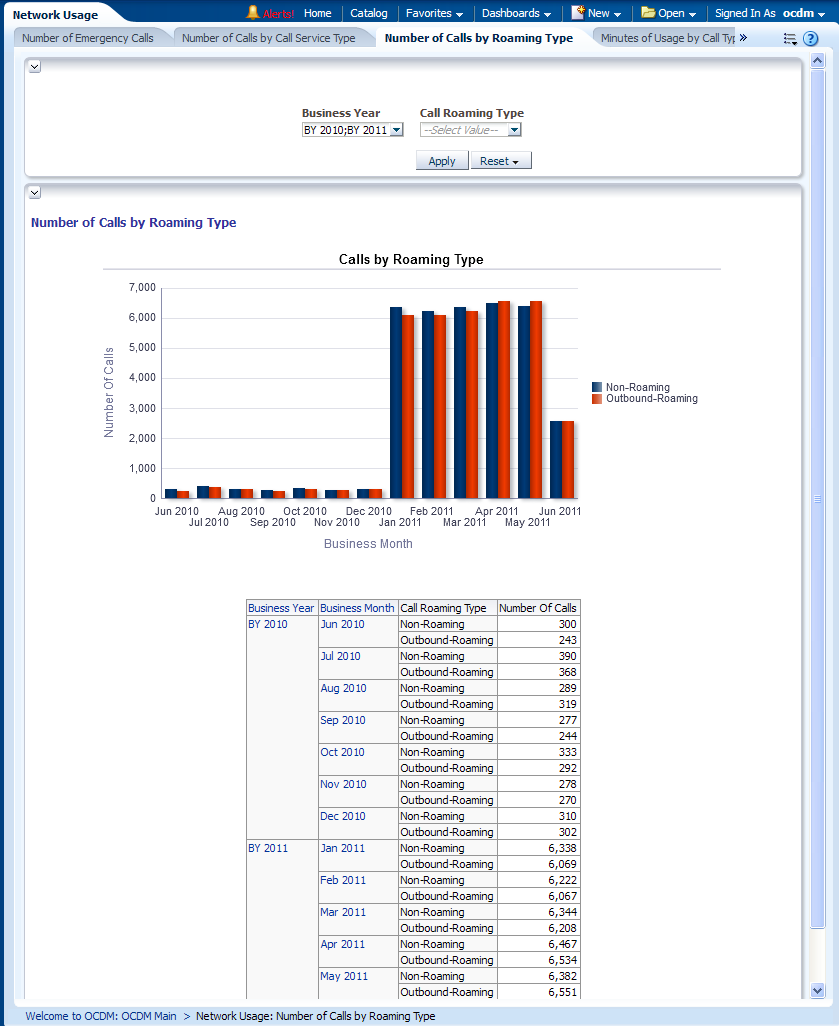
This shown in Figure 13-71 provides year-level transaction activity information based on the number of calls measures, for different types of call roaming.
Report dimensions are:
-
Business Time
-
Call Routing Type
Figure 13-71 Network Number of Calls by Roaming Type Report
Description of "Figure 13-71 Network Number of Calls by Roaming Type Report"
Minutes of Usage by Call Type
This as shown in Figure 13-72 provides year-level transaction activity information based on no of calls measures, for different types of call categories.
Report dimensions are:
-
Business Time
-
Call Category
Figure 13-72 Minutes of Usage by Call Type Report
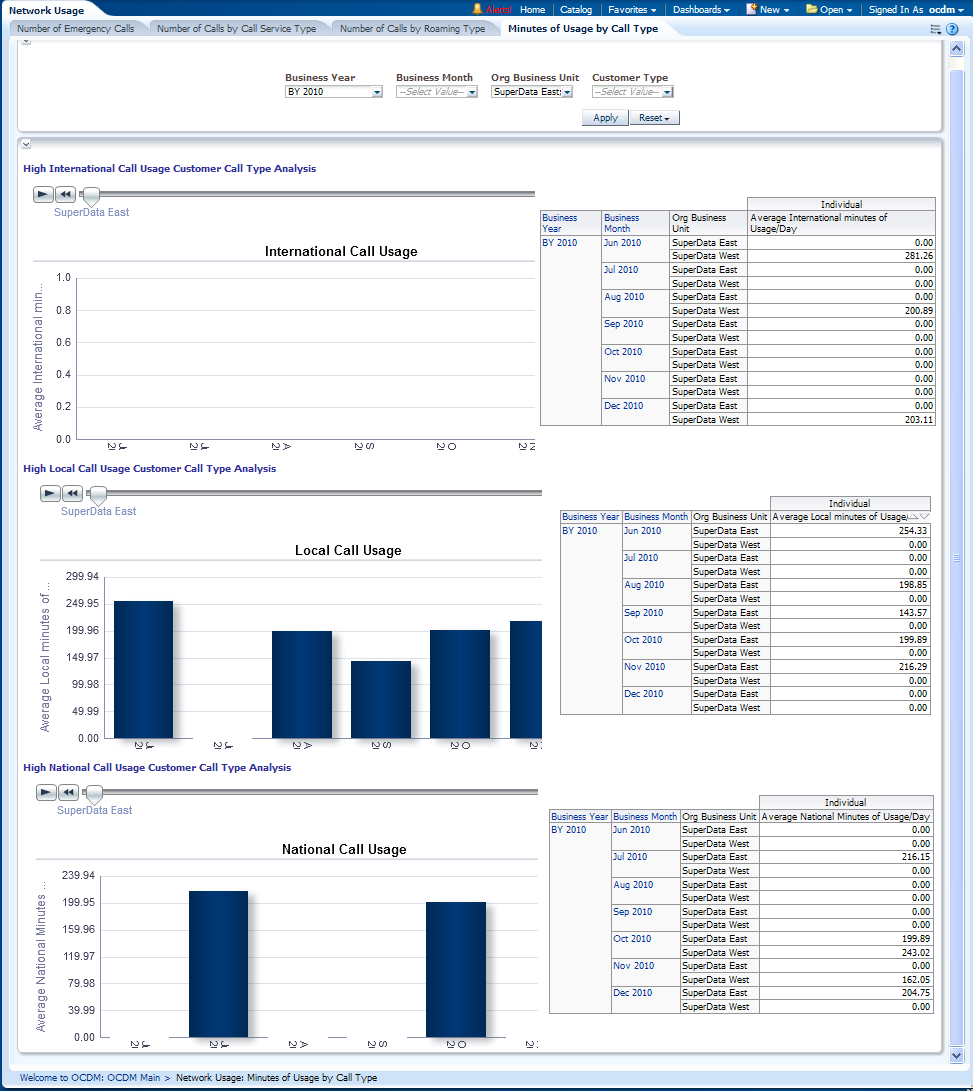
Description of "Figure 13-72 Minutes of Usage by Call Type Report"
