Marketing Reports
Targeted Promotion Lift and List
This area includes the report Customer Promotion List and
Customer Promotion List
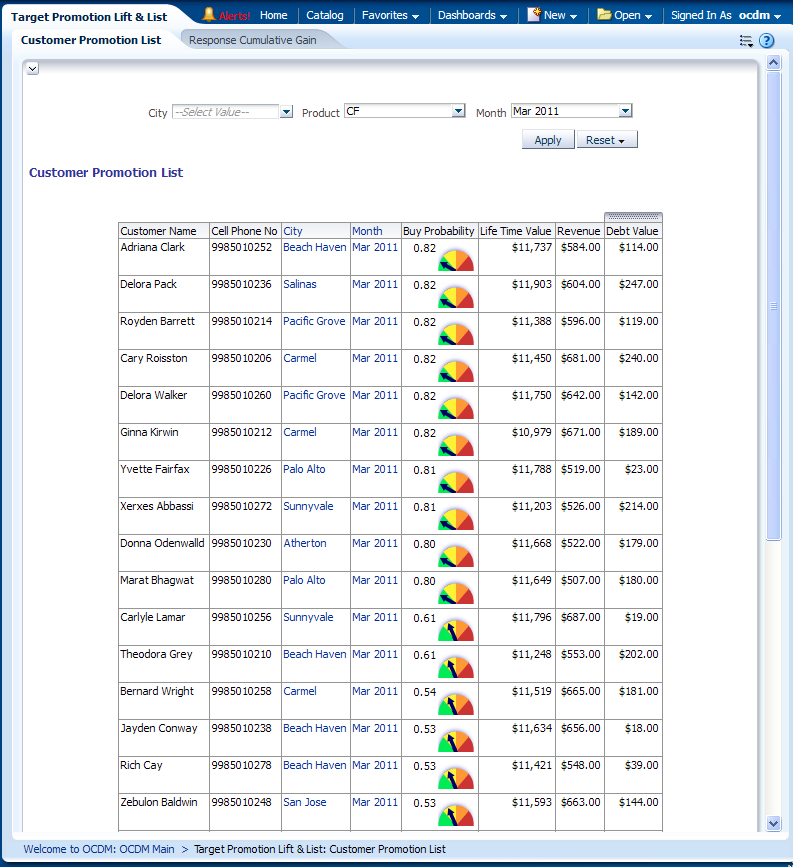
This report, as shown in Figure 13-73 provides a list of customers ranked by their probability of buying a product. For each customer, the life time value , ARPU, and Debt value are displayed for quick reference.
The buying probability of each customer on the product is calculated by Oracle Communications Data Model Targeted Promotion Mining model.
Report dimensions are:
-
Customer
Figure 13-73 Customer Promotion List Report
Description of "Figure 13-73 Customer Promotion List Report"
Response Cumulative Gain
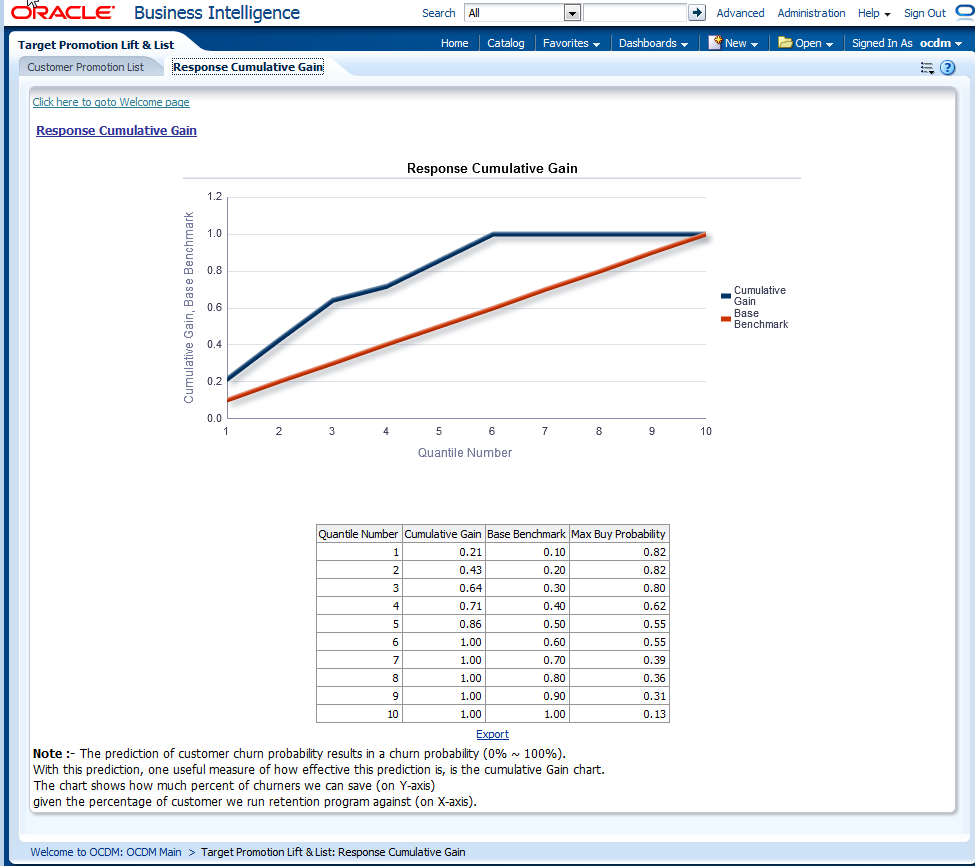
This report as shown in Figure 13-74 shows the Oracle Communications Data Model Churn prediction Model performance; this helps you determine a threshold for the percent of customers to run in the retention program. This retention can be done using phone calls or email. For example, according to the details in Figure 13-74, if the service provider selects 20% of MOST Likely churners according to the Oracle Communications Data Model Churn Prediction model, they can cover about 74% of real churners.
The chart here shows the accuracy of customers so identified under retention program prediction rather than picking on random selection of customers (shown as a straight line).
Report dimensions are:
-
Churn SVM ROC
Figure 13-74 Response Cumulative Gain Report
Description of "Figure 13-74 Response Cumulative Gain Report"
Customer Market Share Analysis
This area includes the report Customer Market Share Report.
Customer Market Share Report
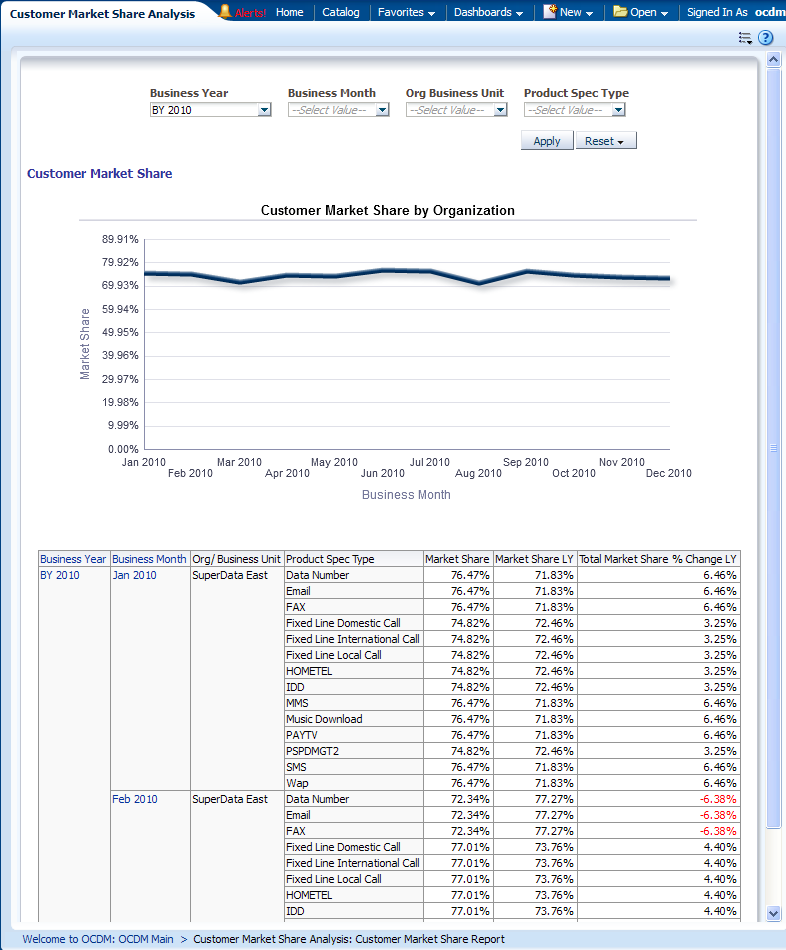
This report as shown in Figure 13-75 shows month-level Customer Market share, comparing with competitors. The data is acquired from an external marketing source.
Report dimensions are:
-
Business Time
-
Organization
-
Product Specification Type
Figure 13-75 Customer Market Share Analysis Report
Description of "Figure 13-75 Customer Market Share Analysis Report"
Current Customer Base Analysis
This area includes the reports: Current Customer Base, Customer Base Organization Share, and Customer Base Product Share.
Current Customer Base
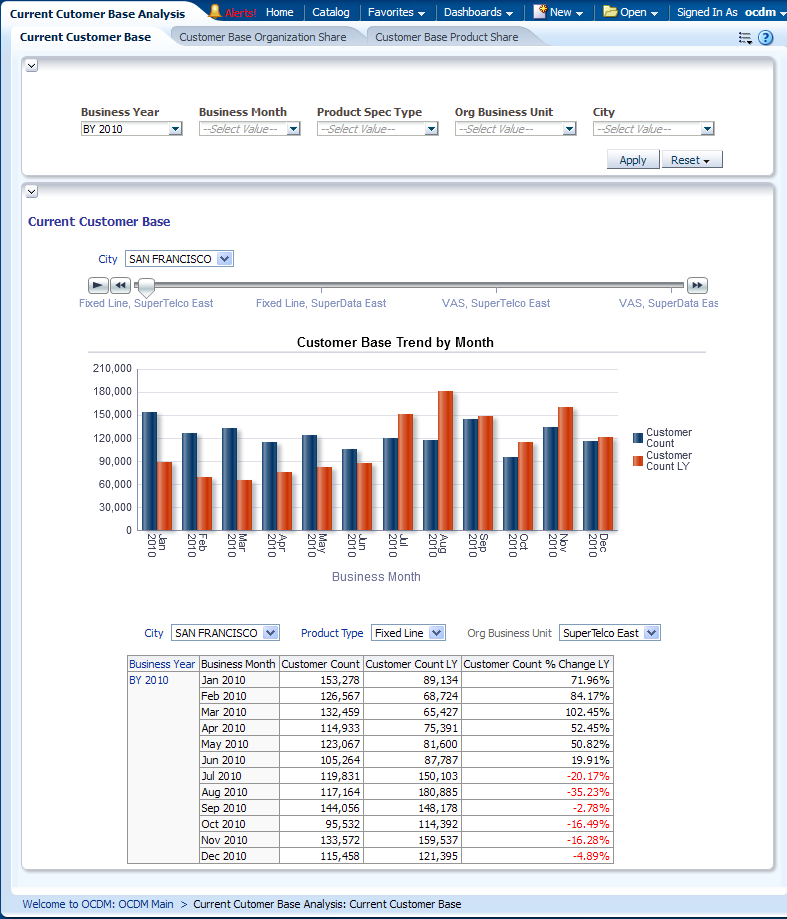
This report, as shown in Figure 13-76 provides month-level transaction activity information based on no of customer measures, for one or more locations.
Report dimensions are:
-
Business Time
-
Organization
-
Product
-
Geography
Figure 13-76 Current Customer Base Report
Description of "Figure 13-76 Current Customer Base Report"
Customer Base Organization Share
This as shown in Figure 13-77 provides month-level number of customers for each organization business unit, and also gives the share of customer count inside their parent organization.
Report dimensions are:
-
Business Time
-
Organization
-
Product Type
Figure 13-77 Customer Base Organization Share Report
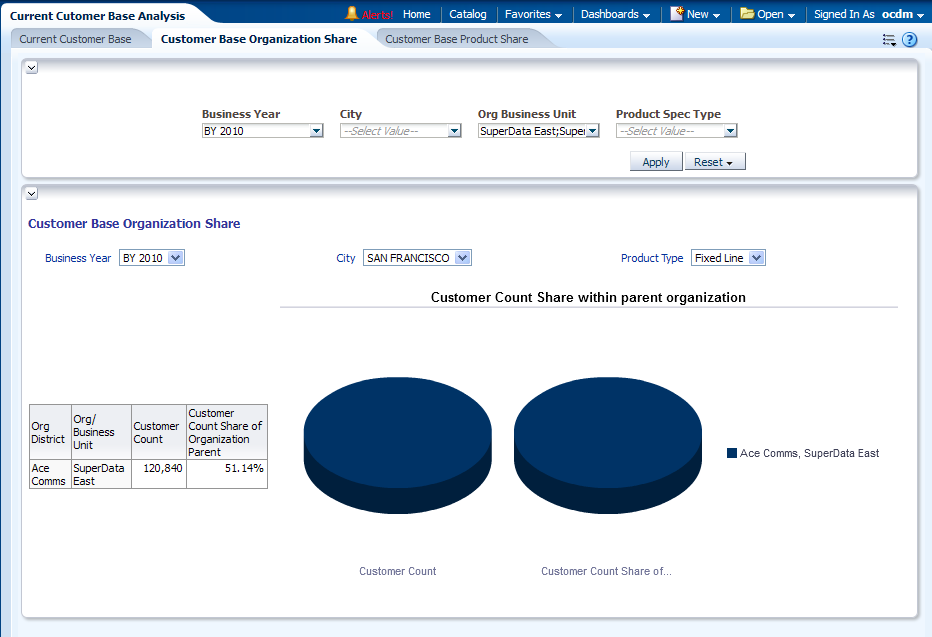
Description of "Figure 13-77 Customer Base Organization Share Report"
Customer Base Product Share
This as shown in Figure 13-78 provides month-level number of customers for each products (subscription). The customer share of each product is listed for the selected products and organizations.
Report dimensions are:
-
Business Time
-
Organization
-
Product Type
Figure 13-78 Customer Base Product Share Report
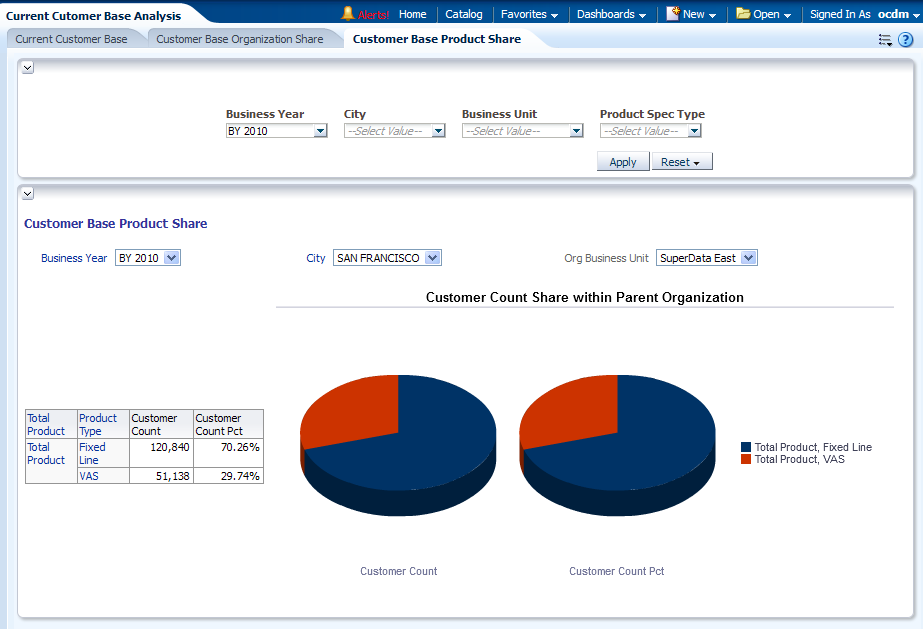
Description of "Figure 13-78 Customer Base Product Share Report"