Finance Reports
The finance reports include the following areas: Operational Finance Analysis and Profitability Analysis.
This area includes the following:
Operational Finance Analysis
This area includes the reports: Operating Cost, Average Operating Cost per Customer, Average operating Cost per Employee, Investment Cost, Advertising Cost Report, and Average Cost of Controlling Attrition per Employee.
Operating Cost
This report, as shown in Figure 13-79 and Figure 13-80 provide the current year month-level "Operating Cost" information for each organization business unit. The report also ranks all organization business units according to their cost in their parent "Organization". The end user can compare the cost with last years metrics such as: LY, % Change LY, YTD, YTD LY, YTD % Change LY.
Report dimensions are:
-
Business Time
-
Organization
Figure 13-79 Operating Cost Report (left side of report)
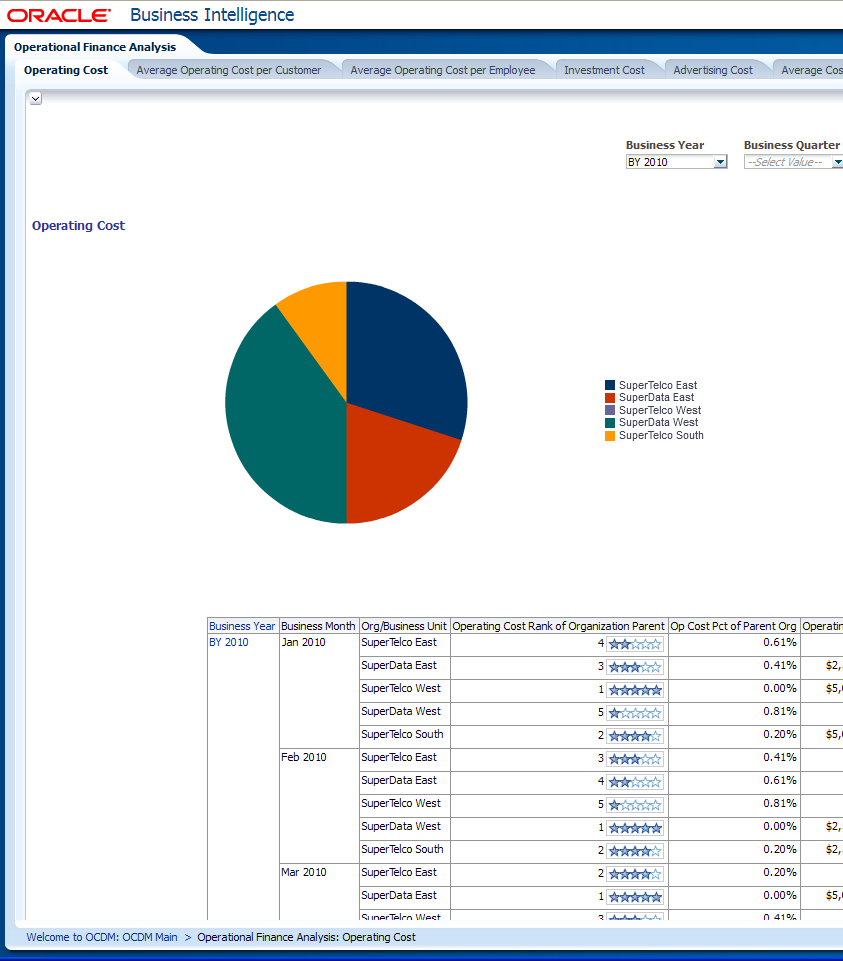
Description of "Figure 13-79 Operating Cost Report (left side of report)"
Figure 13-80 Operating Cost Report (right side of report)
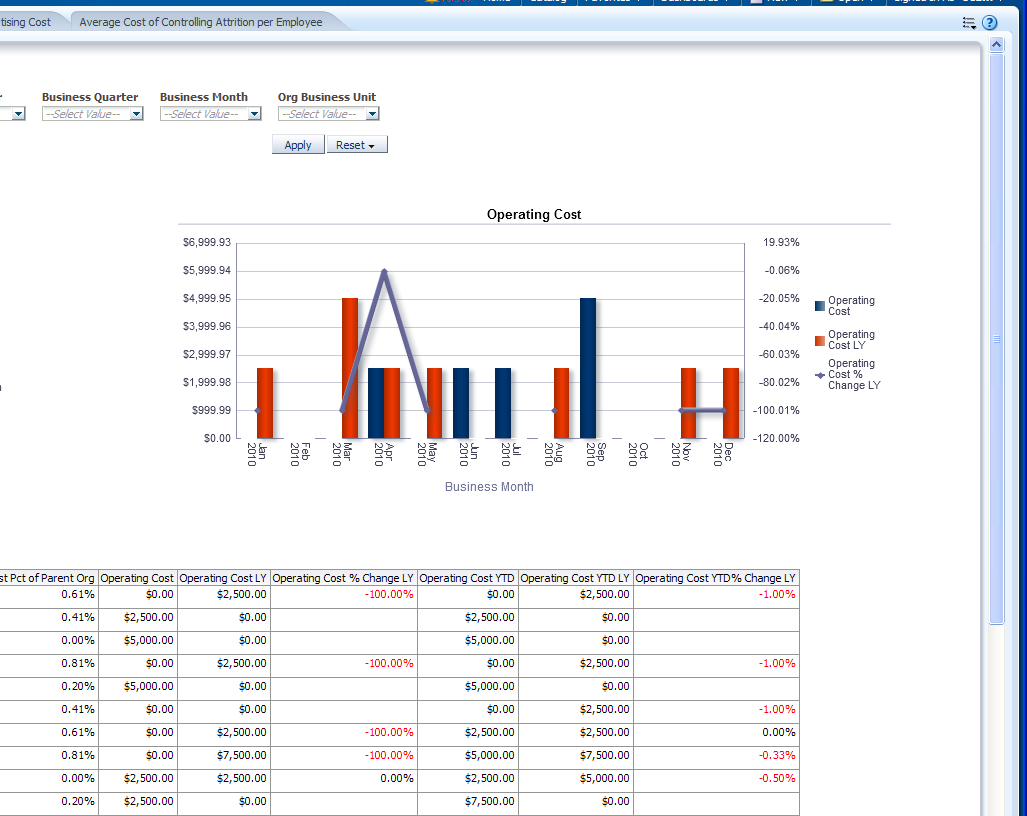
Description of "Figure 13-80 Operating Cost Report (right side of report)"
Average Operating Cost per Customer
This report, as shown in Figure 13-81 provides the current year month-level "Average Operating Cost per Customer" information based on "Organization Unit" which can be compared with last years metrics like LY, % Change LY.
Report dimensions are:
-
Business Time
-
Organization
Figure 13-81 Average Operating Cost per Customer Report
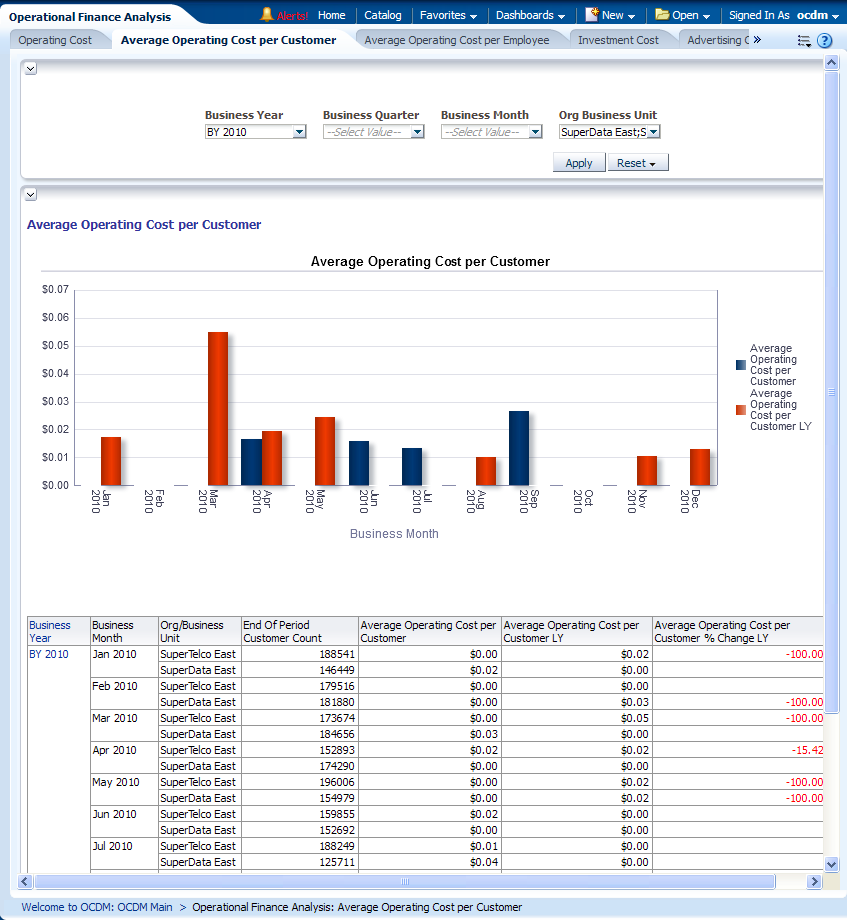
Description of "Figure 13-81 Average Operating Cost per Customer Report"
Average operating Cost per Employee
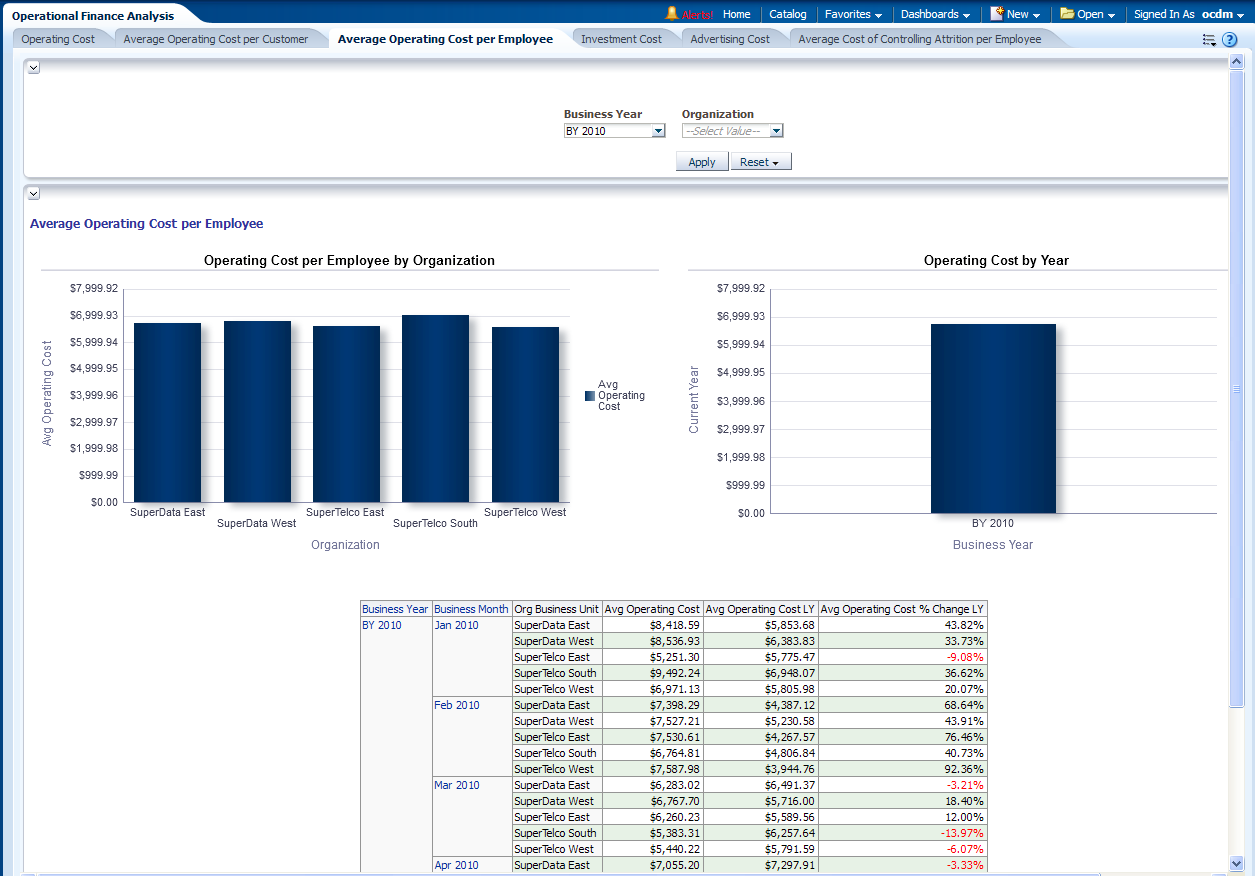
This report, as shown in Figure 13-82 provides the current year "Average Operating Cost per Employee" information based on "Organization Business Unit" which can be compared with last years metrics such as: LY, % Change LY.
Report dimensions are:
-
Business Time
-
Organization
Figure 13-82 Cost: Average Operating Cost per Employee
Description of "Figure 13-82 Cost: Average Operating Cost per Employee"
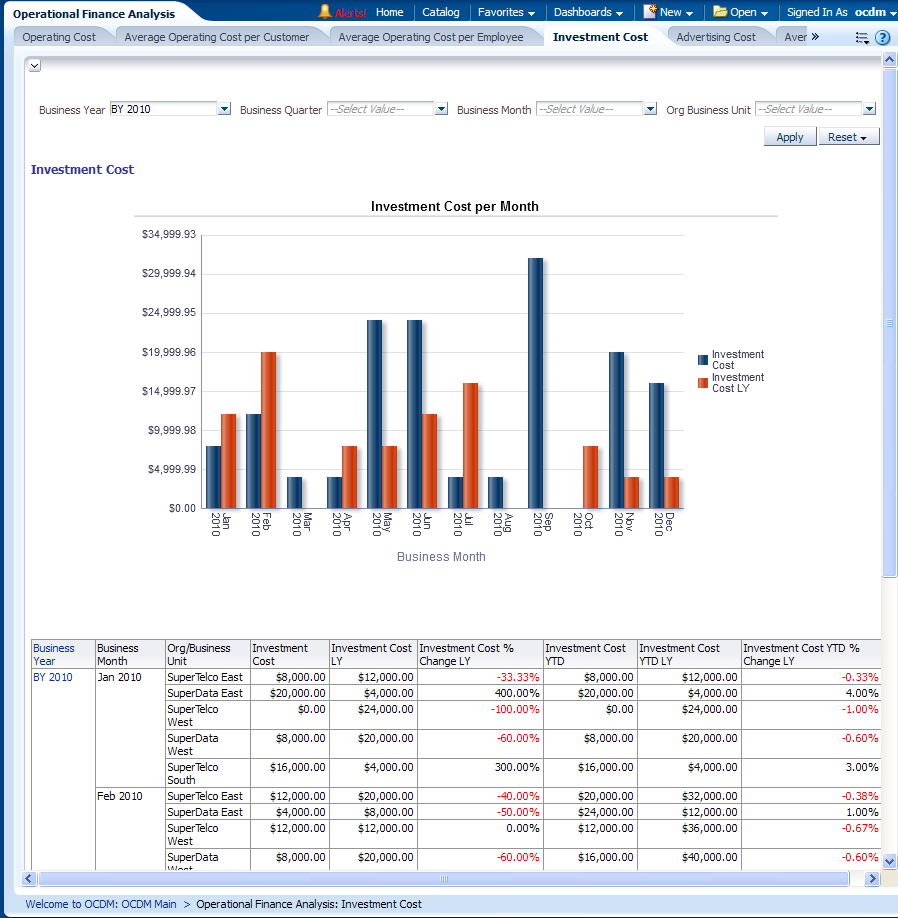
Investment Cost
This report, as shown in Figure 13-83 provides the current year month-level "Investment Cost" and "Investment Cost share of parent Organization" information based on "Organization Unit and district" which can be compared with last years metrics like LY, % Change LY, YTD, YTD LY and YTD % Change LY.
Report dimensions are:
-
Business Time
-
Organization
Advertising Cost Report
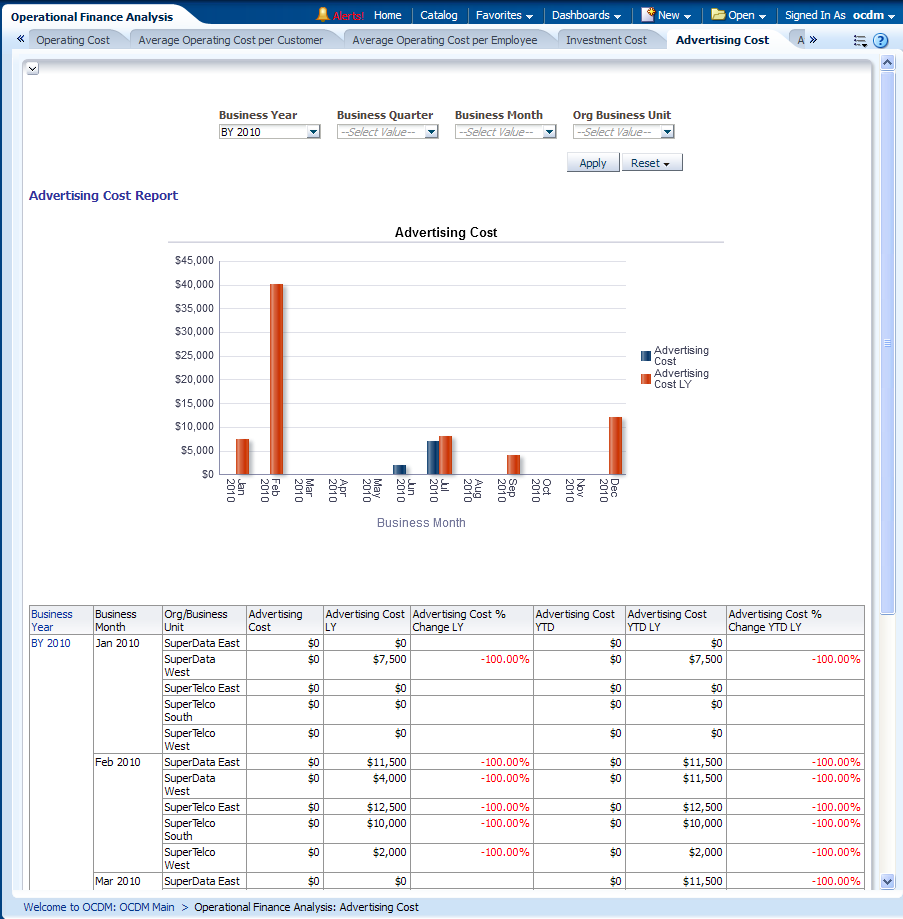
This report, as shown in Figure 13-84 provides the current year month-level "Advertising Cost" information based on "Organization Parent" which internally can be compared with last years metrics like LY,% Change LY, YTD, YTD LY, YTD % Change LY.
Report dimensions are:
-
Business Time
-
Organization
Figure 13-84 Advertising Cost Report Report
Description of "Figure 13-84 Advertising Cost Report Report"
Average Cost of Controlling Attrition per Employee
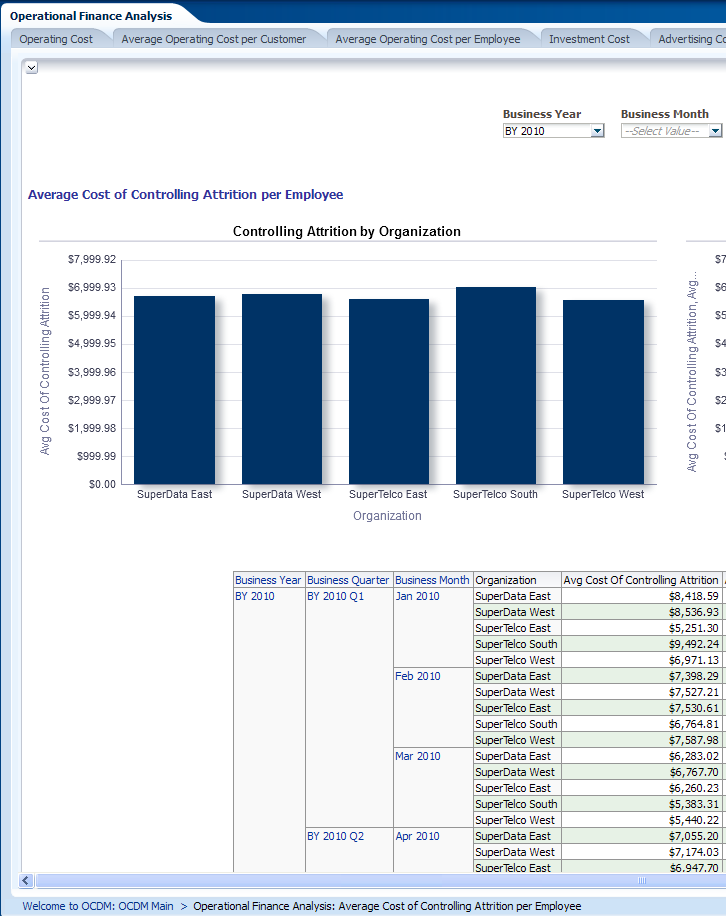
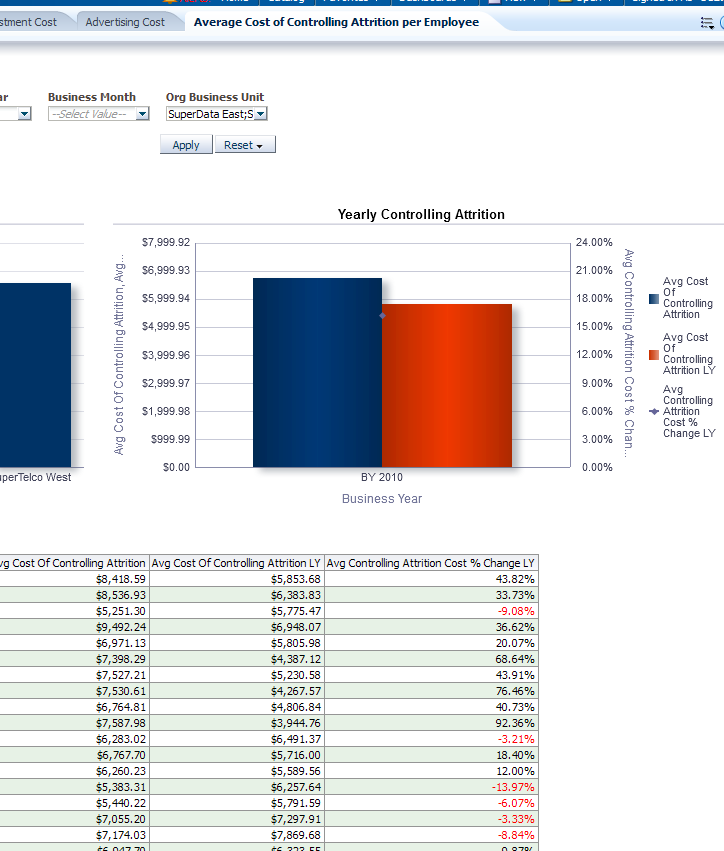
This report, as shown in Figure 13-85 and Figure 13-86 provide the current year Level "Controlling Attribution by organization" and "Yearly Controlling Attribution" information based on "Organization" which can be compared with last years metrics like LY and % Change LY.
The attrition cost should be defined by the service operator.
Report dimensions are:
-
Business Time
-
Organization
-
Product
Figure 13-85 Average Cost of Controlling Attrition per Employee (left side of screen)
Description of "Figure 13-85 Average Cost of Controlling Attrition per Employee (left side of screen)"
Figure 13-86 Average Cost of Controlling Attrition per Employee (right side of screen)
Description of "Figure 13-86 Average Cost of Controlling Attrition per Employee (right side of screen)"
Profitability Analysis
This area includes the reports: Total Profit, Average Profit per Customer, and Average Profit per Employee.
Total Profit
This report, as shown in Figure 13-87 and Figure 13-88 provide the current year and month-level "Total Profit" information based on "Organization" which internally can be compared with last years metrics like LY,% Change LY, YTD, YTD LY, YTD % Change LY.
Report dimensions are:
-
Business Time
-
Organization
Figure 13-87 Total Profit Report (left side of screen)
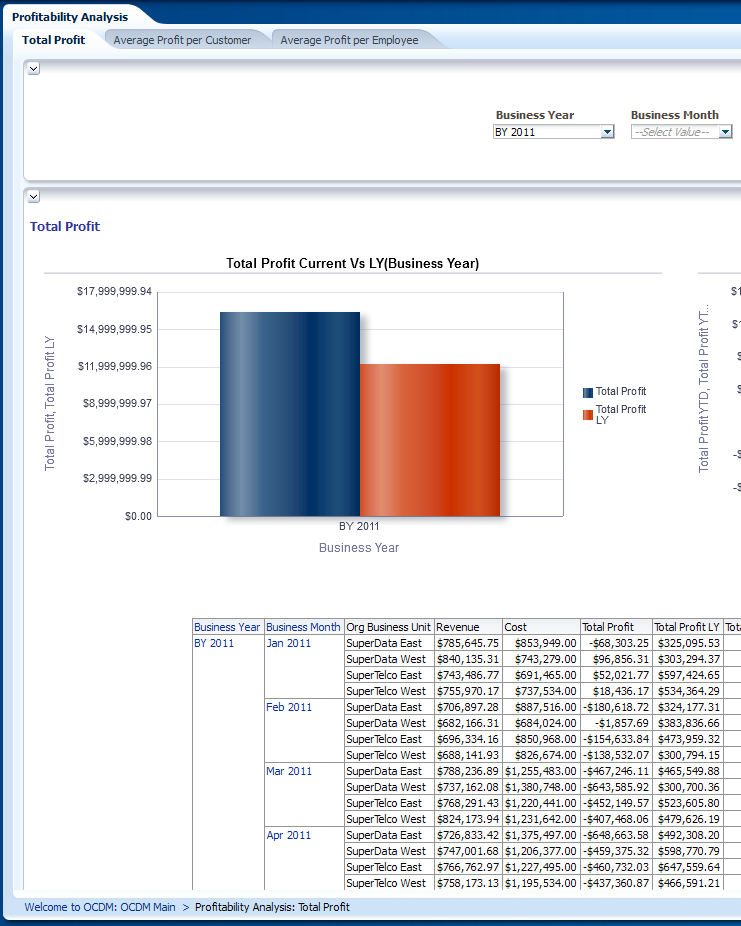
Description of "Figure 13-87 Total Profit Report (left side of screen)"
Figure 13-88 Total Profit Report (right side of screen)
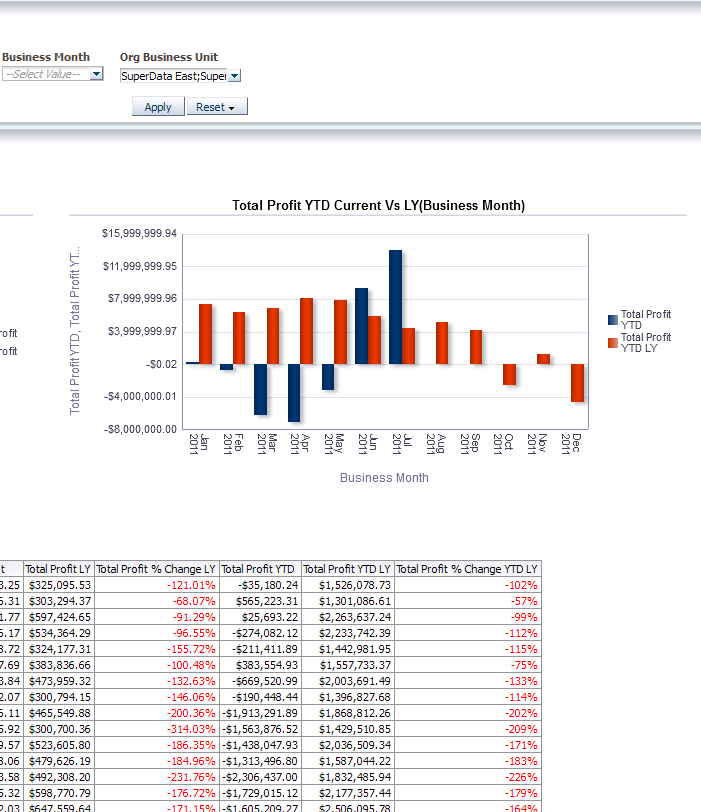
Description of "Figure 13-88 Total Profit Report (right side of screen)"
Average Profit per Customer
This report, as shown in Figure 13-89 provides the current year and month-level "Average Profit" information based on "Customer" and "Customer by Product" which internally can be compared with metrics such as LY, % Change LY for last year.
Report dimensions are:
-
Business Time
-
Organization
-
Product
-
Customer Type
Figure 13-89 Profit: Average Profit per Customer Report
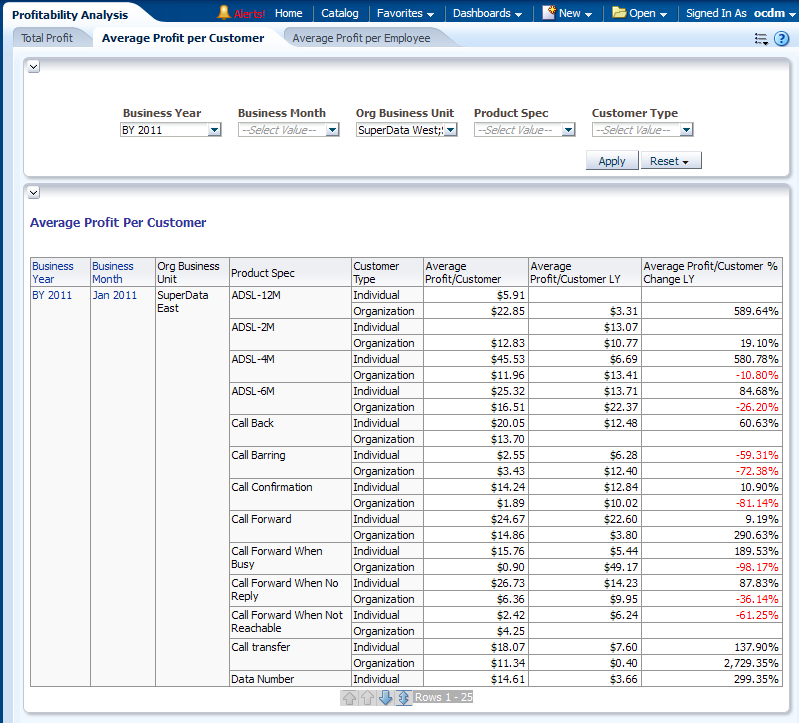
Description of "Figure 13-89 Profit: Average Profit per Customer Report"
Average Profit per Employee
This report, as shown in Figure 13-90 provides the current year and month-level "Average Profit" information based on "Employee" and "Org Business Unit" which can be compared with last years metrics like LY, % Change LY.
The average profit is calculated by dividing the total profit by the number of employees.
Report dimensions are:
-
Business Time
-
Organization
-
Product
-
Customer Type
Figure 13-90 Profit: Average Profit per Employee Report
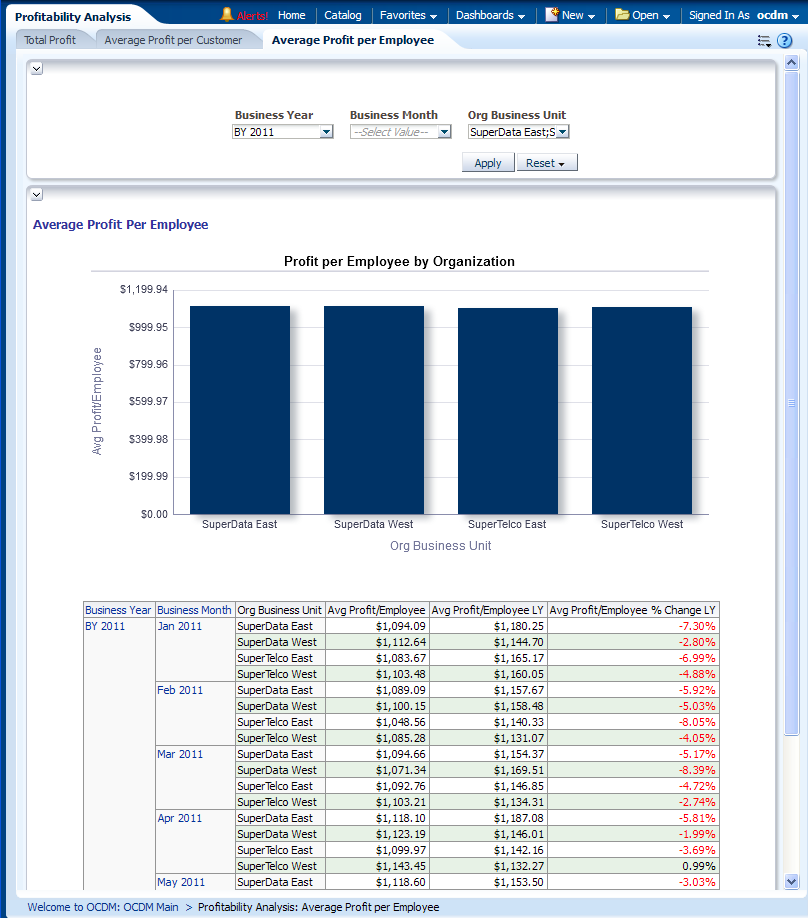
Description of "Figure 13-90 Profit: Average Profit per Employee Report"
