Partner Management Reports
Roaming Partner Settlement
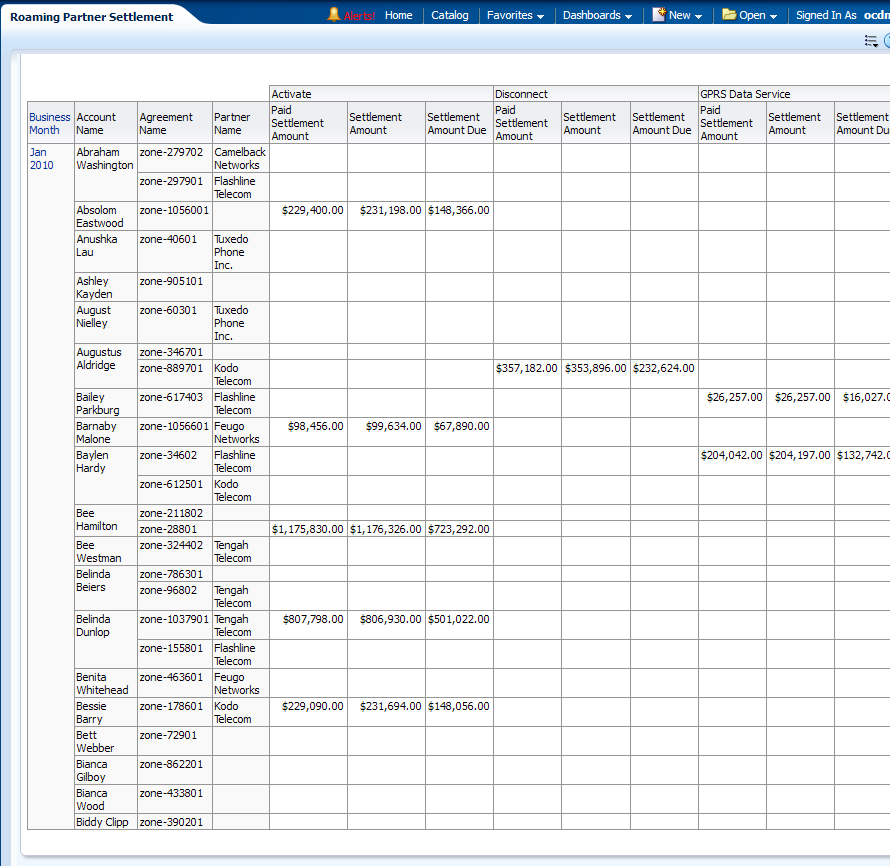
This area includes the report Roaming Partner Settlement Summary.
Roaming Partner Settlement Summary
This report, as shown in Figure 13-91 provides month-level transaction activity information based on partner settlement measures, for one or more location. This report shows summary over financial settlement activities happened to partners.
Report dimensions are:
-
Business Time
-
Geography
-
Billing Cycle
-
Event Type
-
Account
-
Party
-
Contract
Figure 13-91 Roaming Partner Settlement Summary Report

Description of "Figure 13-91 Roaming Partner Settlement Summary Report"
Churn Outliner by Partner
This area include the report: Churn Outliner by Partner and Track Dealer Commission and Performance.
Churn Outliner by Partner
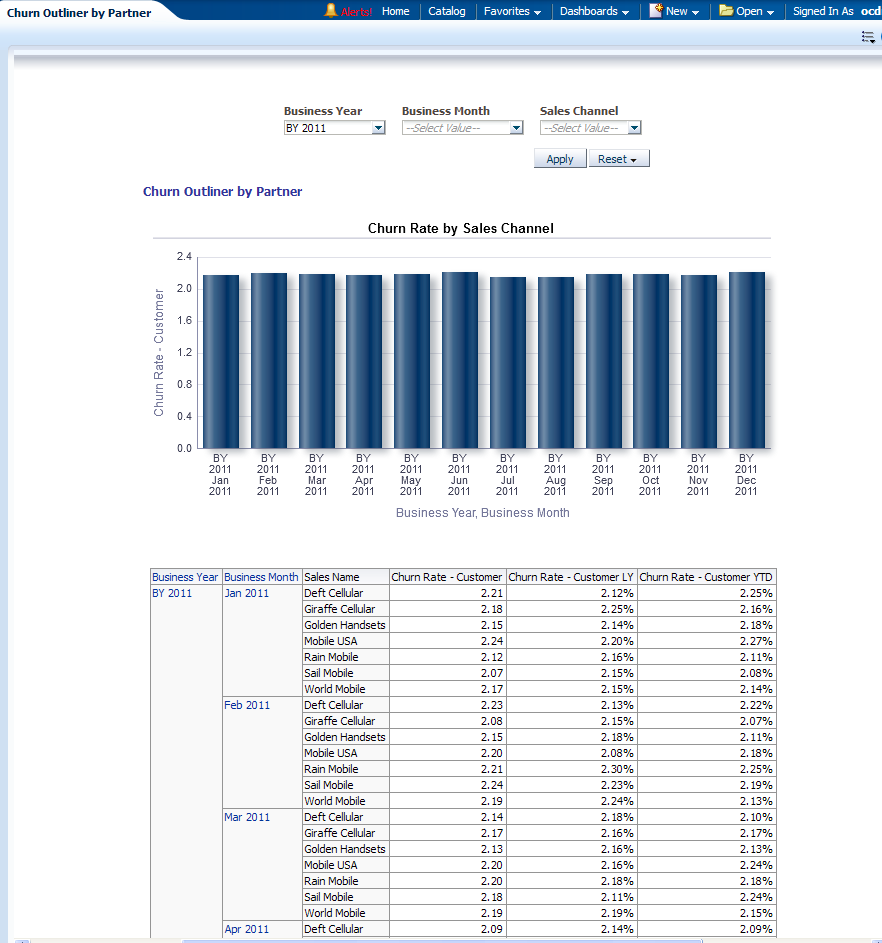
This report, as shown in Figure 13-92 provides year-level transaction activity information based on average churn rate for customer measures, for one or more sales channel.
This demonstrates statistically significant anomalies in churn rate by sales channel or partners (for example which channel records maximum churn) This can help identify problem area domains and facilitates further drill down to identify the cause of the problems (network problems and other problems) and take remedial actions to prevent churns. Actions could be further training or education to the partners, empowering them to offer additional incentives or discounts.
Report dimensions are:
-
Business Time
-
Sales Channel
Figure 13-92 Churn Outliner by Partner Report

Description of "Figure 13-92 Churn Outliner by Partner Report"
Partner Content Sales
This area includes the report Partner Content Sales.
Partner Content Sales
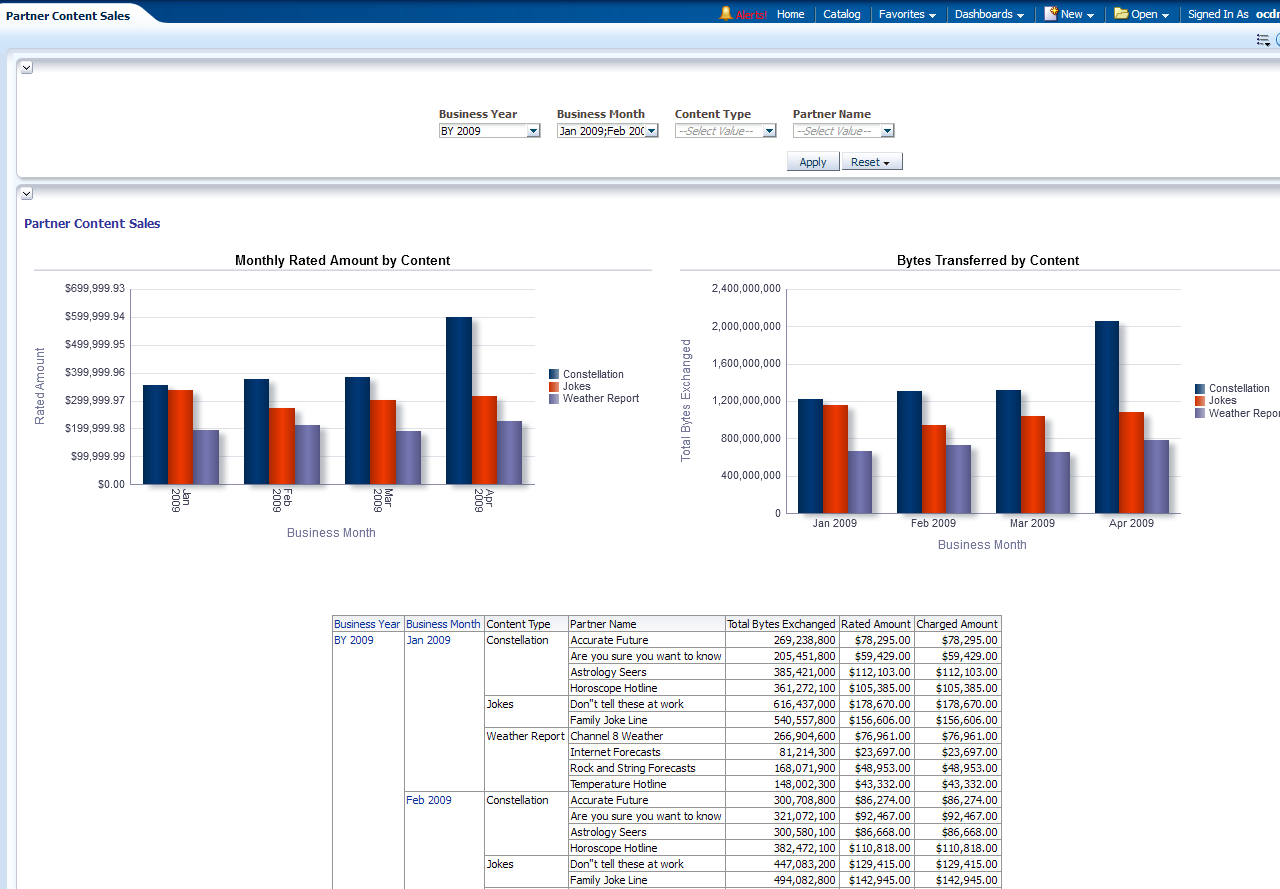
This report, as shown in Figure 13-93 provides month-level transaction activity information based on data usage measures, for one or more content.
Report dimensions are:
-
Business Time
-
Content Type
Figure 13-93 Partner Content Sales Report

Description of "Figure 13-93 Partner Content Sales Report"
Commissions
This area includes the report: Track Dealer Commission and Performance.
Track Dealer Commission and Performance
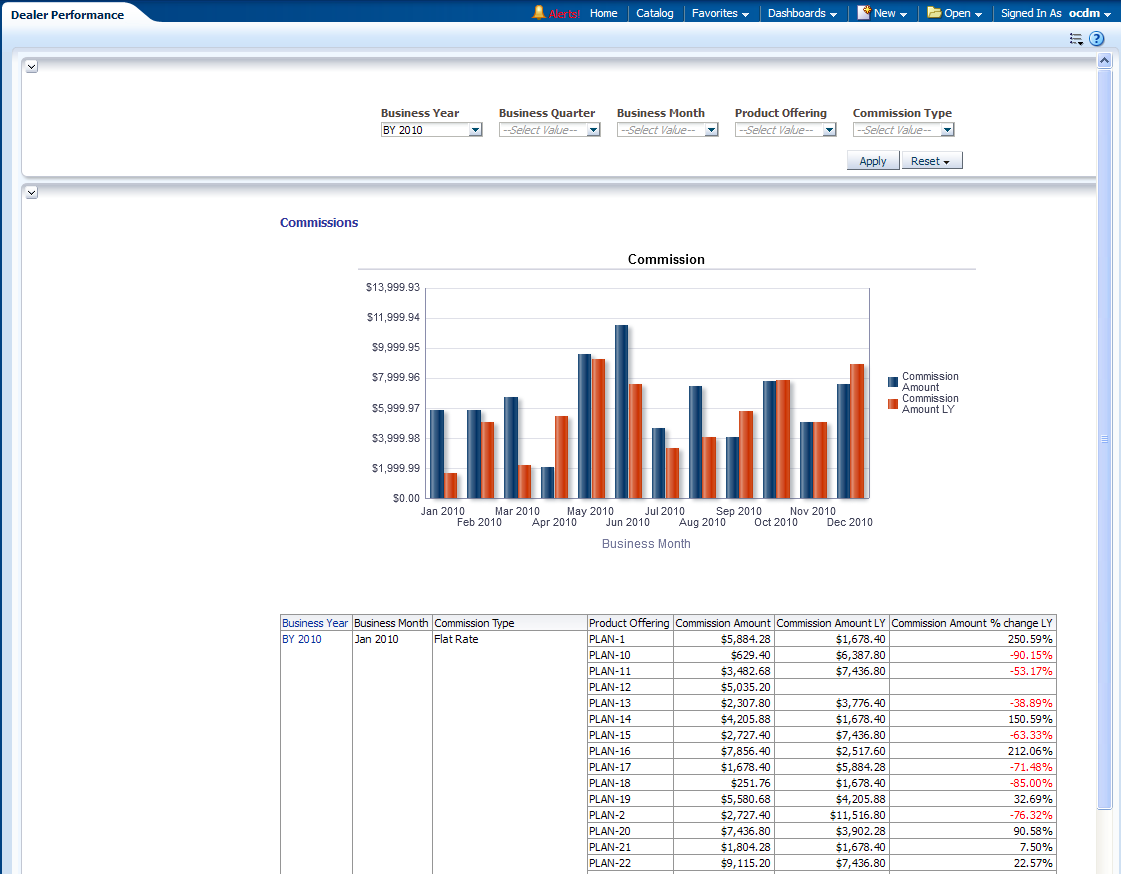
This report, as shown in Figure 13-94 gives the month level Dealer performance and commission generated based on a product.
Report dimensions are:
-
Business Time
-
Commission Type
-
Product
Figure 13-94 Track Dealer Commission and Performance Report

Description of "Figure 13-94 Track Dealer Commission and Performance Report"