Revenue Management Reports
Revenue Analysis and Forecast
This area includes the reports: Monthly Revenue, Revenue Forecast, Average Revenue per User (ARPU), and Average Revenue per Employee.
Monthly Revenue
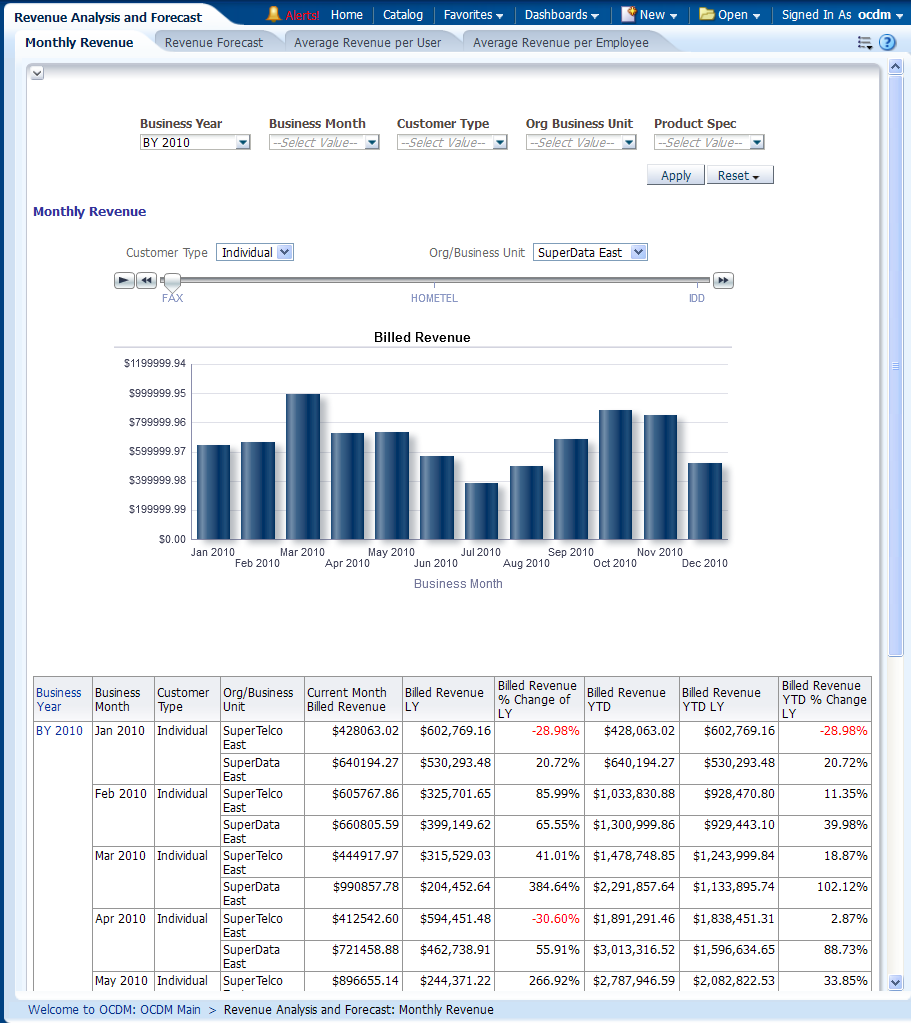
This report, as shown in Figure 13-29 provides month-level transaction activity information based on revenue measures, for one or more organizations and products and for one or more locations.
Report dimensions are:
-
Business Time
-
Customer Type
-
Product Specification
-
Geography
-
Organization
Revenue Forecast
This report, as shown in Figure 13-30 provides month-level transaction activity information based on revenue measures, for one or more locations.
Report dimensions are:
-
Business Time
-
Customer Type
-
Product
-
Geography
-
Organization
Average Revenue per User (ARPU)
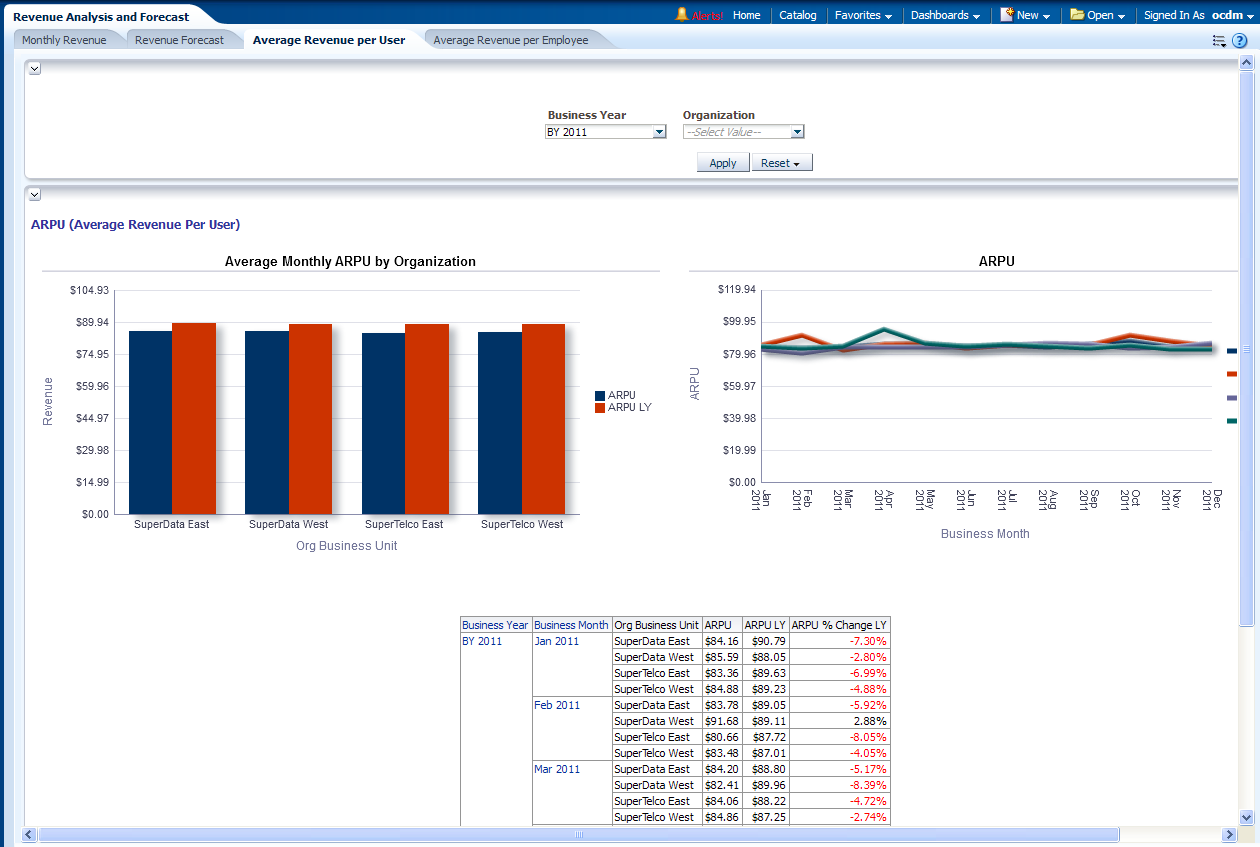
This report, as shown in Figure 13-31 provides month-level transaction activity information based on ARPU measures, for one or more stores and this is a calculation often used to determine the overall value of an application. This report used to generate revenue for a particular customer by comparing someone's account to the overall average.
Report dimensions are:
-
Business Time
-
Organization
Figure 13-31 Revenue Average Revenue per User (ARPU) Report
Description of "Figure 13-31 Revenue Average Revenue per User (ARPU) Report"
Average Revenue per Employee
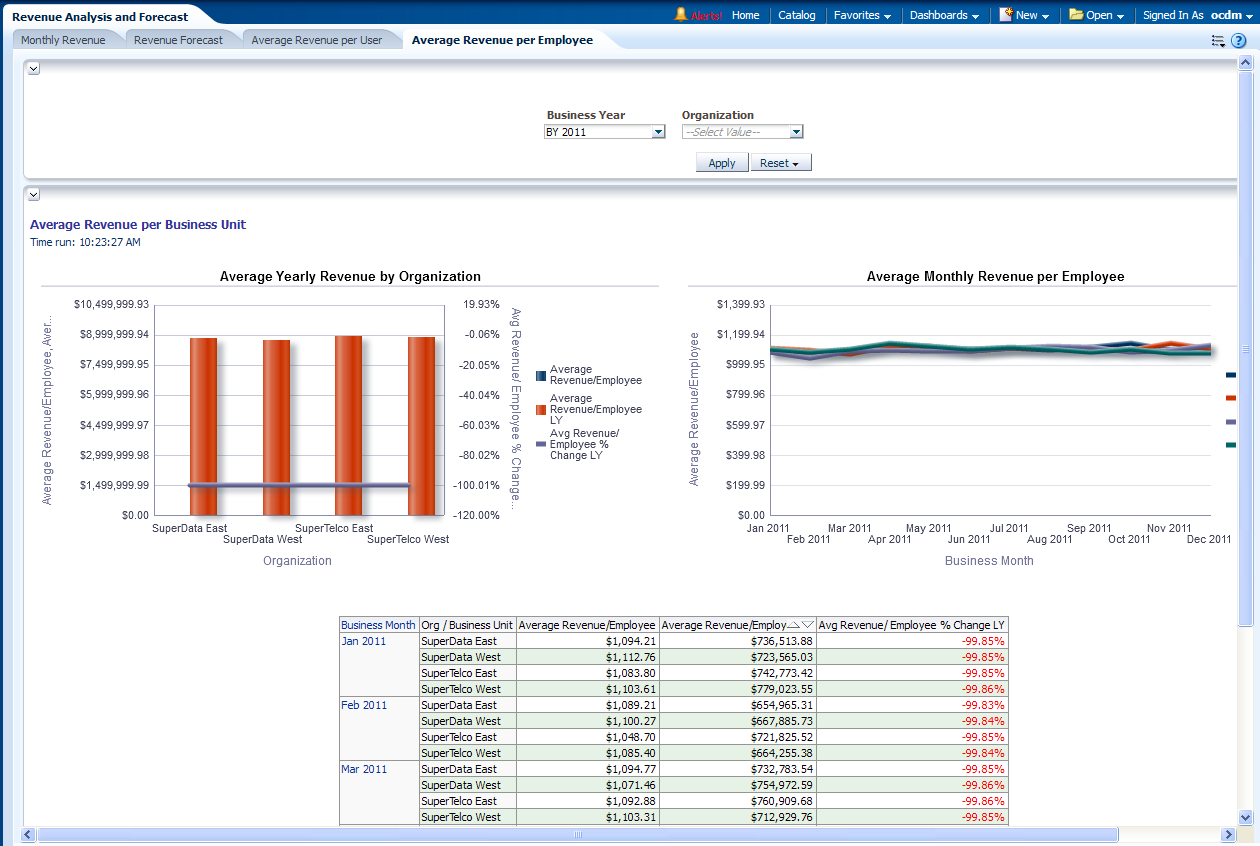
This report, as shown in Figure 13-32 shows the average revenue per Business Unit. The average revenue is calculated as total revenue of that organization divided by the number of employees.
Report dimensions are:
-
Business Time
-
Organization
Figure 13-32 Revenue Average Revenue per Employee Report
Description of "Figure 13-32 Revenue Average Revenue per Employee Report"
Revenue Assurance
This area includes the reports: CDR Revenue Compared to Collected Revenue, Percent of Suspended xDRs, Uncollected Revenue Percentage, and Revenue Assurance.
CDR Revenue Compared to Collected Revenue
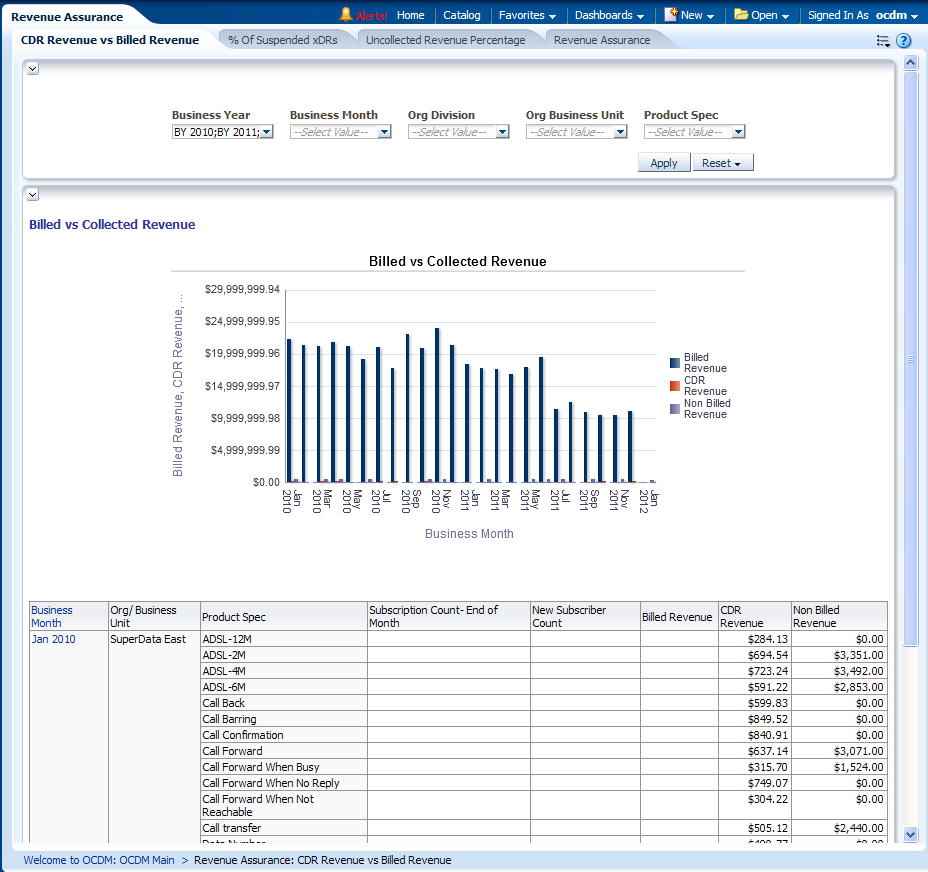
This report, as shown in Figure 13-33 analyzes CDR revenue, and compares, billed revenue with collected revenue for a product specification.
Report dimensions are:
-
Business Time
-
Organization
-
Product Specification
Figure 13-33 CDR Revenue Compared to Billed Revenue Report
Description of "Figure 13-33 CDR Revenue Compared to Billed Revenue Report"
Percent of Suspended xDRs
This report, as shown in Figure 13-34 shows analyzes suspended or errored billable xDRs. Those CDRs cannot be billed successfully and cause revenue leakage compared with the total xDRs.
Report dimensions are:
-
Business Time
-
Geography
Figure 13-34 Revenue Assurance Percent of Suspended xDRs Report
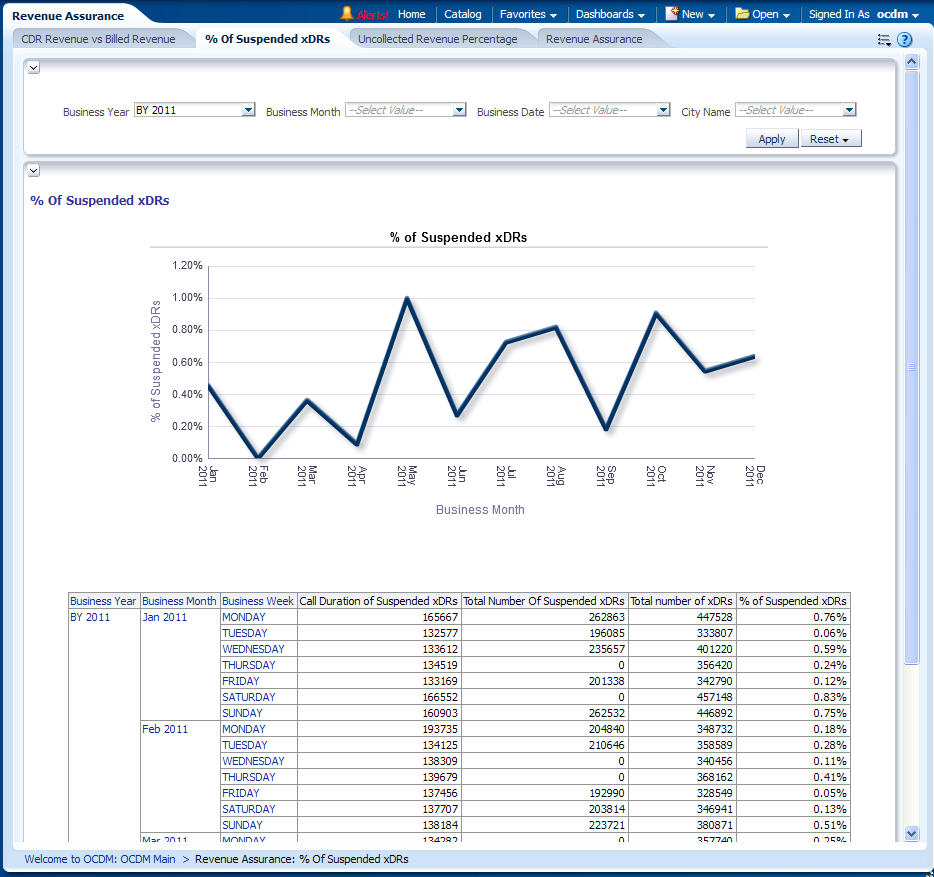
Description of "Figure 13-34 Revenue Assurance Percent of Suspended xDRs Report"
Uncollected Revenue Percentage
This report, as shown in Figure 13-35 analyzes the collected invoice amount and the uncollected amount for each Month. This is also a way to monitor the revenue leakage.
Report dimensions are:
-
Business Time
-
Organization
-
Customer Type
-
Geography
-
Product
Figure 13-35 Revenue Assurance Uncollected Revenue Percentage Report
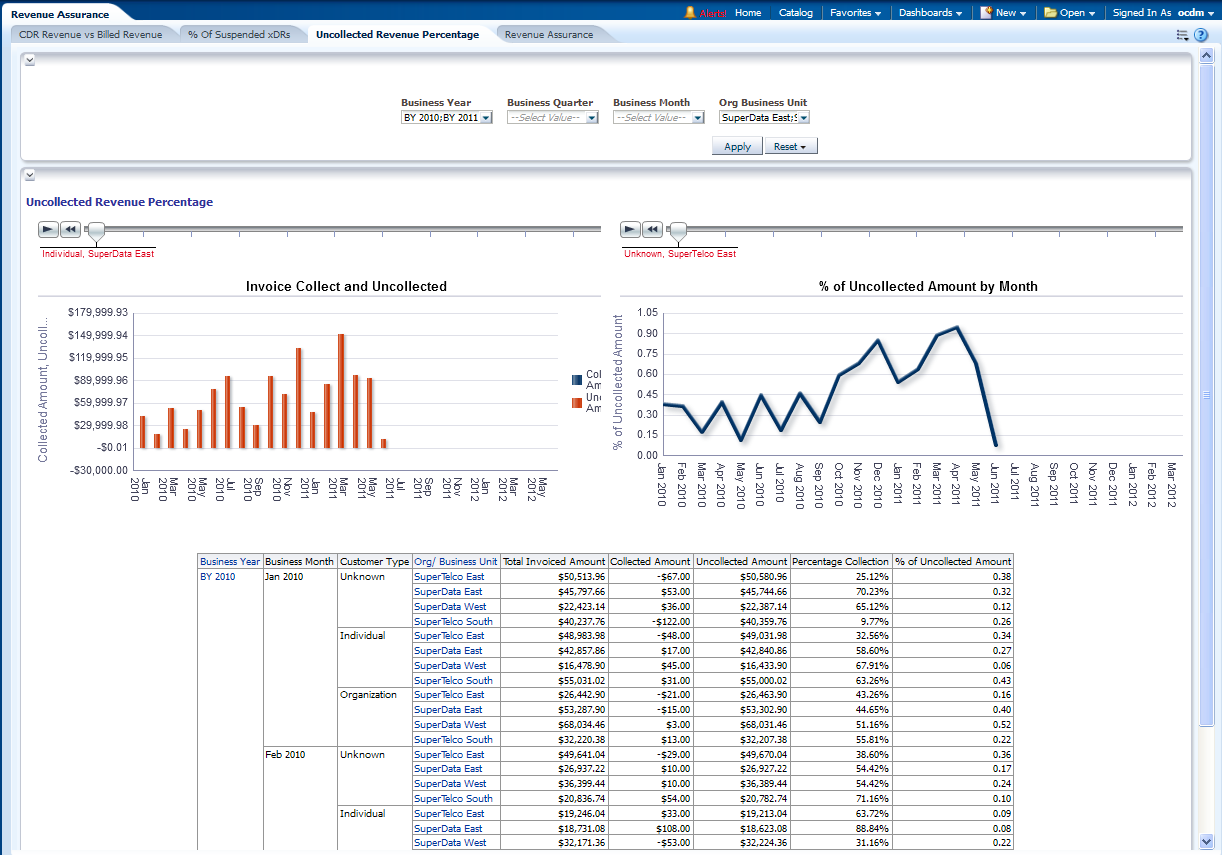
Description of "Figure 13-35 Revenue Assurance Uncollected Revenue Percentage Report"
Revenue Assurance
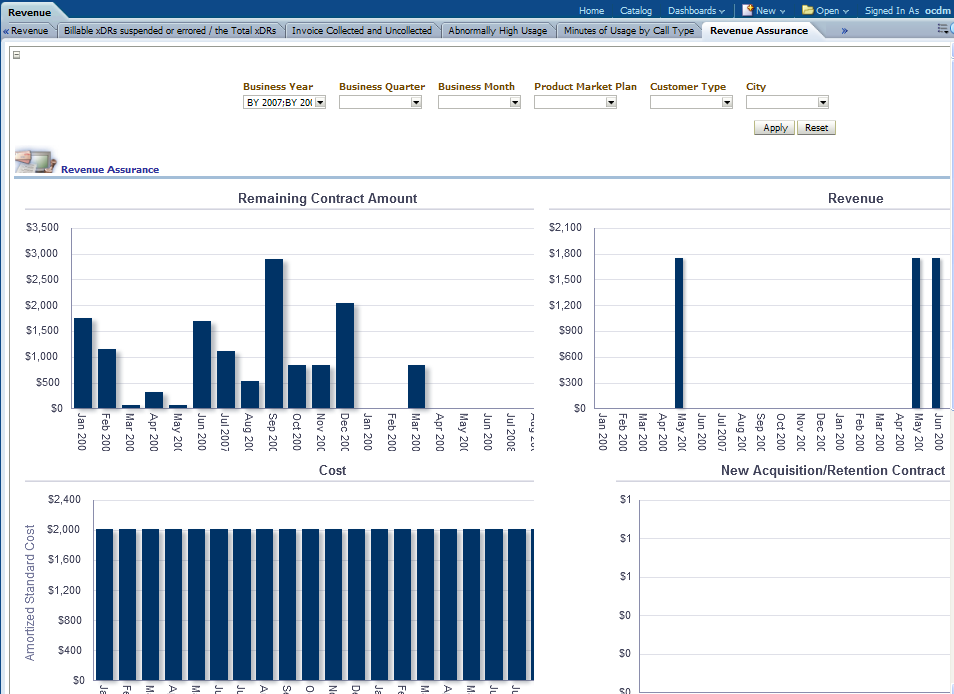
This report, as shown in Figure 13-36 determines how to best to assure that all of the revenue is earned. This is done by analyzing the revenue related information such as Remaining contract SUM, Retention count, and so on.The remaining contract Sum indicates how much revenue can be expected in next six months or one year for a given product or organization business unit.
Report dimensions are:
-
Business Time
-
Organization
-
Product Offering
-
Geography
Sales Analysis
This area includes the reports: Gross Sales and Net Sales.
Gross Sales
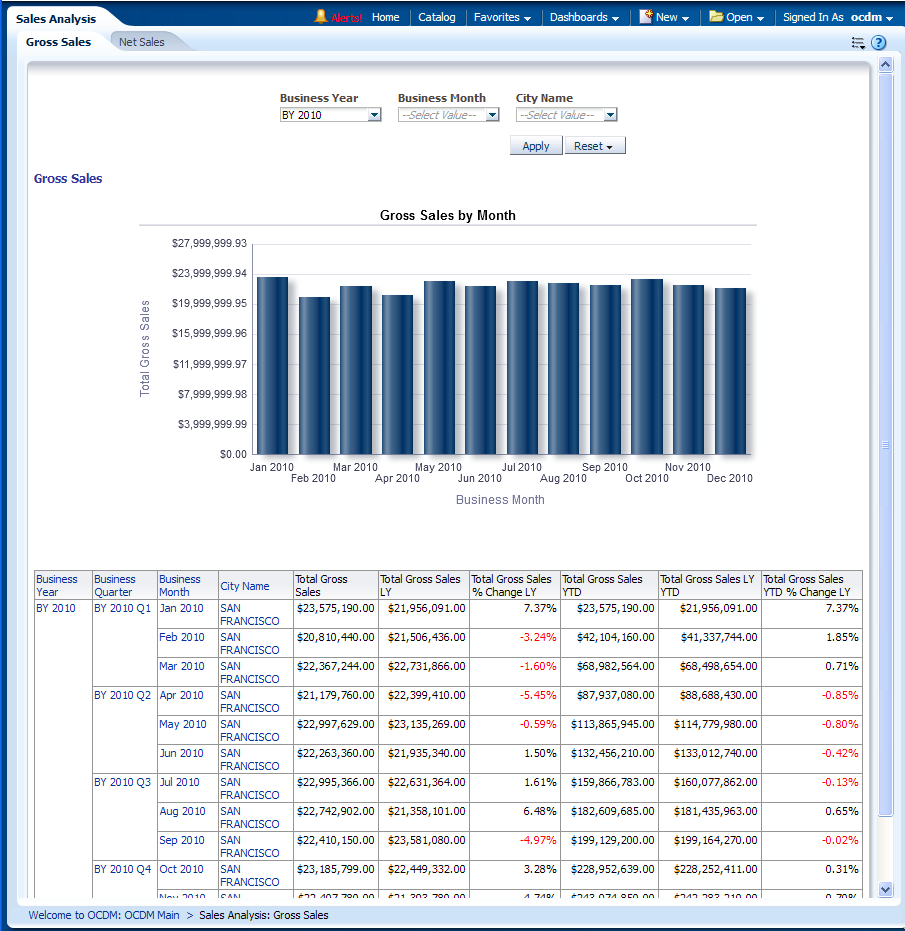
This report, as shown in Figure 13-37 provides month-level sales summary information, for one or more locations.
Report dimensions are:
-
Business Time
-
Product
-
Geography
Net Sales
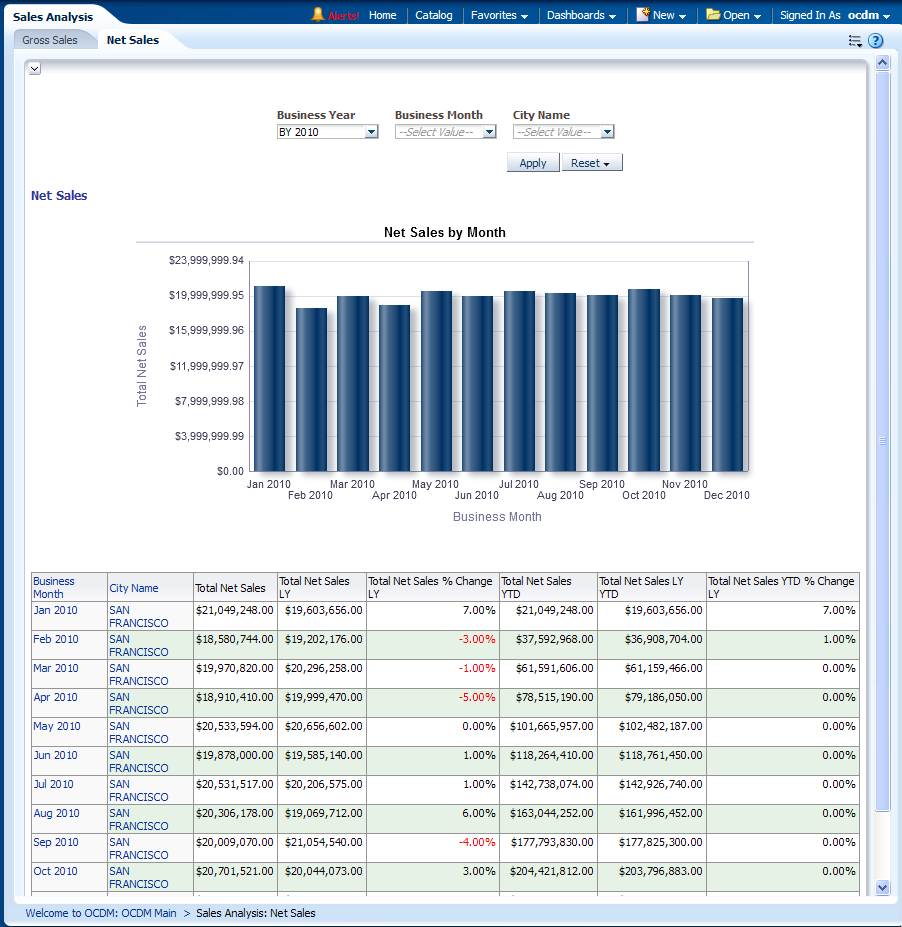
This report, as shown in Figure 13-38 provides month-level net sales summary, for one or more locations. The exact definitions of net sales can be refined by the service operator, while the default definition is the sales amount deducted by the cost of handset, human resources, and so on.
Report dimensions are:
-
Business Time
-
Product
-
Geography
Debt Collection
This area includes the reports: Debt Aging, Recovered Revenue Value, External Debt Collection, and Adjustment to Customer.
Debt Aging
This report, as shown in Figure 13-39 generates debt aging details for the customers currently in debt.
Report dimensions are:
-
Business Time
-
Organization
-
Debt Aging Band
-
Customer Type
-
Collection Agency
Recovered Revenue Value
This report, as shown in Figure 13-40 analyzes percentage of the recovered revenue value. After a certain period, if customer still cannot pay the bill, the collection begins. This report can analyze, for all collection amounts, how much is recovered and how much is abandoned.
Report dimensions are:
-
Business Time
-
Organization
-
Collection Agency
Figure 13-40 Revenue Debt Collection Recovered Revenue Value Sample Report
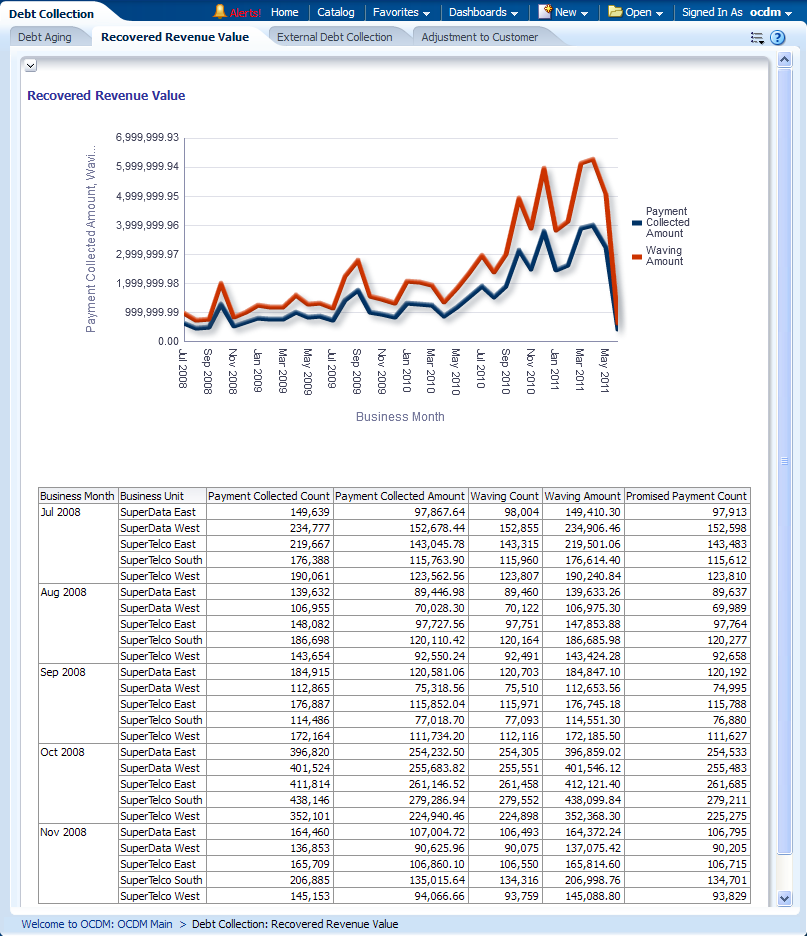
Description of "Figure 13-40 Revenue Debt Collection Recovered Revenue Value Sample Report"
External Debt Collection
This report, as shown in Figure 13-41 shows collection agency wise debt collected amount waiving amount.
Report dimensions are:
-
Business Time
-
Organization
-
Collection Agency
Figure 13-41 Revenue Debt Collection External Debt Collection Report
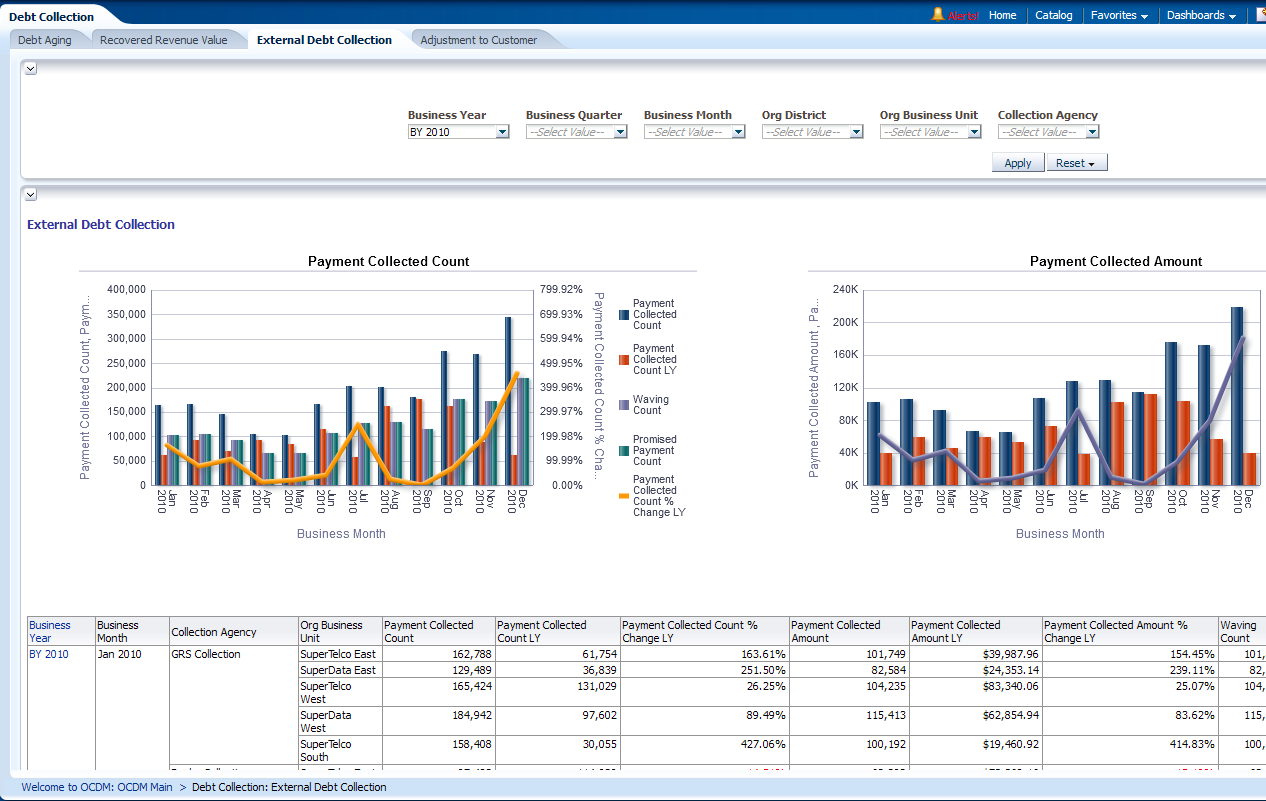
Description of "Figure 13-41 Revenue Debt Collection External Debt Collection Report"
Adjustment to Customer
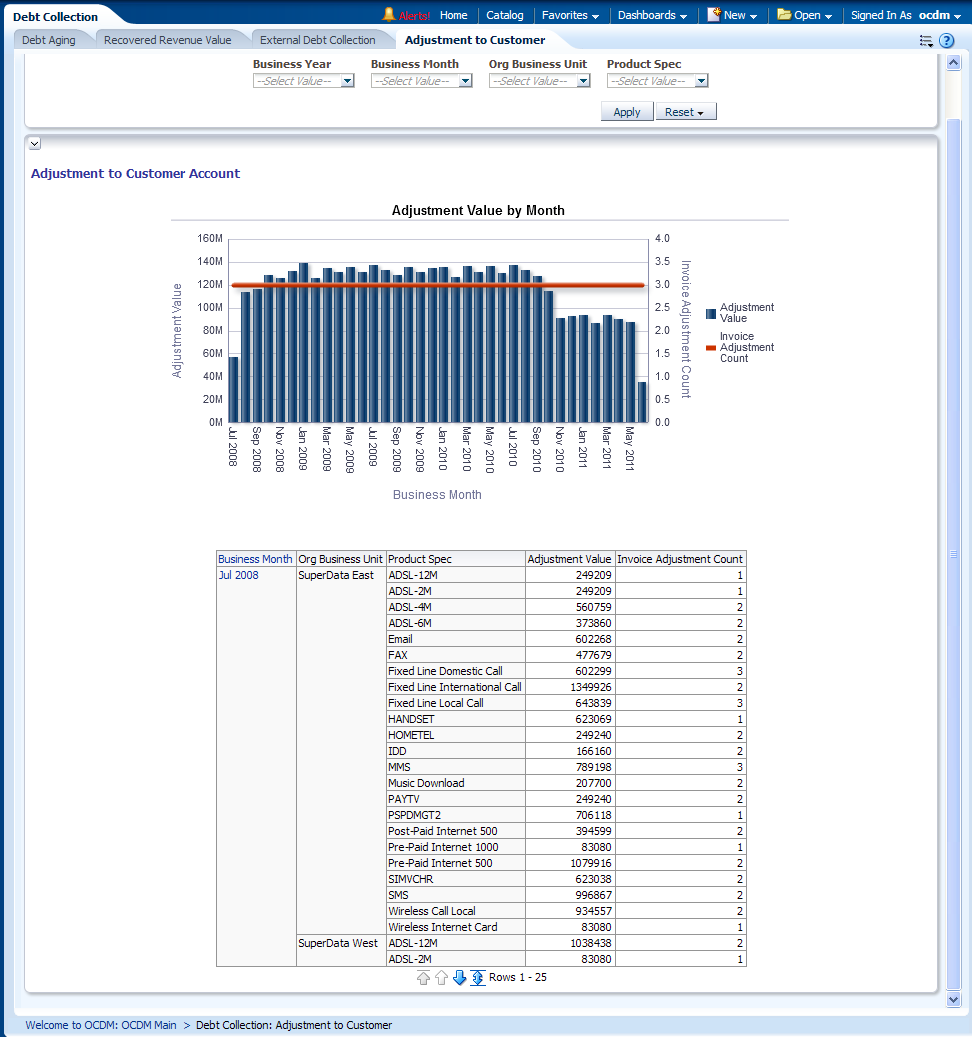
This report, as shown in Figure 13-42 describes the adjustment value and count for each product.
Report dimensions are:
-
Business Time
-
Product
Figure 13-42 Revenue Debt Collection Adjustment to Customer Report
Description of "Figure 13-42 Revenue Debt Collection Adjustment to Customer Report"
Refund and Adjustment
This area includes the reports: Refund to Customer and Invoice Adjustment.
Refund to Customer
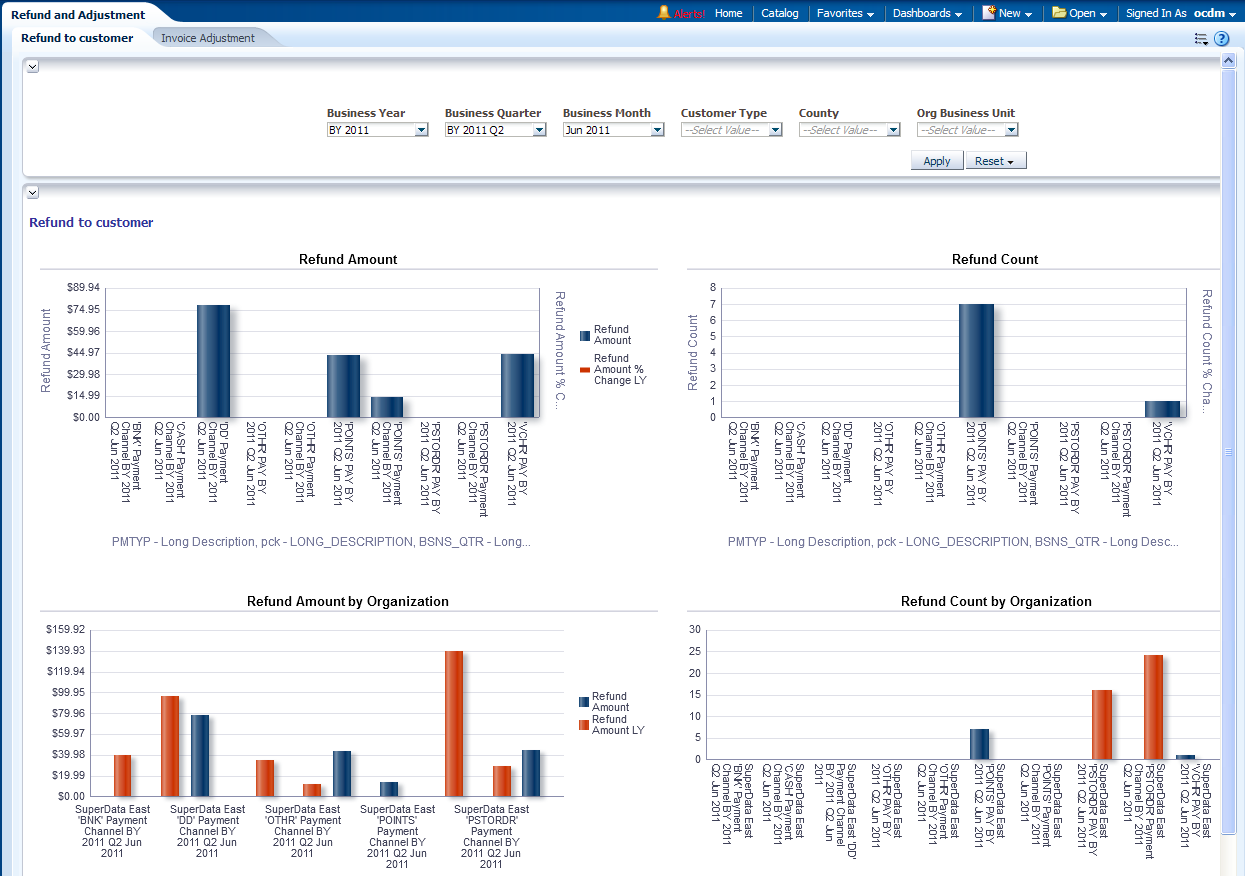
This report, as shown in Figure 13-43 provides summary information about all the refunds made to the customer. for one or more locations.
Report dimensions are:
-
Business Time
-
Customer Type
-
Geography
-
Organization
Figure 13-43 Revenue Refund and Adjustment Refund to Customer Report
Description of "Figure 13-43 Revenue Refund and Adjustment Refund to Customer Report"
Invoice Adjustment
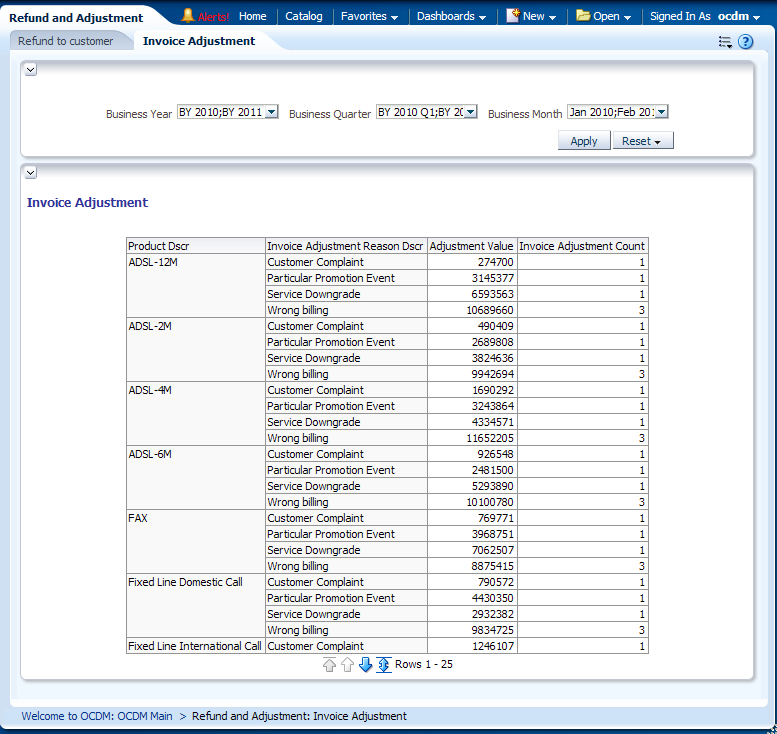
This report, as shown in Figure 13-44 describes adjustment value and count for each product.
Report dimensions are:
-
Business Time
-
Product
Customer Agreements
This area includes the reports: Customer Sum of Future Plans, Monthly Future Plan Drop-Out, and Monthly Contract Sum Loss.
Customer Sum of Future Plans
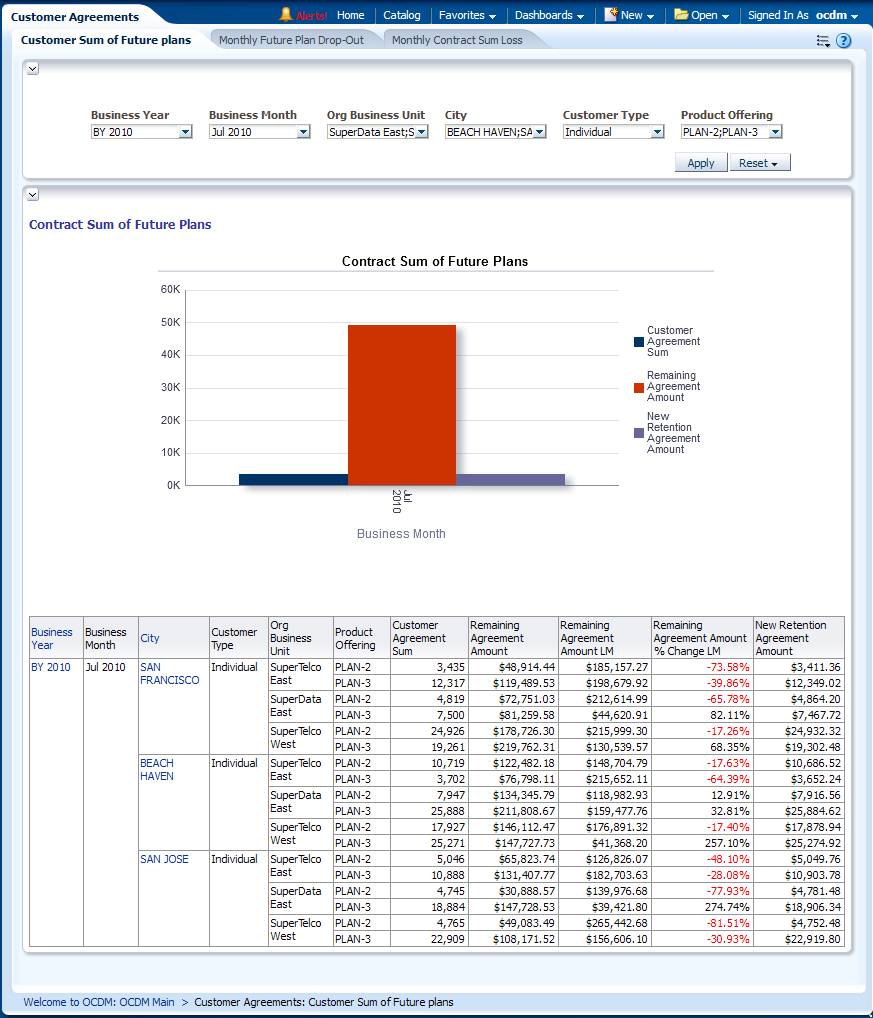
This report, as shown in Figure 13-45 analyzes year and month level contract sum of future plans for the customer type based on LM, % Change LM. The future plan are those contracts customer already signed but not started yet. For example, if today is Feb 20th 2011, and customer may sign a contract starting at Apr 1st 2011 for one year. This is called a Future plan.
Report dimensions are:
-
Business Time
-
Organization
-
Product
-
Geography
-
Customer
Figure 13-45 Revenue Customer Agreements Customer Sum of Future Plans Report
Description of "Figure 13-45 Revenue Customer Agreements Customer Sum of Future Plans Report"
Monthly Future Plan Drop-Out
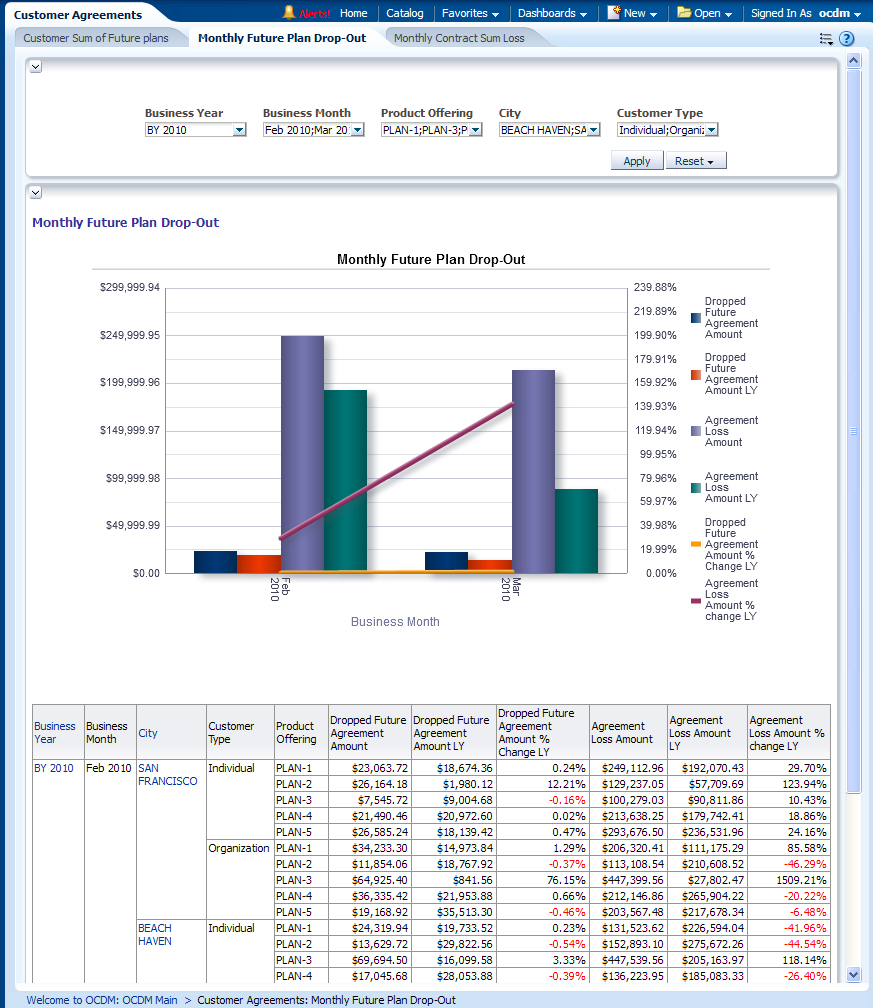
This report, as shown in Figure 13-46 describes product offering wise dropped contract amount and contract loss amount.
Report dimensions are:
-
Business Time
-
Customer Type
-
Product
-
Customer
Figure 13-46 Revenue Customer Agreements Monthly Future Plan Drop-Out Report
Description of "Figure 13-46 Revenue Customer Agreements Monthly Future Plan Drop-Out Report"
Monthly Contract Sum Loss
This report, as shown in Figure 13-47 shows month level replaced contract analysis and terminated contract analysis. If a customer downgrades their subscription, for example, using a new USD 186 package to replace original USD286 package, this is deemed as a contract loss in "replaced contract analysis".
Report dimensions are:
-
Business Time
-
Organization
-
Product
-
Customer
Figure 13-47 Revenue Customer Agreements Monthly Contract Sum Loss Report
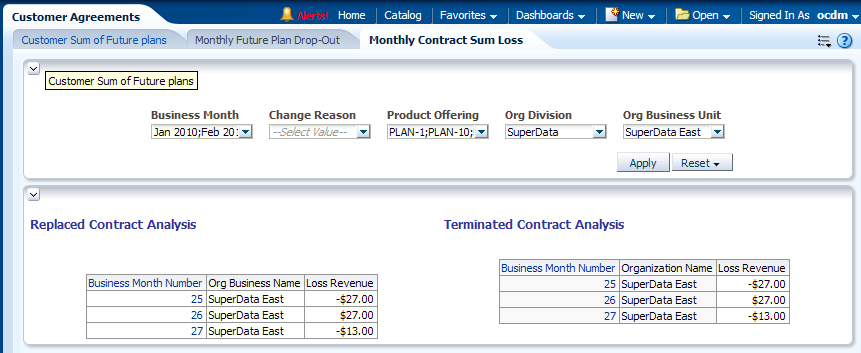
Description of "Figure 13-47 Revenue Customer Agreements Monthly Contract Sum Loss Report"
