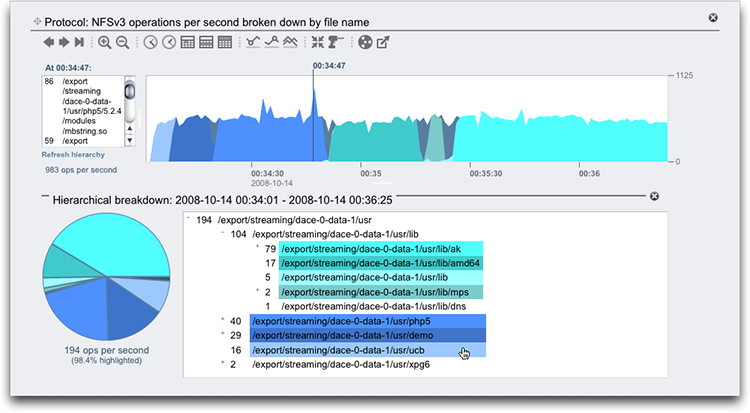
Showing Graph Hierarchy
Graphs that are broken down by filename have a special feature that allows you to view the hierarchical breakdown of traced filenames. As with graphs, the left panel will show components based on the statistic breakdown. If the filenames become too long to fit in the left panel, you can expand it by clicking and dragging the divider between the panel and the graph.
- Create a worksheet as described in Creating a Worksheet (BUI).
-
Click the add icon
 and select a statistic broken down by file name.
Not all statistics can be broken down by file name. The following statistics can be broken down by file name:
-
CACHE > ARC accesses
-
CACHE > L2ARC accesses
-
DATA MOVEMENT > Shadow migration bytes
-
DATA MOVEMENT > Shadow migration ops
-
DATA MOVEMENT > Shadow migration requests
-
PROTOCOL > FTP bytes
-
PROTOCOL > HTTP/WebDAV requests
-
PROTOCOL > NDMP bytes
-
PROTOCOL > NDMP operations
-
PROTOCOL > NFSv2 bytes
-
PROTOCOL > NFSv2 operations
-
PROTOCOL > NFSv3 bytes
-
PROTOCOL > NFSv3 operations
-
PROTOCOL > NFSv4 bytes
-
PROTOCOL > NFSv4 operations
-
PROTOCOL > NFSv4.1 bytes
-
PROTOCOL > NFSv4.1 operations
-
PROTOCOL > SFTP bytes
-
PROTOCOL > SMB operations
-
PROTOCOL > SMB2 operations
-
- Click Show hierarchy on the left side of the statistic.
- Click Refresh hierarchy to update the pie-chart and tree-view.
-
Click the exit icon
 , in the upper-right corner, to close the hierarchical
breakdown.
