The KPI Dashboard provides a multi-site system-level summary of performance and operational health indicators. The display includes indicators for:
- Offered load (transaction rate)
- System capacity (counters for active sessions)
- Inter-system connectivity
- Resource utilization (memory, CPU)
- System status
- Alarms
- Protocol errors
The KPI dashboard displays the indicators for all the systems on a single page, with each MRA KPIs in a separate table when MRA systems are managed by the CMP system or with all MPE KPIs in one table when MRA systems are not managed by the CMP system (that is, an MPE-only deployment). Each row within a table represents a single system (either an MPE or MRA server). The table cells are rendered using a color scheme to highlight areas of concern that is well adopted by the telecommunication industry. The table contents are periodically refreshed every 10 seconds; this time period is not configurable. The color changing thresholds are user configurable.
Figure 1 illustrates the dashboard’s contents when MRA systems are managed by the CMP system.
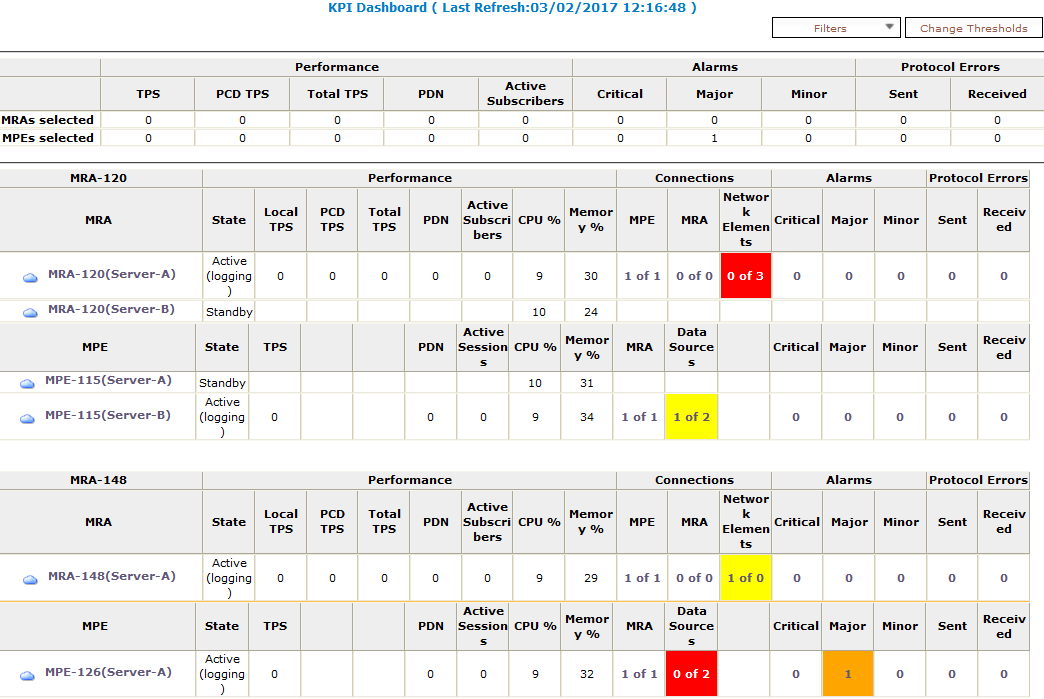
The MRAs selected row displays the aggregation count for user-selected MRA devices. The MPEs selected row displays the aggregation count for the MPE devices that belong to the user-selected MRA devices.
- TPS
- PCD TPS
- Total TPS
- PDN
- Active Subscribers
- Critical Alarm Count
- Major Alarm Count
- Minor Alarm Count
- Protocol Errors Sent
- Protocol Errors Received
When there are no MRA devices managed by the CMP system, the displayed headings are:
- Name of MPE
- Performance:
- State
- TPS
- PDN
- Active Sessions
- CPU %
- Memory %
- Connections
- Data Sources
- Network Elements
- Alarms
- Critical
- Major
- Minor
- Protocol Errors
- Sent
- Received
In the top right corner there is a Change Thresholds button that allows you to change threshold settings used to determine cell coloring. When MRA devices are managed by the CMP system, a button on the top left corner lists each of the MRA devices with a check box that allows the user to enable/disable the table for that MRA device.
Individual servers are identified by name and the order in which they were defined within their cluster (Server-A, Server-B, Server-C). If any of these are set to Reverse Site Preference, then an “R” will appear by the server's State. For the standby or spare server, several columns are not populated (since those servers are not active); the only columns that contain data are: Status, CPU%, and Memory%. For Connections, Alarms, and Protocol Errors, the column's information is a hyperlink that will open a more detailed report.
A cloud icon (![]() ) indicates that the server is executing on a virtual machine.
) indicates that the server is executing on a virtual machine.
If a monitored system is unreachable, or if the data is unavailable for some reason, then the status is set to Off-line and the values in all the associated columns is cleared. In this situation, the entire row is displayed with the error color (red). If a monitored system does not support KPI retrieval then the status is set to N/A and the values in all the associated columns are cleared. No coloring is applied.
The columns that display information in the form of X (Y%) (e.g. TPS and PDN Connections”/“Sessions) correspond to the following: X represents the actual numeric value and Y represents the % of rated system capacity that is consumed. If the system is executing on a virtual machine, values for TPS, Sessions, and Active Subscribers are only calculated if capacity values are explicitly set. See Configuring Advanced Device Settings for more information.
The columns that display connection counts are displayed in the form X of Y where X is the current number of connections and Y is the configured number of connections. When X and Y are not the same, the column uses the warning color to indicate a connectivity issue, unless X is 0, in which case the error color is displayed.
The Alarm and Protocol Errors columns display the number of current events. If there are any Critical or Major alarms, then these cells will be colored red or yellow, respectively.
Click the name of an MPE or MRA device to display detailed statistics. For more information on detailed device statistics, see the description on the Reports tab for the device.