Using Multiple Chart-field nPlosion
The Multiple Chart-field nPlosion feature is an extension of the existing nPlosion feature. You can specify any number of fields for nPlosion with Multiple Chart-field nPlosion.
Multiple Chart-field nPlosion is used to provide functionality for data in financial reports to show detailed data values when there are multiple chart fields specified in the report. This data view helps people performing detailed financial analysis to get the data at the most granular level, and to do a comparative study across different entities like Account, Department and Business Units.
This feature offers:
nPlosion on more than two chart-fields using a single criterion.
Detailed data view at every entity or level.
A summary or roll-up view at every level.
Note: Multiple chart-field nPlosion does not combine with a cell criteria.
Note: Filter criteria must be defined as a row criteria and all chart-fields for nPlosion must be added in this criteria.
Image: Defining Multiple Chart-field nPlosion
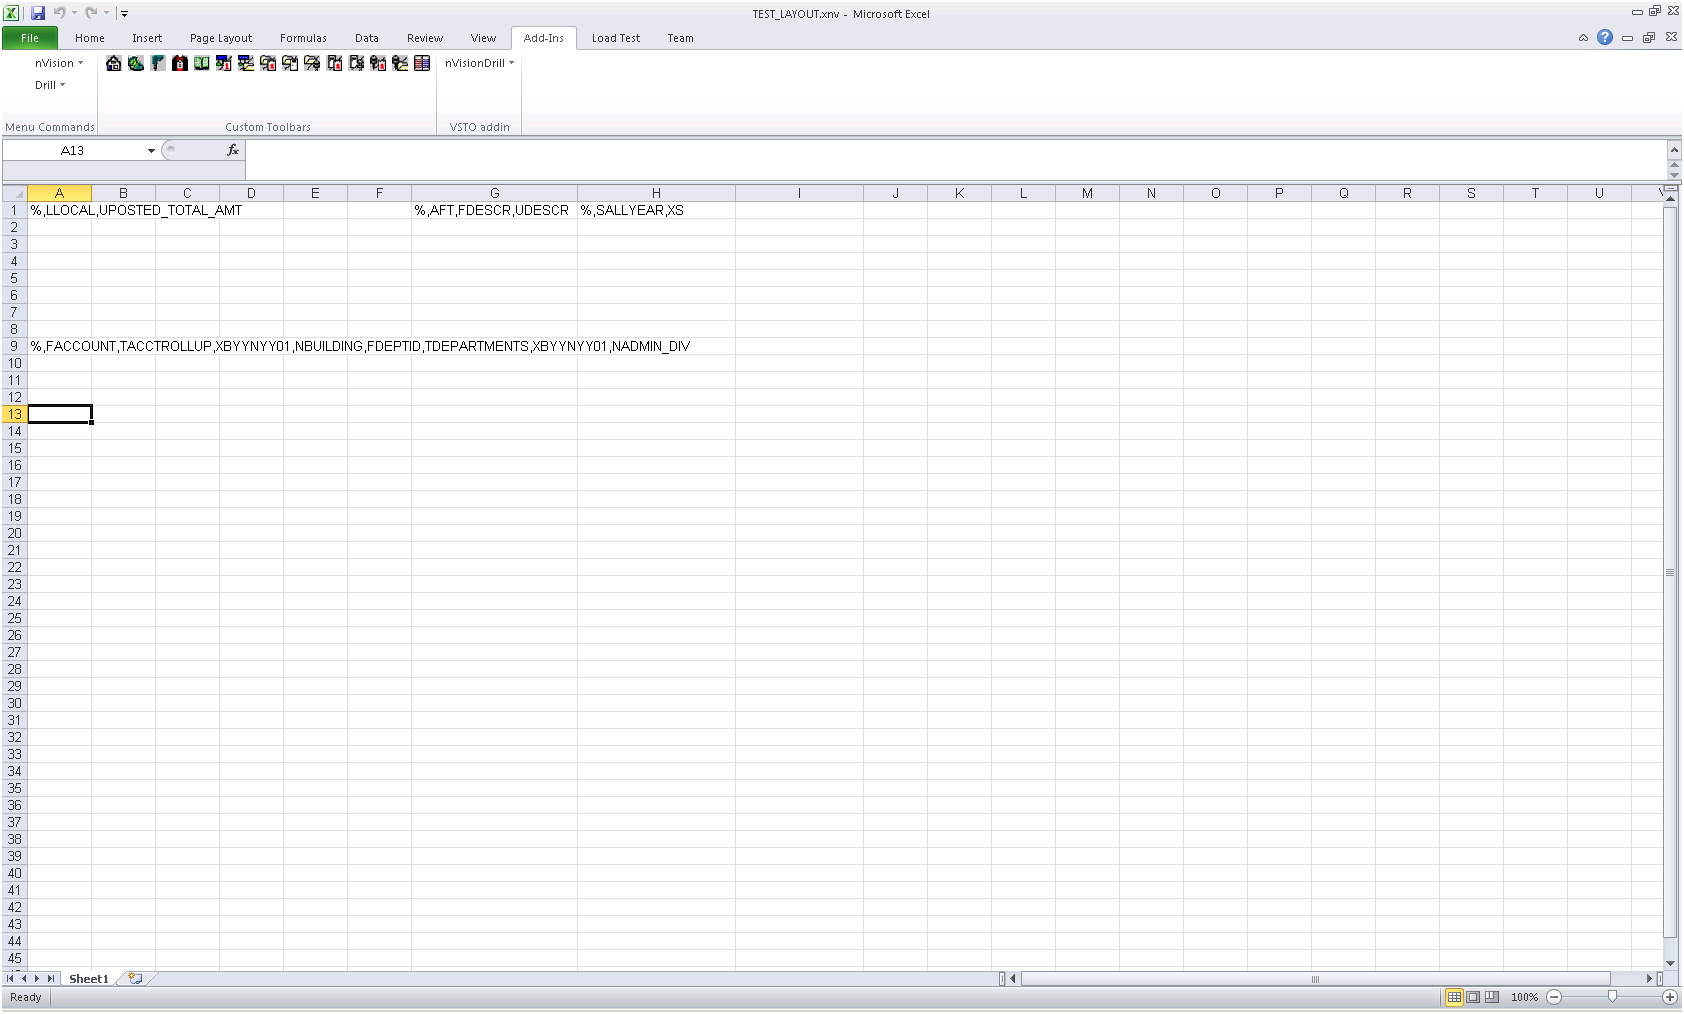
This example illustrates how to define Multiple Chart-field nPlosion using the existing functionality in nVision:
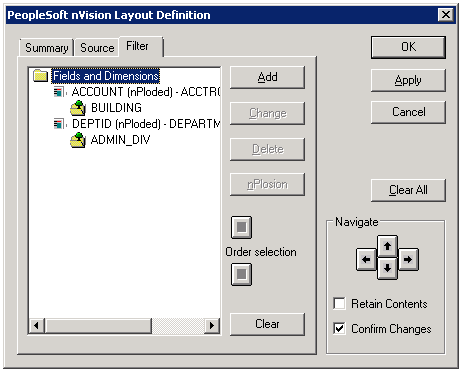
Image: Multiple Chart-field nPlosion — Layout
This example illustrates the fields and controls on the multiple chart-field nPlosion Layout window:
To define Multiple Chart-field nPlosion in nVision:
Open any existing layout or create a new one.
Select from the menu.
In the PeopleSoft nVision Layout Definition dialog box, select the cells to which you want to apply multiple chart-field nPlosion.
Select the Filter tab.
Click the Add button to add the chartfield.
Select the chart-field and then select the tree.
Add the node for which nPlosion is required.
Repeat steps 6 through 8 to add subsequent chart-fields.
Click OK.
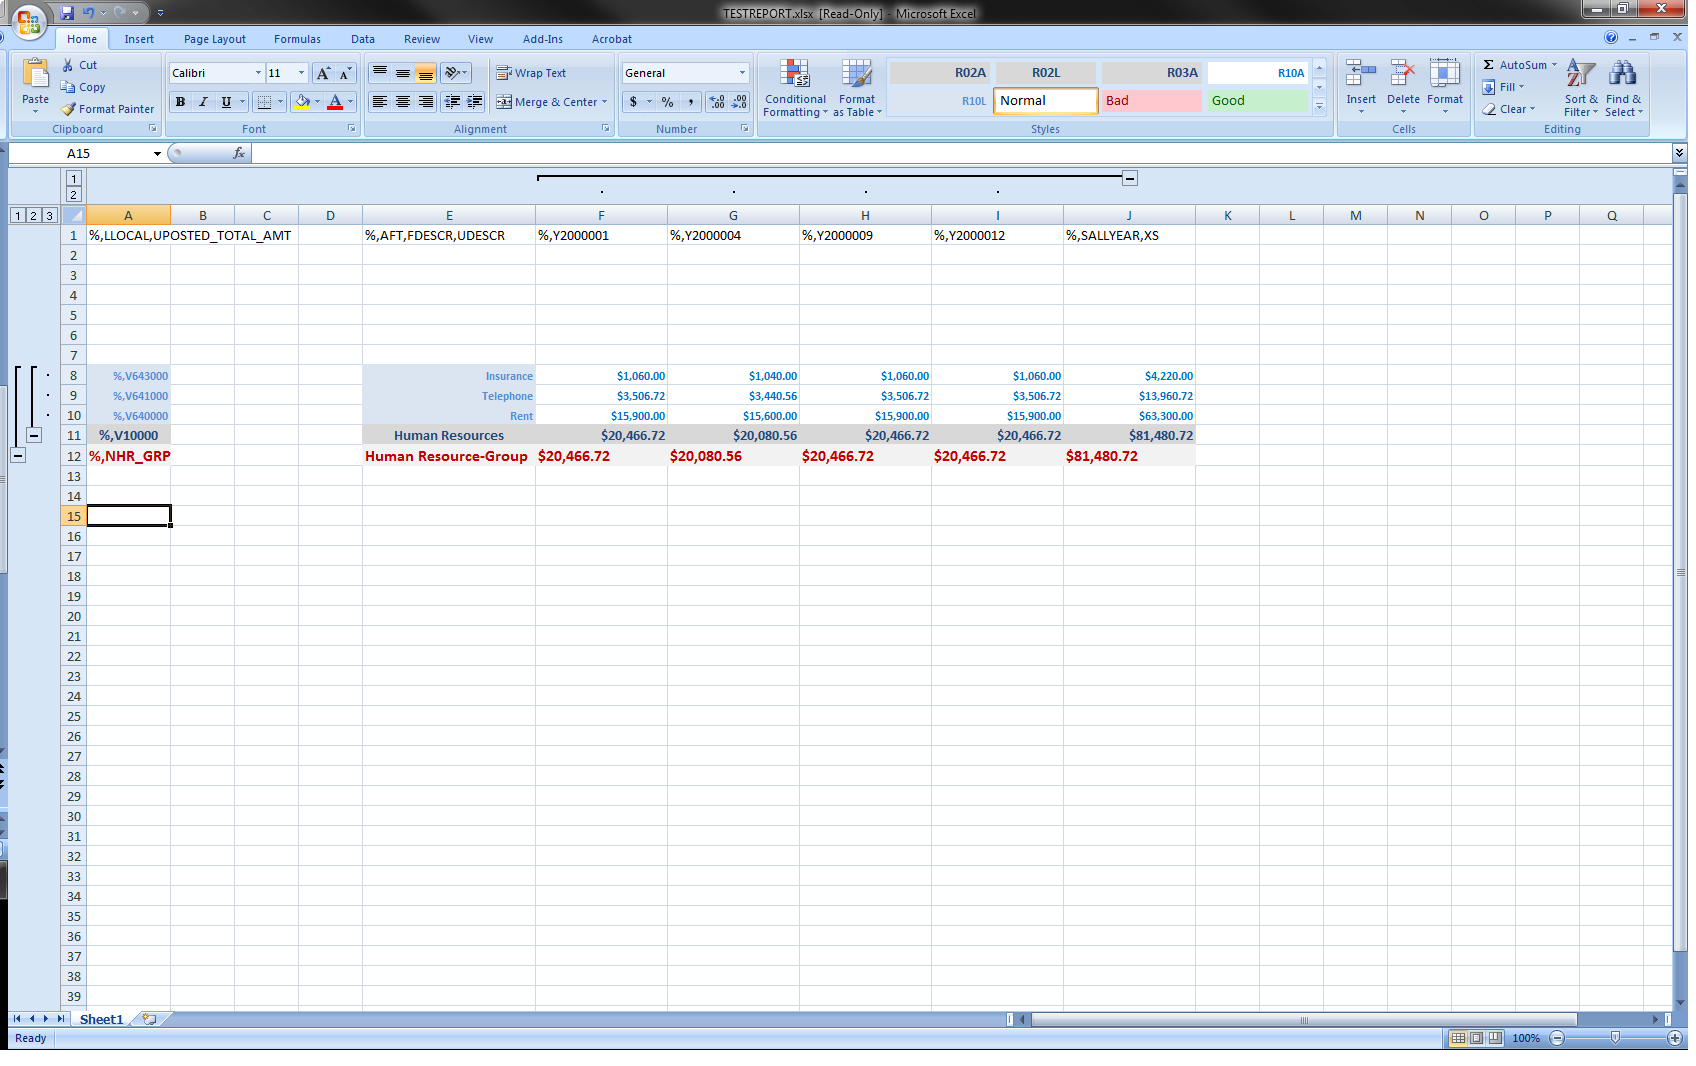
Image: Multiple Chart-field nPlosion — Report
This example illustrates the fields and controls on the multiple chart-field nPlosion Style Wizard window:
You can enable or disable nPlosion for specific:
Criteria fields
To enable or disable nPlosion for a specific criteria field, select a field from the Fields and Dimensions list on the PeopleSoft nVision Layout Definition – Filter dialog box, and then click the nPlode button. This generates underlying details only for the criteria fields you specify.
Query or ledger TimeSpans
To enable or disable nPlosion for a query or ledger timeSpan, select or clear the nPlode TimeSpan option on the PeopleSoft nVision Layout Definition – Source dialog box. This option is only available if you have a TimeSpan specified. This option generates detail columns for the individual periods in the TimeSpan; for example, the periods comprising year-to-date.
Note: Timespan must be specified as a column criteria for multiple chart-field nPlosion.
Report requests
To enable or disable nPlosion for a report request, open the PeopleSoft nVision Report Request dialog box and select or clear the Enable nPlosion If Specified In Layout option. You can specify summary rows before or after nPlode rows based on an Excel option in layout. To set this, open your layout in Excel and select select Data, then select Group and Outline, then select Settings.
Note: Drilldowns are not allowed for multiple chart-fiels nPlosion.