Viewing the Application Server Domain Dashboard
Access the Application Server Domain dashboard (On the Application dashboard, click the application server domain.)
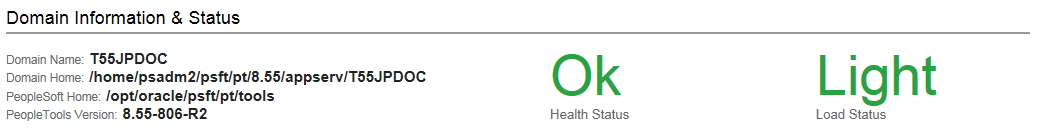
The Domain Information and Status section of the dashboard displays the overall health of the domain and provides details of the domain.
Image: Domain Information and Status section
This example illustrates the fields on the Domain Information and Status section. You can find definitions for the fields later on this page.
|
Field or Control |
Definition |
|---|---|
| Domain Name |
The name of the application server domain. |
| Domain Home |
The location of the application server domain. |
| PeopleSoft Home |
The location of PS_HOME. |
| PeopleTools Version |
The version of PeopleTools currently running on the system. |
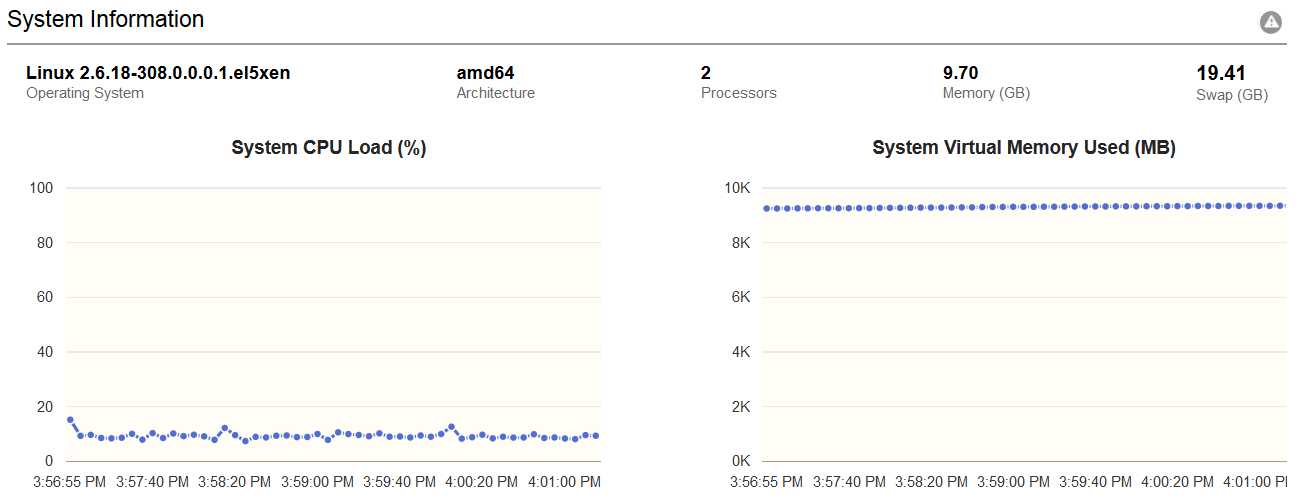
The System Information section of the dashboard provides basic information of the host machine.
Image: System Information section
This example illustrates the fields on the System Information section. You can find definitions for the fields later on this page.
|
Field or Control |
Definition |
|---|---|
| Operating System |
The operating system make and version. |
| Architecture |
The machine architecture. |
| Processors |
The number of available processors on the machine. |
| Memory |
The total amount of virtual memory (in GB) available on the machine. |
| Swap |
The total amount of swap space (in GB) available on the machine. |
Note: If the system CPU or virtual memory usage is consistently high, then investigate whether the host is overloaded. If so, add more hosts to share the workload.
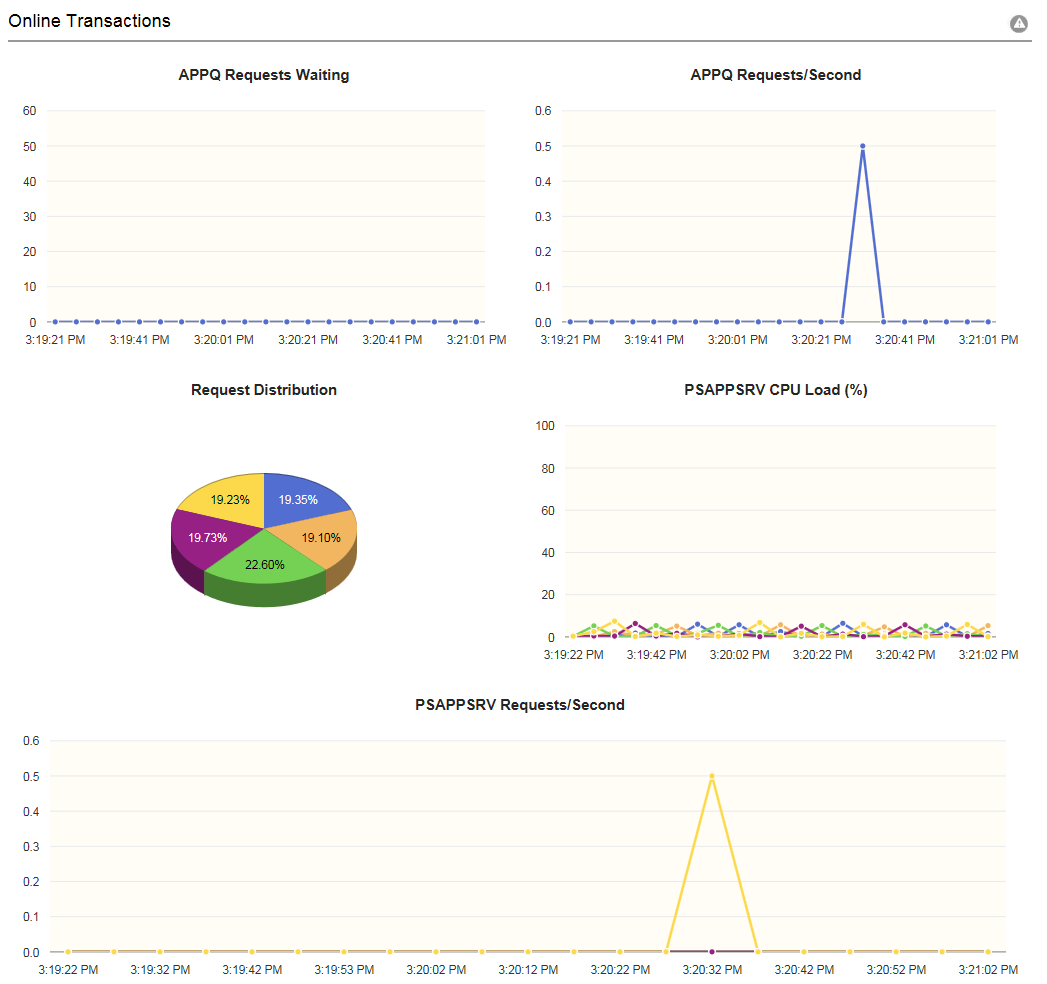
The Online Transactions section of the dashboard provides details of the APPQ and the PSAPPSRV processes.
Image: Online Transactions section
This example illustrates the fields on the Online Transactions section. You can find definitions for the fields later on this page.
|
Field or Control |
Definition |
|---|---|
| APPQ Requests Waiting |
The number of requests currently in queue on the APPQ process. |
| APPQ Requests/Second |
The mean number of requests processed the APPQ process during a recent time period. |
| Request Distribution |
The distribution of requests (in percentage) across PSAPPSRV processes. |
| PSAPPSRV CPU Load |
The CPU utilization (in percentage) by each active PSAPPSRV process in the domain. Note: If PSAPPSRV CPU usage is high, then some PIA requests are using high levels of resources. |
| PSAPPSRV Requests/Second |
The mean number of requests processed per second by each active PSAPPSRV process during a recent time period. |
The following table lists the APPQ process issues and their resolutions:
|
Symptom |
Cause |
Action |
|---|---|---|
|
The graph consistently shows ten or more requests waiting for several minutes. |
Add more servers for handling the load either by adding more server processes within the current domain or by adding more application server domains. Note: Ensure that server processes per domain are not more than forty five. |
|
|
APPQ Requests/Second are low but APPQ requests waiting are high. |
Some APPQ requests take time to complete. |
Investigate whether the following factors are causing the delay:
|
|
Slow-performing requests. |
Tune to improve the performance. |
|
|
The throughput is slow for light requests. |
Investigate whether the server lacks processing power. If so, move application server domains to a host with more CPUs and RAM, higher network bandwidth, and faster storage. |
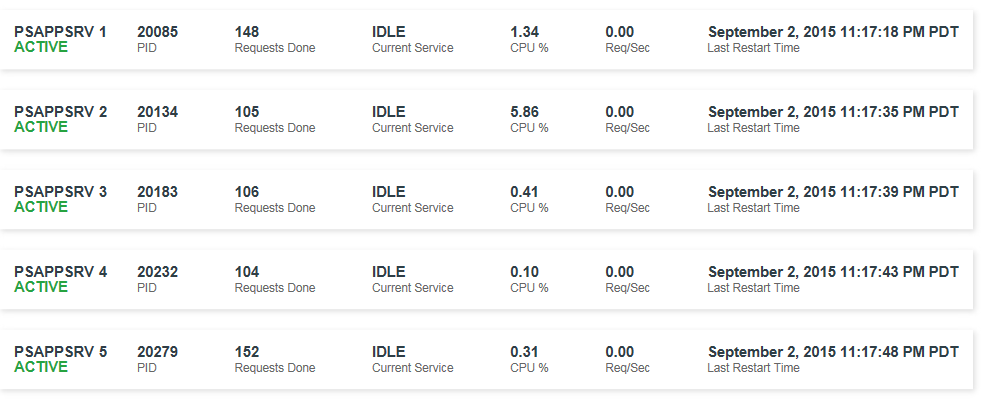
The PSAPPSRV process section of the dashboard displays high-level information about each process and also serves as links to the PSAPPSRV process dashboard.
For a description of the PSAPPSRV process dashboard, see Viewing the PSAPPSRV Process Dashboard.
Image: Application Server Processes section
This example illustrates the fields on the Application Server Processes section. You can find definitions for the fields later on this page.
|
Field or Control |
Definition |
|---|---|
| PID |
The process ID of a process. |
| Requests Done |
The number of requests processed by the PSAPPSRV process. |
| Current Service |
The Tuxedo service currently being processed by the server. The value is IDLE if no request is being processed. |
| CPU% |
The CPU utilization by the PSAPPSRV process. |
| Req/Sec |
The number of requests processed per second by the PSAPPSRV process. |
| Last Restart Time |
The time when a process was last started. |
Note: If Req/Sec is low but the processes are idle frequently, then check the Application Server (JOLT Listener) section in the psappsrv.cfg file or check using PSADMIN. If the Max Handlers setting is very low, set it to be greater than or equal to the setting for Max Instances in the PSAPPSRV section.
For more information, see PeopleTools Performance Guidelines Red Paper (Doc ID 747389.1), Working with Application Server Guidelines.
For information on the log files section of the dashboard, see Viewing Log Files.
Access a PSAPPSRV process dashboard by clicking a PSAPPSRV process on the Application Server Domain dashboard.
System Information
The System Information section of the dashboard displays the details of the parent domain, that is, the application server domain.
See System Information.
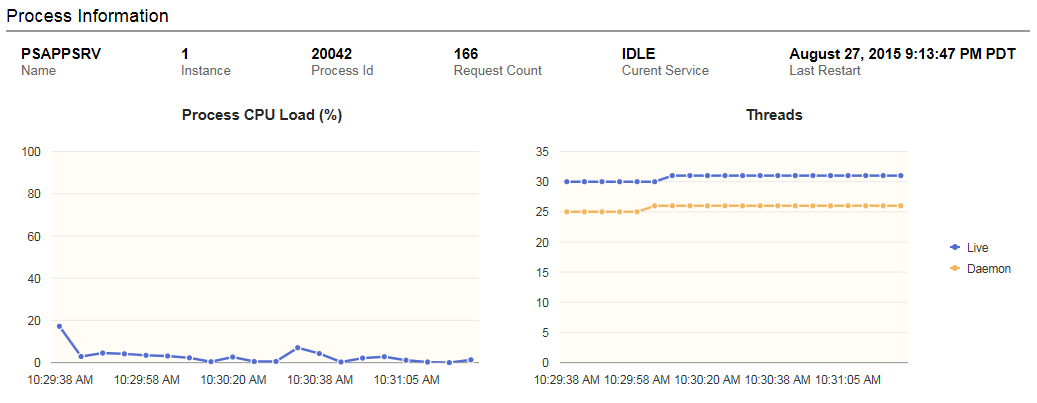
Process Information
The Process Information section of the dashboard provides details of the PSAPPSRV process.
Image: Process Information section
This example illustrates the fields on the Process Information section. You can find definitions for the fields later on this page.
|
Field or Control |
Definition |
|---|---|
| Name |
The name of the process. Note: The process name will always be PSAPPSRV. |
| Instance |
The Tuxedo designated instance for the PSAPPSRV process. |
| Process ID |
The system-level process ID associated with the process. |
| Request Count |
The number of requests completed since the PSAPPSRV process was started. This is a run-time attribute that is kept across server restart, but is lost at server shutdown. |
| Current Service |
The Tuxedo service currently being processed by the server. The value is IDLE if no request is being processed. |
| Last Restart |
The time the server was last restarted. |
| Process CPU Load |
The CPU utilization (in percentage) by the process. |
| Threads Live |
The number of live threads in the process. |
| Threads Daemon |
The number of live threads that are daemon threads. |
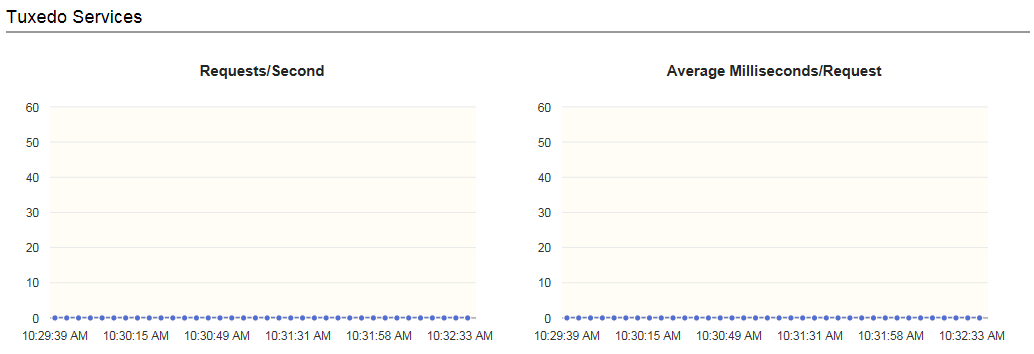
Tuxedo Services
The Tuxedo Services section of the dashboard displays the Tuxedo request processing for the server instance.
Image: Tuxedo Services section
This example illustrates the fields on the Tuxedo Services section. You can find definitions for the fields later on this page.
|
Field or Control |
Definition |
|---|---|
| Requests/Second |
The mean number of requests the server processed per second over a recent time period. |
| Average Milliseconds/Request |
The average time (in milliseconds) taken by the server to process a request since the server was started. |
JVM Heap
The JVM Heap section of the dashboard displays details of JVM that is similar to the JVM Heap section on the web server.
See JVM Heap.
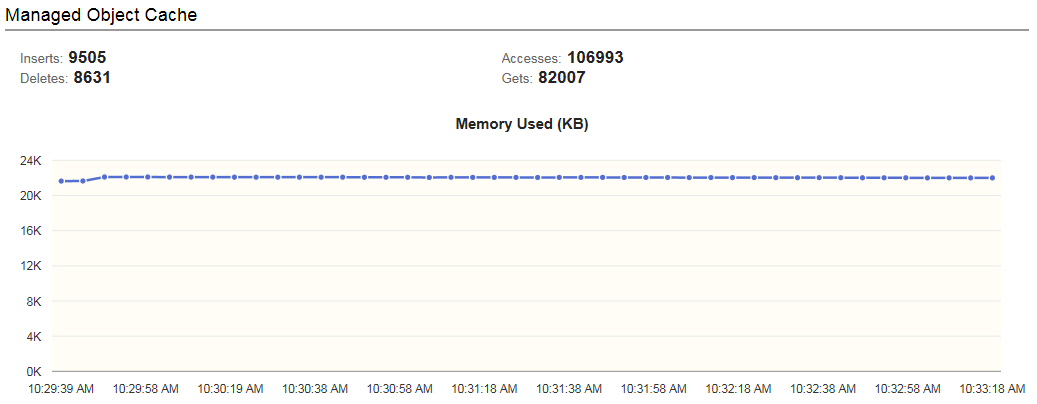
Managed Object Cache
The Managed Object Cache section of the dashboard displays the memory allocated to cache.
Image: Managed Object Cache section
This example illustrates the fields on the Managed Object Cache section. You can find definitions for the fields later on this page.
|
Field or Control |
Definition |
|---|---|
| Inserts |
The number of cache insert operations since the server last restarted. |
| Deletes |
The number of cache delete operations since the server last restarted. |
| Accesses |
The number of cache access operations since the server last restarted. |
| Gets |
The number of cache get operations since the server last restarted. |
| Memory Used |
The amount of resident memory (in KB) currently allocated to cache. |