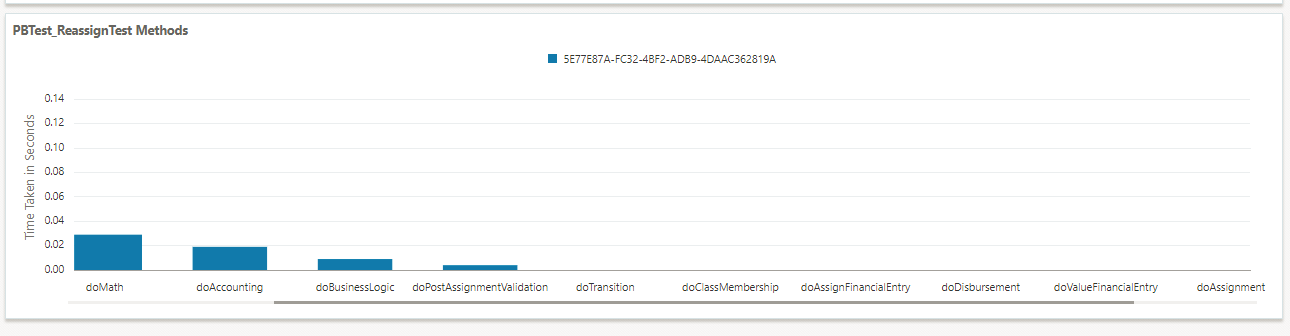
Chart4 - The Methods that were Executed within an Activity
Processing Time (Y-axis) Vs Activity methods executed by activity that is selected in Chart 2 and Chart 3 (X-axis)
Chart 4 will be populated with the method data from the selected activity on Chart 3. The Activity's Name carries from selection on Charts 2 concatenated with the word "Methods". This chart's title will change as the user makes other selections on Chart 2.
In this chart, the Y-axis represents processing time and the X-axis represents activity methods executed by the selected activity in Chart 3.
- Valuation
- Value Financial Entry
- Math
- Class Membership
- Business Logic
- Assignment
- Assign Financial Entry
- Transition
- Post Assignment Validation
- Disbursement
- Accounting
- Spawns
- Activity Sequence
The data is arranged by most expensive methods on the left progressing to least expensive methods to the right.